
Near-term and intermediate-term technical trends remain bullish for US Equities, but momentum has now grown quite stretched heading into this week’s FOMC meeting. The combination of overbought conditions coupled with a near completion of DeMark-based exhaustion signals points to a possible stalling out post this week’s likely Fed rate cut (as shown by Fed Fund futures). While the intermediate-term trends and momentum remain bullish, I don’t find the near-term risk/reward appealing this week with SPX over 6600. Market breadth has declined in the short run (last two weeks), and I suspect that some minor consolidation could prove likely starting mid-week. Given how stretched SPX has become lately, I feel that any daily close under the 5-day rising moving average (SPX-6566) likely could coincide with 3-5 days of weakness. At present, DXY and Treasury yields remain downward sloping, precious and industrial metals remain in short-term uptrends, along with Cryptocurrencies. Global developed market and Emerging market Equities remain in bullish uptrends.
Overall, my short-term concerns have to do with the following:
- Near-term overbought conditions – 2-hour charts show RSI (Relative Strength Index) having reached levels which coincided with pullbacks this year on most occasions (8/13, 7/28, 5/16, 1/23, and 2/19) while daily RSI is now approaching 70.
- DeMark-related exhaustion is now close to completion on daily charts along with 240-minute charts (and might be close to signaling exhaustion on 60, 120-minute charts into Wednesday on a bit more strength). These are normally the timeframes I utilize personally to identify a possible confluence for market peaks and troughs of a short-term nature. However, given that weekly DeMark TD Sequential and/or TD Combo signals on weekly charts likely won’t show TD Countdown signals in unison (both ^SPX and QQQ -0.35% ) for another 2-4 weeks, I’m skeptical that any mild setback this week will prove all that important.
- Market breadth has waned in the last two weeks and generally has been lower since July of this year. While a pick-up in breadth did occur from early August into late August, that has since waned in the last week. (Note, despite today’s +0.47% ^SPX gain, seven out of 11 sectors were lower on the day (based on the 11 Equal-weighted ETFs that make up ^SPX.)
- SPX rally from 9/2 has nearly exactly equaled the rally which began around this same time in August (8/1-8/15). This recent leg higher from 9/2 would be equal in points gained to the rally from 8/1 at around 6630 in ^SPX.
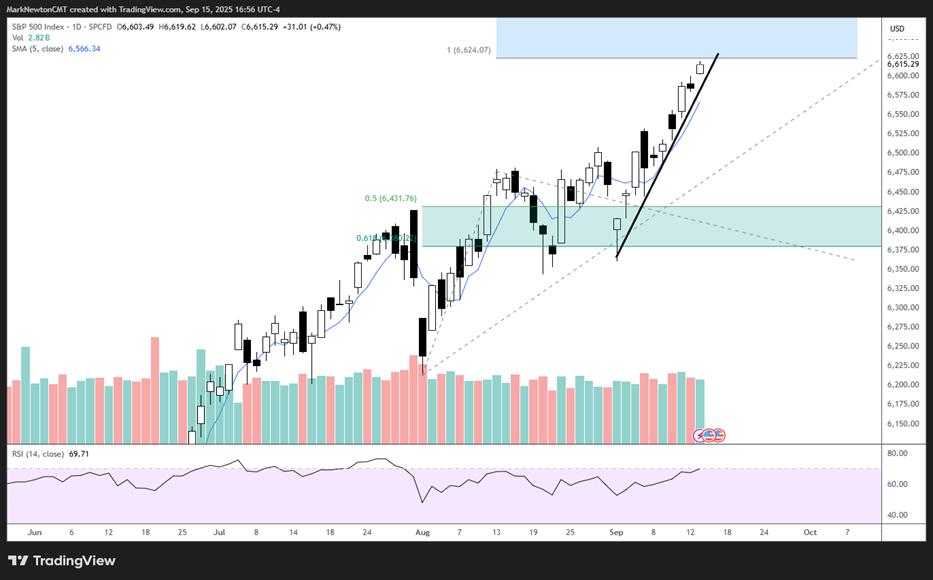
Any break of ^SPX-6566 (5-day rising moving average) could allow for a 38-50% retracement of the rally from early September (+255 ^SPX points since 9/2 lows, or around +4% gains since early September during a historically very weak stretch seasonally speaking).
Thus, a break this week of 6566 should lead either to 6527 or 6495 before stabilizing and then pushing back sharply higher into October. Given the comeback in Technology and ongoing poor sentiment levels on both a retail and institutional basis, it’s hard to put much stock in a meaningful selloff just yet.
S&P 500 Index
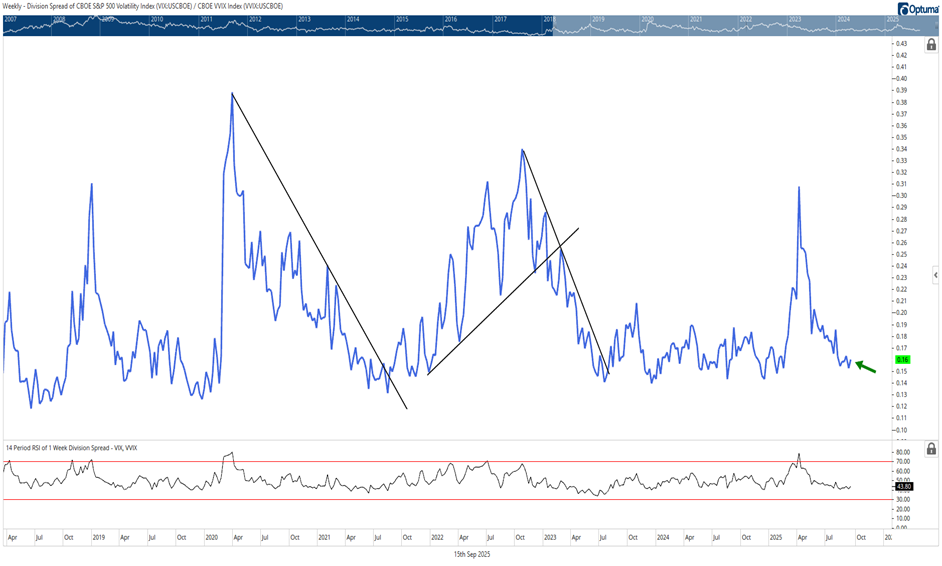
VIX relative to VVIX has neared the lows of the past couple of years
One ratio I find helpful for market turns concerns multi-month trend breaks of the ratio between the CBOE VIX index and the CBOE VIX of VIX index (expected volatility of the 30-day forward price of the VIX).
The VIX curve has gotten historically steep lately, which is reflected in the sharp downward slope of the Spot VIX relative to the VVIX. Given that the market has priced in significantly more rate cuts than the FOMC has alluded to, this represents a possible risk if the FOMC turns more hawkish.
Historically, I find that when downtrends of VIX/VVIX are broken (such as what happened back in late 2021 and also late 2023 and early 2025, this has signaled a flattening out in the VIX curve as the spot VIX rises and plays catch-up.
I don’t sense that this is imminent at this point, just yet, and there’s been no signal. However, given that this ratio lies near the lows seen in recent years, owning the VIX at current levels for those inclined to hedge looks attractive on a 2-month timeframe.
Ideally, VIX might show some near-term gains this week into next week before settling again into October. However, the cyclical time when a possible Fall correction could occur might materialize from early October into November. Such a move could cause a rally in VIX up to the high 20s and would be something to prepare for ahead of time.
Overall, trading the VIX can prove difficult, technically, but I feel it’s attractive at Monday’s close of 15.68 (VIX rose today while SPX also rose) for a coming bounce likely into next week (as part of a larger move higher into November, before declining to new lows into year-end.
Discretionary has temporarily stalled out vs. Staples after a sharp multi-month run-up
One of the gauges I look at for “Risk-on” vs. “Risk-Off” concerns the ratio of Consumer Discretionary vs. Consumer Staples (shown here as a ratio of their respective Equal-weighted ETFs- RCD 0.09% vs. RHS -0.03% ).
As shown below, the big breakout in July helped Discretionary show some above-average strength when compared to Consumer Staples.
“Discretionary” has outperformed the SPX since mid-June, three months ago, and has been the best performing Equal-weighted sector of SPX (out of 11) with returns of +14.86% into 9/12/25.
However, there’s been some stalling out in this gauge in the last three weeks, despite Consumer Staples having declined to relative new lows in September (more on this later).
Overall, any underperformance in Consumer Discretionary (groups like the Homebuilders are quite attractive here) should make these quite attractive technically, and I expect further outperformance into year-end and (in the short run) into October.
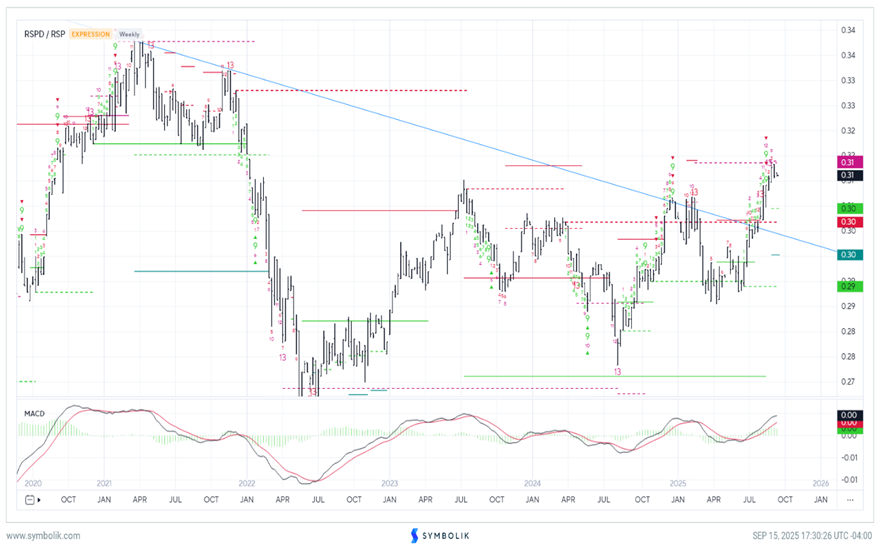
DeMark weekly TD 13 countdown signals are present but not confirmed for the ratio of RSPD vs RSPS. However, there remains no signals on monthly charts, and it’s my view that this long-term breakout (which directly coincided with an uptick in performance for Discretionary, should be also important in allowing this outperformance to continue into year-end.
RSPD/RSP
Consumer Staples turned down to new yearly lows into late August
Given that REITS and Utilities have shown strength because of rates dropping and some of the Power Generation companies helping to fuel the AI trade within Utilities, I typically look to Consumer Staples to serve as a Defensive sector to watch carefully.
While “Staples’ did bounce a bit from July into August, the last five weeks have seen Staples turn down sharply vs. Equal-weighted ^SPX.
This normally is the opposite of what “Market bears” want to see, who are betting on a market decline. Historically, the defensive sectors start to firm up prior to a market correction.
This time, Staples has moved to new annual lows vs the Equal-weighted S&P 500 (ratio of RHS -0.03% vs. RSP shown below).
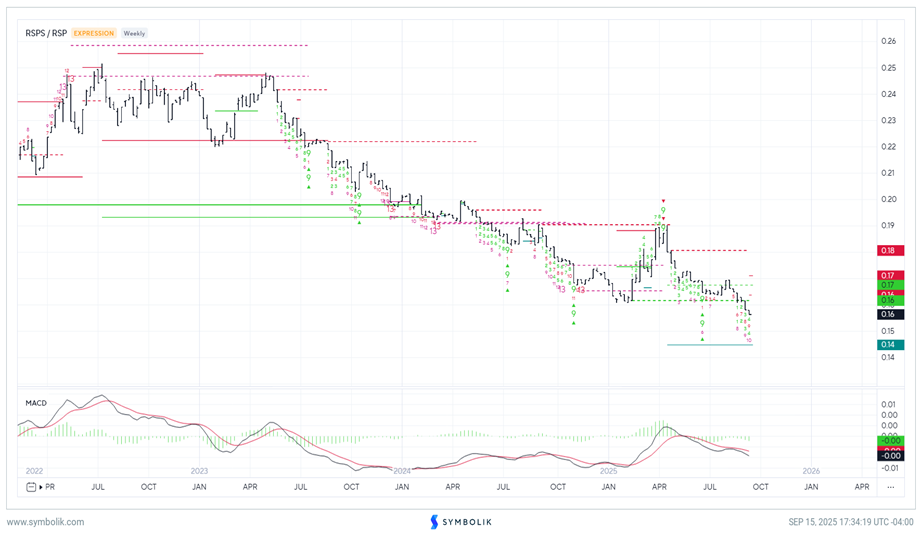
Overall, it looks early for Staples to bottom. However, I am expecting a rally in this sector from early October into November. (Interestingly enough, weekly DeMark counts on RSPS vs RSP suggest possible downside exhaustion into early October, exactly when some of the cycles start to exert a bit more forceful downside pull.)
I’ll discuss this next month, but for now, Staples underperforming sharply likely translates into any near-term Stock market pullback likely proving short-lived.
RSPS/RSP