
Equity trends from August remain bullish but yet remain lower than recent peaks from mid-November on 11/11/24. Tuesday’s stabilization is suggestive of a bounce in US Equities between now and next week’s Thanksgiving holiday. Treasuries also seem to be turning higher, and it’s thought that both Treasury Yields and the US Dollar might retreat into December following the unraveling of the so-called “Trump trade.” If/when Technology cannot mount any larger rally into next week, then markets might show further consolidation into early to mid-December, which would line up with cycle projections and recent lackluster breadth. At present, a rally seems to be underway into early next week and needs to be watched carefully for evidence of structure and broad-based participation (or lack thereof).
A little Charles Dickens might be apropos as the Holidays approach, though not “A Christmas Carol” but rather “A Tale of Two Cities.” As the novel begins: “It was the best of times, it was the worst of times, it was the age of wisdom, it was the age of foolishness”
As the title of today’s report suggests, we’ve seen an interesting stock market over the last month with the 2024 Election year performance set to potentially bring about the best performance in an Election year in over 40 years.
Yet, more than half of all major S&P Sectors have been down over the last month, and some of them, like Materials, Healthcare, and Consumer Staples, dramatically so, declining over 4%. Healthcare is certainly important to the SPX as it remains the 2nd largest sector by market capitalization.
Market breadth has nose-dived over the last six weeks, and many seem oblivious to the degree that Technology has been lagging. This isn’t bearish for the SPX tape itself of course.. just yet, but it does raise yellow flags.
The ideal situation would be to see Technology turn up sharply and begin to show better performance to join the recent superb relative strength seen in Financials and Industrials. However, this didn’t happen with NVDA, and it hasn’t happened yet with AAPL, nor with META and GOOGL lately.
As I wrote yesterday with regards to ^SPX, it does look to trend up into early next week and likely fill the gap from last Thursday which could carry SPX initially to 5942, or above to near 5954, or 5982.
However, the shape of the wave structure on this move coupled with negative cyclical projections and lackluster breadth makes me a bit wary in expecting an immediate push back to new highs.
Increasingly, technicals seem to show the possibility of a rally early next week, which then turns down early to mid-December. I’ll monitor in the days to come to gain a better idea of when this could materialize.
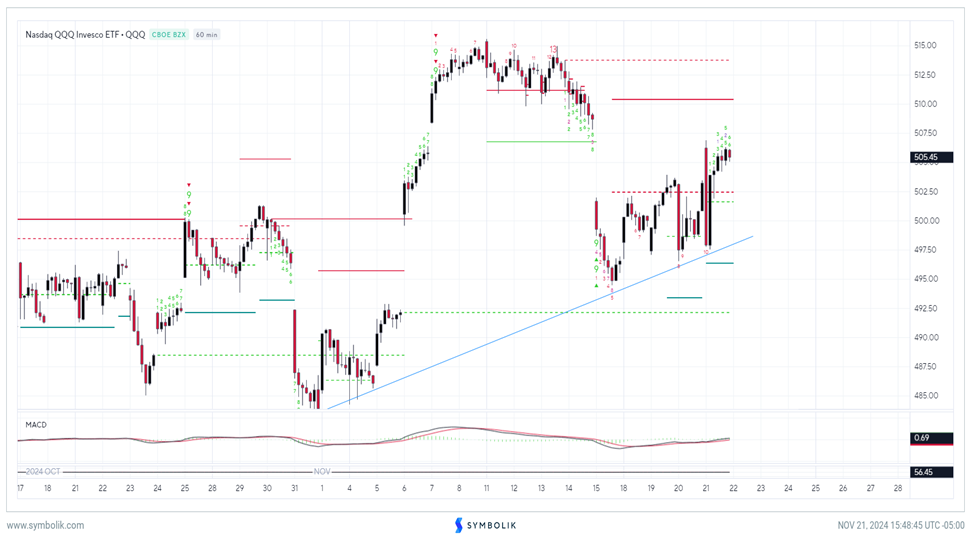
QQQ, as shown below, could likely push higher to 508-510, which looks important before stalling and turning lower. This wave pattern on the bounce remains highly corrective and choppy, not typically the kind of pattern that leads back to new highs. With regards to QQQ 2.65% , any decline back under 11/15/24 intra-day lows of 494.49 would be problematic to this structure, suggesting an imminent pullback to test late October lows near 483.75 initially. I’ll monitor the QQQ into next week.
Nasdaq QQQ Invesco ETF
Specifically, the following are problematic on a three-week basis:
Technology has remained in consolidation mode since July and has been lower over the last month. Until stocks like AAPL, MSFT begin to act better, and potentially NVDA delivers on earnings, trends for Tech remain neutral in the short run.
Market breadth remains decidedly mixed, not bullish. One would think that following the Election, a sharp rally back to new highs would have ensued. This did happen, of course, yet it was marked by far lower breadth than anticipated.
Elliott-wave structure seems to show a completed five-wave decline from November 11 on hourly charts in IWM 1.85% , DIA 0.40% , S&P Futures, and NASDAQ Composite. This should mean that a counter-trend snapback is due between now and next week’s Thanksgiving holiday. However, it also means that another “wave” down is possible from 11/27 into the first week of December.
Cycle composites for SPX show a declining trend from mid-November into mid-December before a lift into year-end. I expect this either bottoms on 12/5-6, or 12/15.
Overall, while the intermediate-term prospects for SPX and NASDAQ remain bright into next year, I don’t suspect that it will prove to be an easy final seven weeks higher for the US Equity markets. Furthermore, for those wishing to manage risk using technical analysis, the most important area on this SPX chart lies at 5853, approximating the intra-day lows from last Friday. This cannot be broken technically without expecting a move down to 5600-5650 and potentially 5500. While the intermediate-term trends remain bullish, the near-term view is choppy and would turn bearish under 5853.
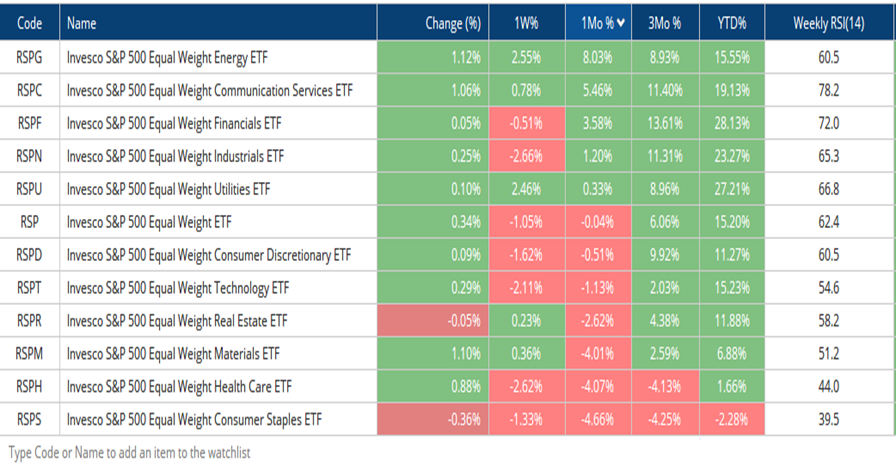
Performance seems “out of whack” lately, with the best Election year in 40+ years
As seen below, more than half of the S&P Sectors are lower over the last month with greater than average weakness out of Materials, Healthcare and Consumer Staples.
Energy has managed a decent bounce despite WTI Crude oil remaining technically bearish and not confirming the move.
The two sectors I respect the most are Financials and Industrials, and I expect these to be able to lead markets as we approach 2025.
REITS and Utilities have both stagnated lately as yields have risen, though both seem apt to rally into year-end given signs of Treasury yields starting to work lower.
Overall, while US market indices remain in good shape, this sector’s performance is atypical of a stock market poised to continue higher into year-end.
Invesco S&P 500 Equal Weight ETF
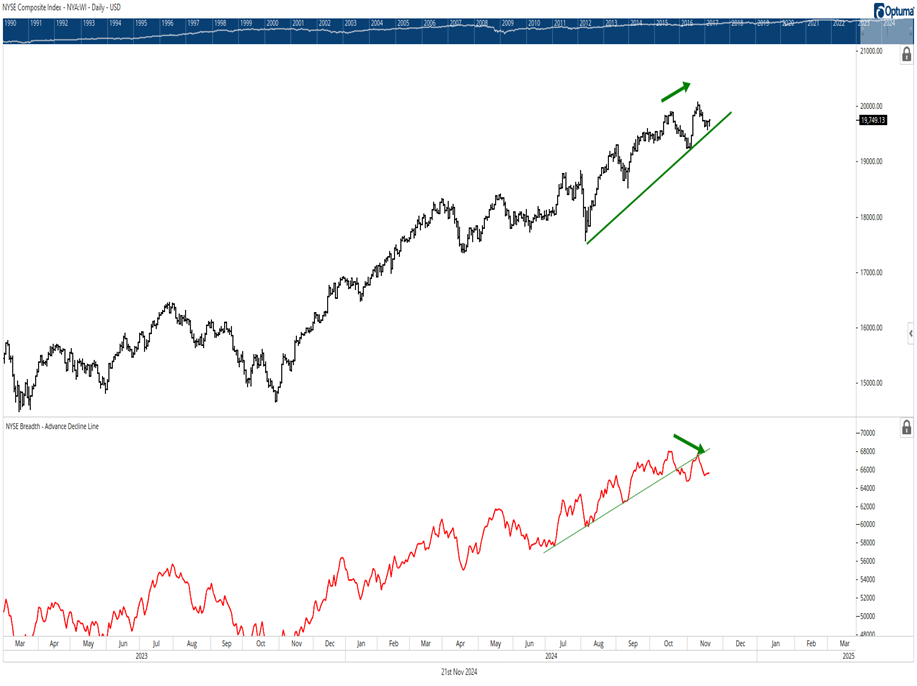
NYSE Composite Advance/Decline has not confirmed the push higher into early November
Similar to other measures of market breadth, it’s important to keep close tabs on Advance/Decline data which seems abnormally weak following the failure to confirm the NYSE Composites move back to new highs into early November.
This will need to be watched carefully and particularly on any weakness, it would be a negative to break the rising uptrend line for Advance/Decline.
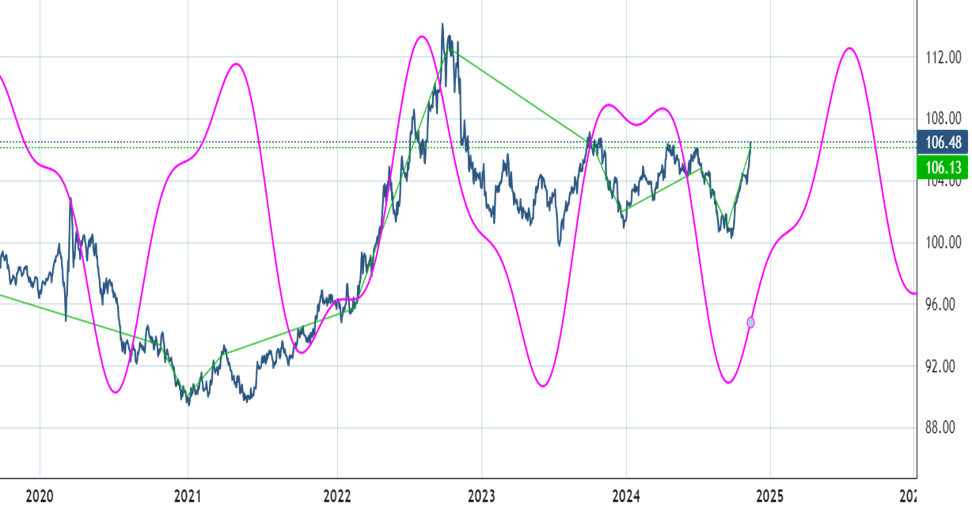
US Dollar cycle might stall briefly and turn down in December, but trends look bullish into mid-2025
Interestingly enough, while the seasonality and technical resistance would suggest a coming stalling out for DXY the US Dollar index, cycles show a sharp rally into mid-2025.
While many of the mainstream financial Media’s narratives can sometimes prove to be ill-timed when they become consensus, the story of DXY being higher as US fares better than most of the world might become a reality for 2025.
In the short run, DXY should find strong resistance near October 2023, peaking near 107.34. However, pullbacks in December might prove brief before additional upside next year.
For those looking to bet against the US Dollar and feel that Euro, Pound Sterling, or Yen might be close to bottoming, I agree technically. However, the intermediate-term view seems to argue for more US Dollar strength vs. the Majors in 2025.
US Dollar Cycle