


Earnings Recession Talk Quiet as Investors Look to 2020 1 and can accesss 1

In this strategy briefing… |
FS Insight Investment Views
|
Your Weekly Roadmap

Earnings Recession Talk Quiet as Investors Look to 2020 Profits
Have you noticed that all those loud concerns about the 2019 earnings recession have receded over past few weeks? Previously there were screaming headlines about it. Why is that? Well, with the market hitting all-time highs in July and again recently, it tends to put a damper on such worries. Investors now ignore it. Even so, many forget that the stock market is a machine that’s generally pretty good at discounting the longer-term future—if sometimes poor in the short term.
There are certainly issues that will continue to cause anxiety—U.S. China trade and the global economic slowdown remain pebbles in the market’s shoes—but earnings growth no longer seems to be one of them. With 2019 pretty near the end, investors are discounting future growth and the 2020 earnings increase for the S&P 500 index looks healthy, at double digit percentage growth.
First, let’s get 2019 out of the way. We are now nearly all the way through the third quarter reporting season, with the great majority of companies in the SPX having announced. According a recent report from FactSet, third quarter earnings reports are steadily coming in less bad than expected, at about less than negative 3%, which is better than -3.7%, -4.1% and -4.7%, respectively, over the past few weeks. The blended revenue growth rate for the S&P 500 for Q3 2019 is around 3%.
What’s important to note is the trend towards improved—less negative—earnings expectations. In general during bull markets, analysts typically would be too optimistic and have to ratchet back estimates as the year progresses. Here we find them forced to improve their numbers because they are too pessimistic. That’s likely due to the overwhelming belief among investors that this decade old bull market is on its last legs. That’s a contrarian and bullish sign.
The trend is your friend here, and analysts were doing the same in the first quarter and second quarters, both of which posted slight percentage drops compared to the
corresponding year ago periods. That’s where all the earnings recession talk originated. In this year’s fourth quarter, analysts estimate SPX EPS at about $42, up slightly from a bit over $41 in the same period of 2018. There is a chance this will turn slightly negative.
As for 2019 SPX EPS growth as a whole, it is currently estimated at about 1% or so, depending on which data provider you consult. And, as I noted above, if the fourth quarter undergoes the same trend as the previous ones, then for the year EPS growth could even be slightly negative. Analysts estimate SPX 2019 EPS at about $163, up slightly from $162 in 2018, when growth was over 20%. Remember, however, 2018 was helped by a one-time reduction in corporate earnings enacted in late 2017 by the Trump administration. The tax cuts have been lapped. The two-year average growth since 2017 is 9.5%.
So what about 2020? The bottom up consensus of industry analysts is for SPX EPS to be about $180 next year, or a 10% growth from 2019. My colleague Tom Lee has an estimate of about $184 next year.
And Tom Lee also makes a good case for U.S. growth to begin reaccelerating soon. He says three factors suggest the US Purchasing Managers Indexes are bottoming: long term yield curve (discussed previously in these pages); key groups sensitive to PMIs are rallying, and ISM New Orders/Inventory looks like it has bottomed.
In the first place, the long-term yield curve is steepening. The long-term yield curve (10-month change of UST 30-yr-10-yr yield spread) signaled 16M ago a downturn in ISM PMI was coming. Since our April 2017 study, the long-term yield curve seems to be doing a pretty good job of predicting ISM. The continued weakness in 2018-19 was predicted 16 months ago. More importantly, if the pattern holds, then the ISM should be bottoming soon with an upturn expected as we move into year end.
Second, PMI sensitive groups are rallying, such as semis (since 5/28), Germany’s DAX (8/16) and capital goods (10/21).
Third, another possible clue is the collapse in the ratio of ISM new orders/inventory. Normally, a collapse in new orders is a foreboding sign, as it points to a collapse in the business cycle. However, if businesses slowed ordering due to “trade shock,” then this is what could be behind the recent plunge. Inventories take time to rebuild.
Tom has raised his 3125 target to 3185 for the SPX yearend and the rally should continue into 2020. It doesn’t hurt, too, that the market is about to enter what is historically been the six-month period characterized by good gains. And November itself, over the past 100 years, has been kind, with an average 0.89% return and positive nearly two-thirds of the time.
The market closed this week at 3090, an all-time high and up 23% on the year. As Tom Lee wrote this week, this has been one of the strongest years for equities in the past 20 years. And if his analysis is correct (see next section), there could be further upside ahead.
Questions? Contact Vito J. Racanelli at vito.racanelli@fsinsight.com or 212 293 7137. Or go to www.fsinsight.com.

Tom Lee's Equity Strategy

A Very Strong 2019 Should Get Even Better
Here we are well into the fourth quarter of 2019, one of the strongest years for equities in the past 20 years (2013 better). In other words, this is the best year for stocks in a typical career.
As we head into year end, I’m raising my S&P year-end target to 3,185 (+60 points). This is based on $182 EPS (+$2 above consensus) and 17.5x PE (+0.4x above current). The PE works out to a 5.8 % earnings yield compared to an investment grade bond yield of 3.0%. Thus, one could even view stocks as cheap vs credit (same issuer).
In looking back at how we got to this point, the consensus focus has been on the many “tape bombs” that “threatened the cycle.” This includes Trump “ordering all companies home” to Fed stating rates were a “long way from Neutral” to the hard Brexit and inverted yield curves.
But I would argue these concerns were the wrong way to understand markets this year.
2019 is actually a “catch-up year.” Since 2017, EPS grew at 11% annually on average, but price gains were only 7%. Hence, stocks still have room to rise.
In fact, from the beginning of the year markets were signaling a strong year was ahead.
How? Well, my evidence-based framework told me at the start of 2019, that 2009 was the best analog for 2019. While it seemed crazy at the time, the trifecta (of 9 factors) was (i) a waterfall decline in stocks; (ii) HY signal based on poor performance in the prior year and (iii) the Fed’s dovish turn. These things only happened together in 2009 and thus, I saw 2019 as a 25% gain kind of year.

But wait, there’s more!
ISM exports also ticked above 50 in October, after two months of “recession-like” readings of 43.3 and 41.0 (Aug/Sep). Since 1993, inflections in ISM exports have led to 545 basis points of acceleration in EPS growth YoY. This is logical because it signals a revival of growth (in this case, industrial cycle). Hence, we think consensus 2020 EPS of $180 will be revised upwards. We are $2 above consensus.
And finally, we are in the final 8 weeks of 2019, which is roughly the start of the Santa Claus rally. This effect is very strong in the last 20 years. Since 1998, when the S&P 500 is up at least 9.5% from Jan 1 through Nov 7, the average gain through year-end is 4% (n=10). 10 of 10 times (100%), S&P rose in the final 8 weeks. Based on this math, the implied S&P 500 finish is 3,212.

What could go wrong? The biggest risk, in my view, remains an external shock. The obvious risk remains trade war escalation as well as Brexit. But the offset remains positioning is so conservative, that a crisis is more “priced in” than “industrial cycle bottoming.”
Bottom line: We think history shows that investors should be risk-on into year-end. We believe S&P 500 has 100-120 points upside into year-end. Some of this may be borrowing from 1Q2020 given the expansion of valuation. We continue to use same cyclical list for YE rally. The tickets are: TPR, KSS, LEN, PHM, EXPE, LMT, CAT, CMI, EMR, ROK, IBM, INTC, MXIM, QCOM, QRVO, PLD, CBRE, CCI, IRM, SBAC, CTL, DISCK, T, ATVI and VIAB.


Fed Watch
Fed gives itself a pat on the back
As discussed last week, the FOMC reduced the Fed funds rate by 25 basis points to 1.50%-1.75%. Since then it seems that Fed officials have been messaging to the market that they have the economy exactly where they want it. A pat on the back perhaps?
I had previously pointed out that the Fed was prepared to cut rates not just in reaction to economic difficulties, but in anticipation of them as well (a questionable mandate, in my view, given economists’ dubious record of predicting, well, anything). Recent comments by Fed officials indicates that the mandate for now has returned to “accommodative.” Also, 4Q19 has been very good for markets (+3.6% QTD) so far and Fed officials want us to know we have them to thank for it. Let’s review…
New York Fed President John Williams (per the WSJ): “The three rate cuts we did were very effective at managing the risks’ slowing global growth and trade uncertainty present to the U.S. economy…Where we go from here will depend on the information we receive, what we’ve learned about the economic outlook.”
Translation: We give ourselves an A+ in 2019 thus far.
Chicago Fed President Charles Evans (per the WSJ): “’The economy is in a good place, and we made good adjustments to the stance of monetary policy,’ and all of those easings ‘put us in a good place’ for the time being, Mr. Evans said.”
Translation: We did a great job. All good for now.
From the Fed’s perspective, they’ve done all they can to support the US economy during this past year. To be fair, with US-China trade war tensions in a deflationary state, and significant inflation nowhere to be seen, it does appear that the economic ship that is the United States economy has been righted heading into year end.
Perhaps 2019 could be their great redemption following the disastrous rate hike in December of last year.
The U.S. Treasury 10-yr note yield was around 1.93% up from 1.71% one week ago.
Upcoming: 12/10-11 – FOMC meeting. Don’t expect much.
GRANNY SHOTS: Best bets in 2019

GRANNY SHOTS: Best bets in 2019 - Week 45
Below we’ve highlighted stocks that we recommend across at least two of our investment strategies for 2019. These companies could benefit from multiple themes and secular tailwinds – clear picks in our view for the first half of the year.
Figure: Granny Shots are the “best of the best”
Stocks which appear in multiple themes. Source: FS Insight
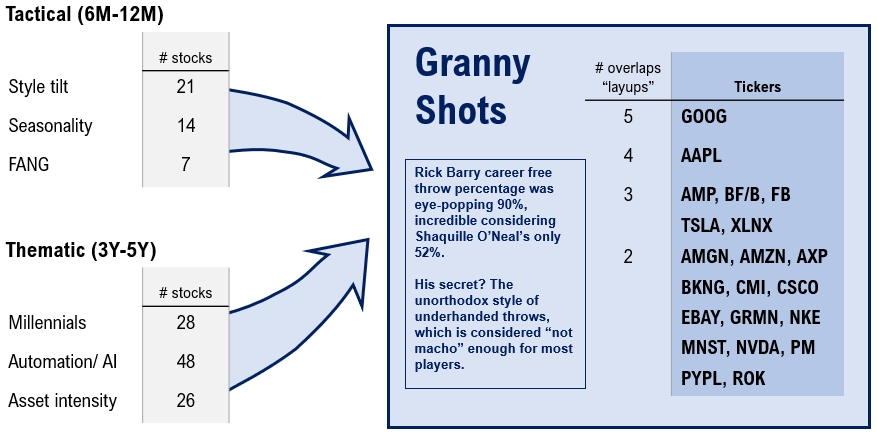
Figure: Granny Shots Portfolio Performance
Monthly. Source: FS Insight. FactSet as of 11/7/19.
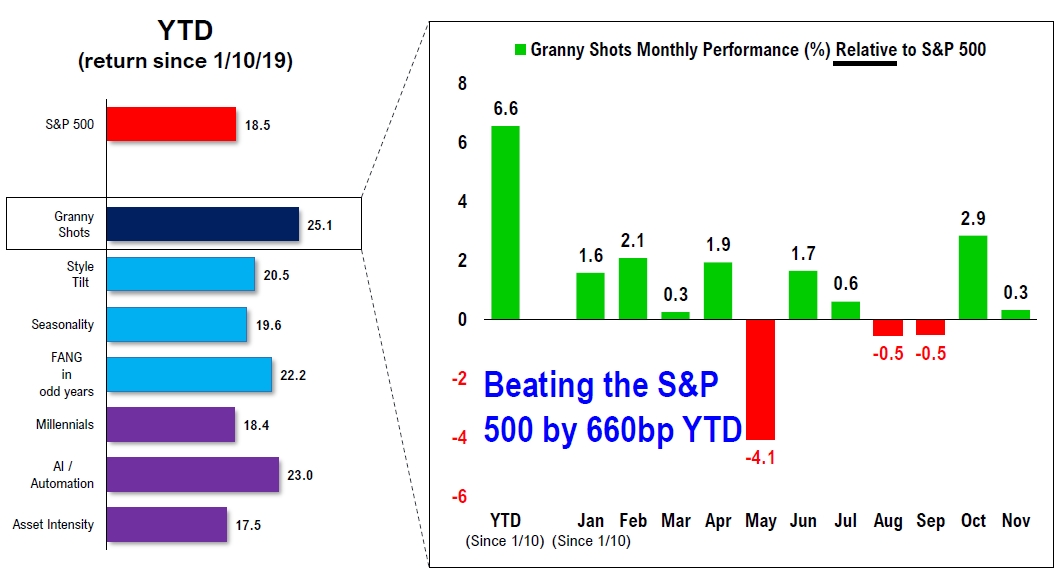
Figure: Intersection of investment recommendations by strategy
As of 11/7/19, source: FS Insight, FactSet
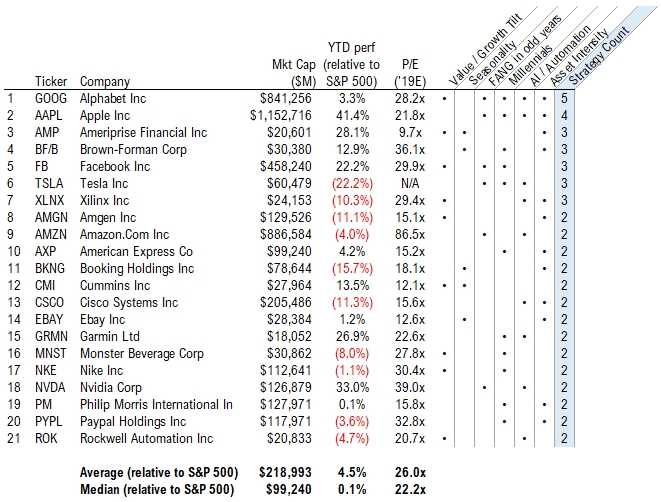
The stocks in the Granny Shots portfolio collectively outperformed the S&P 500 by 660 bps since its inception (S&P 500 is up 23% YTD).
Technical Strategy

Cyclical rotation in-tact heading into final weeks of 2019
The long-term equity cycle backdrop continues to improve as major US equity indices extend their October rallies to all time highs. Within equity markets cyclicals, notably financials and industrials, have broadly reaccelerated with their relative performance trends versus the S&P 500 finally reversing 2-year downtrends. This action continues to confirm the bullish view I have outlined here through the summer and fall.
This week saw a number of key technical hurdles breached. Financials and industrials continued to outperform, making increased relative performance highs that are now above their 200-day moving averages. In contrast, as noted below in the sector section, utilities and staples are beginning to break down right on track.
In addition, as I’m writing this note on Thursday afternoon, the largest bond ETF, the TLT (135.48), has just moved to a new low, gapping below the key 136 support level I focused on in our October 24th note. The TLT’s 2019 uptrend is now broken and serves as one more technical data point confirming a rotation away from safety toward riskon assets.

One near-term risk I see is a temporary pause/pullback taking hold shortly given almost all risk assets are overbought short-term. As an example, the Russell 2000 Small-cap index is showing early signs of stalling at resistance at the upper end of its MarchOctober trading range. I expect pullbacks to be short lived, so don’t get shaken out of long positions attempting to micro-manage selling only to have to buy back. This market cycle appears to have legs to run for many quarters. We suggest to stay long and strong using pullbacks to increase exposure.
So what is there to buy other than the cyclicals we’ve been recommending here for months? Well, Chinese growth stocks, such as Netease (NTES), Alibaba (BABA) and
Tencent (700 in HK) are showing a classic progression of a major cycle lows developing following 12-18 month bear markets.
Leading the rally is NTES pushing above its summer highs, with BABA close behind as both begin to reverse their 2019 downtrends. Tencent is particularly interesting this week as it begins to bottom almost exactly at its rising long-term uptrend defined by its rising 200-week sma.
Bottom line: My outlook remains unchanged – expect further upside in equities well into Q1 driven by broadening participation across cyclicals with the off-side positioning by most money managers being overweight safety stocks and underweight cyclicals, as fuel for further rotation


US Policy

2020 Budget, Impeachment, and US-China Trade Talks Take Center Stage
2020 Budget
While impeachment is the daily story that dominates each news cycle, the big story could be a potential government shutdown on November 21. The Congress and the White House agreed to pass a Continuing Resolution, (CR) to avoid a shutdown on October 1 when the new fiscal year began, but that CR expires on November 21.
The House, Senate and White House are having discussions about the pending budget deadline, and to date the reports have been positive; but the President has made clear he can’t except any bill that limits his ability to continue construction of the border wall. It was wall funding that caused last year’s 35 day shutdown; and with impeachment and elections facing the President a shutdown might be a handy diversion.
Impeachment
Washington and the markets seem to have accepted the fact that every day the lead story will be about impeachment, and next week the public hearings begin. On Wednesday, November 13 the US Ambassador to Ukraine, Bill Taylor, will be the leadoff witness, followed by the Trump fired Ambassador Marie Yovanocitch on Friday.
They will layout the basic Trump strategy of working to get an investigation of the Bidens and the link to military aid from the US to Ukraine. As this begins the pubic hearings it will be interesting to see how the Republican members of the committee defend the President. It could be a foreshadowing of the strategy the Republicans will use as the process continues.
China Trade
There continue to be widespread reports that the US and China are close to finalizing the Phase One deal announced in October by President Trump. Initially President Trump and Xi were going to formalize the deal next weekend at the APEC meeting in Santiago, Chile but with the civil disorder in Chile the meeting was cancelled. Officials in DC and Beijing are looking for a new signing opportunity.
Acknowledging the importance of the increased Chinese agricultural purchases for the Trump re-election strategy, the President suggested Iowa as a place to sign the agreement. The Chinese are not likely to give the President such a domestic political win, but at some point the two leaders will officially sign an agreement and may delegate the signing to the two senior trade ministers.
The basic framework is likely to be an increase in US agricultural imports by China, the granting of some waivers to US companies to sell products to Huawei, and still to be resolved the future of tariffs. It is widely expected that the scheduled December 15 tariffs by the US on Chinese consumer goods will be suspended, but whether or not any tariff rollback will be included is still being discussed.


