Near-term trends were broken for roughly one hour on Friday before being recouped on Monday’s opening gap higher, and the resulting recovery in US Equities makes it difficult to expect last week’s downward volatility to continue this week. While volume expanded sharply across many Equities and Equity indices on last Friday’s unexpected plunge, the snapback rally fits with both Elliott-wave structure as well as DeMark indicators towards expecting strength back to new all-time highs. While the 5% decline looks to have been postponed for now, I do believe that cross-asset volatility is on the rise, and it looks difficult to think a selloff has been avoided between now and mid-November. Overall, this likely creates a very fast-paced trading environment between now and mid-November, which might prove ultimately unfulfilling for Bulls and Bears alike. Gains back to new highs would likely represent opportunities to pare back risk, and it’s essential to see market breadth start to repair some of the deterioration that began a few months ago. Near-term, I view Financials earnings this week as potentially serving to help the Equity market in its recovery process. However, I think that it’s looking increasingly like a Stock market that demands more and more selectivity.
I’ll attempt to clarify my comments from last Friday, as I stated both that price had reached short-term support, but also that a break of ^SPX 6569 might prove problematic.
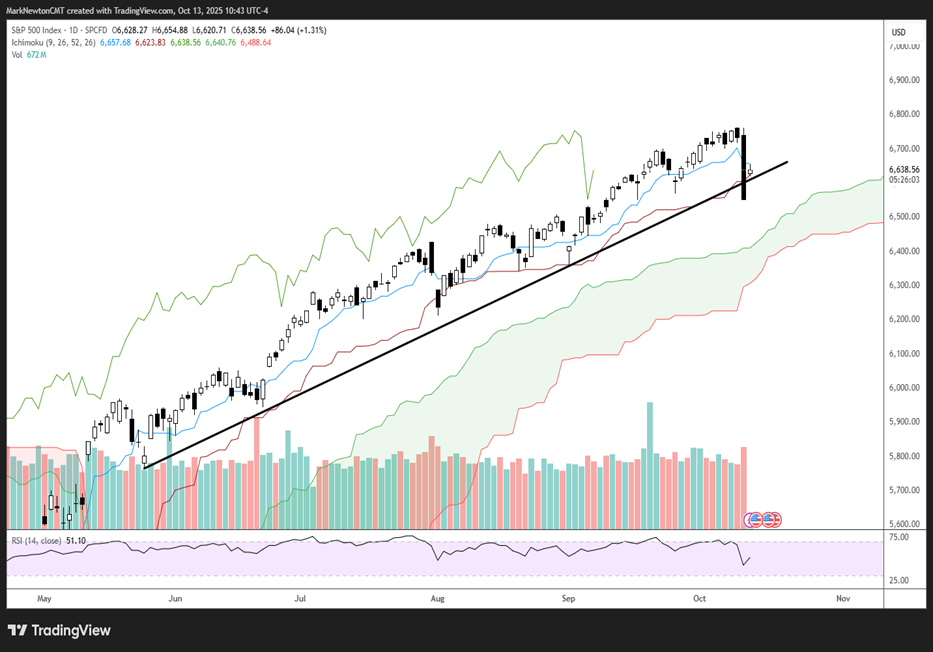
In the short run, the rebound favors market bulls, and I suspect that a rally back to new highs is probable. However, similar to last week’s thoughts, I expect that upside might prove limited over the next month, and it’s essential for the broader market to begin to show more compelling strength than it has since July.
Technology continues to show extraordinary strength as each day seemingly brings about yet another interesting AI deal. Yet, the rise in positioning in sentiment over the last month is also noteworthy, and US Equity cycles continue to have a downward bias over the next month, ahead of a rise back to near 7000, possibly into year-end.
I sense that US Equity markets could have an upward bias over the next couple of weeks. However, given the bullish move in VIX last week and high downside volume seen in quite a few Tech stocks, I suspect that an uninterrupted rally between now and Year-end is probably unlikely.
For now, support lies between 6600-6610 for ^SPX, and I’m skeptical that 6550 is broken right away. On the upside, if my thinking is correct, a rally back to 6700 and eventually to break back above 6764 to reach 6800 should be likely. Financial earnings might serve as the catalyst for such a rally this week.
S&P 500 Index
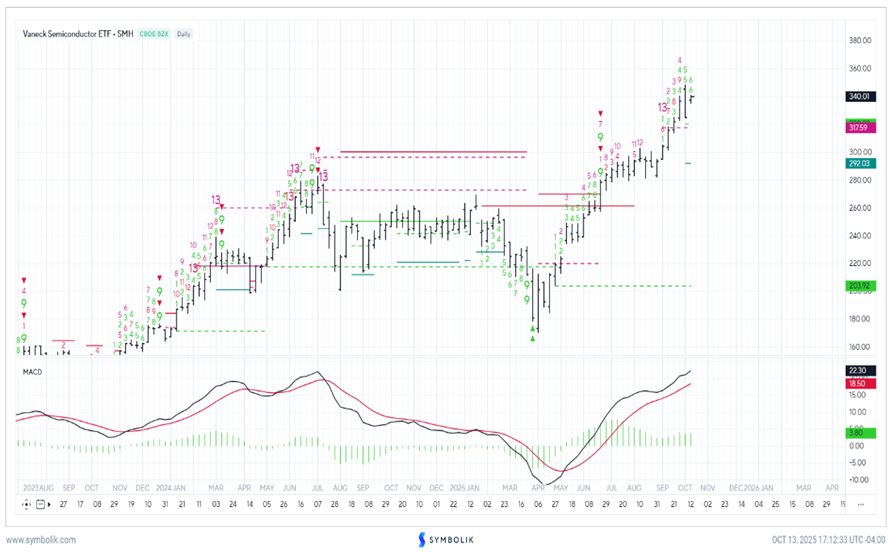
SMH looks to push up to $360 as OpenAI inks another deal with AVGO
Monday’s deal continues the trend of massive amounts of money being spent on AI across the Chip sector.
AVGO -1.43% ’s 9.88% gains on Monday helped the Philadelphia Semiconductor sector log gains of nearly 5%, helping SOX to regain much of last Friday’s damage.
Technically speaking, the pace of these deals being announced on a technology that has largely been unproven is staggering. However, Semiconductor stocks have continued their upward ascent, and SMH -0.75% looks likely to push up to $360 over the next 2-3 weeks.
As shown below, weekly trends remain bullish, despite last week’s loss. DeMark signals have not been confirmed, and might generate another weekly signal within three weeks on further strength, which could be more important in resulting in a stalling out of this parabolic trend.
At present, it’s difficult to get too bearish on Semiconductors without much proof of trend erosion, and I anticipate SMH -0.75% pushing back higher above last week’s highs in the next week.
Until DeMark’s exhaustion signals can be confirmed and/or lead to another TD Sell Setup similar to what occurred last Summer, it remains difficult to have much concern about this trend giving way just yet (despite SOX, SMH -0.75% being quite overbought).
Vaneck Semiconductor ETF – SMH
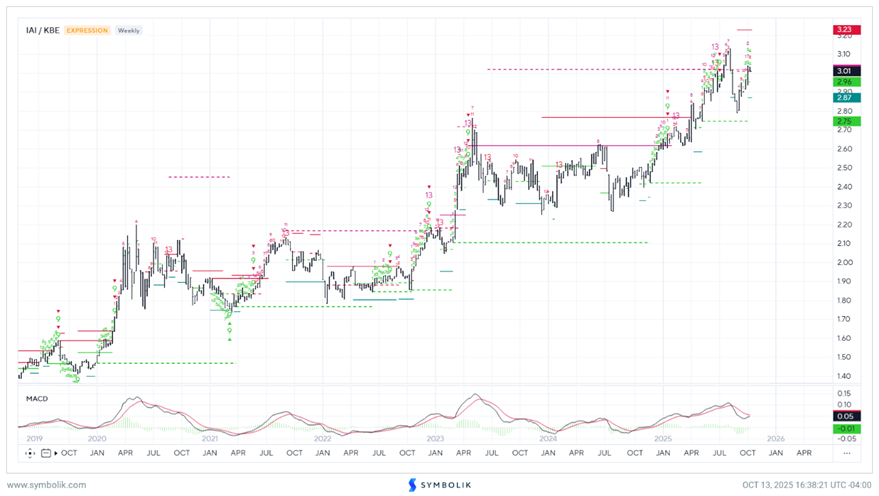
Broker Dealer stocks look more technically appealing than Banks as a way to play Financials
As might be expected in this rally, the iShares Broker-Dealer Securities Exchanges ETF (IAI 0.95% ) has outperformed the SPDR S&P Bank ETF (KBE 1.32% ) in recent months.
Normally, during times of “risk-on” movement within markets, IAI 0.95% tends to perform better than the Commercial banks. This year has been no different, and ratio charts show the relative IAI/KBE pair still trending up strongly over the last few years.
The last few weeks have also seen IAI 0.95% begin to show better relative strength, and given last Friday’s above-average “down day” for KBE 1.32% on heavy volume, I expect that IAI 0.95% makes more sense for Financials between now and year-end. Specifically, on an absolute basis, a rally over $179 would help IAI 0.95% to break its own neutral sideways trend and push higher.
While many are wondering about the favored ETFs for relative strength within the Financials, I would weigh in that IAI 0.95% still seems much more appealing than KBE 1.32% and could outperform initially through the balance of October.
IAI/KBE
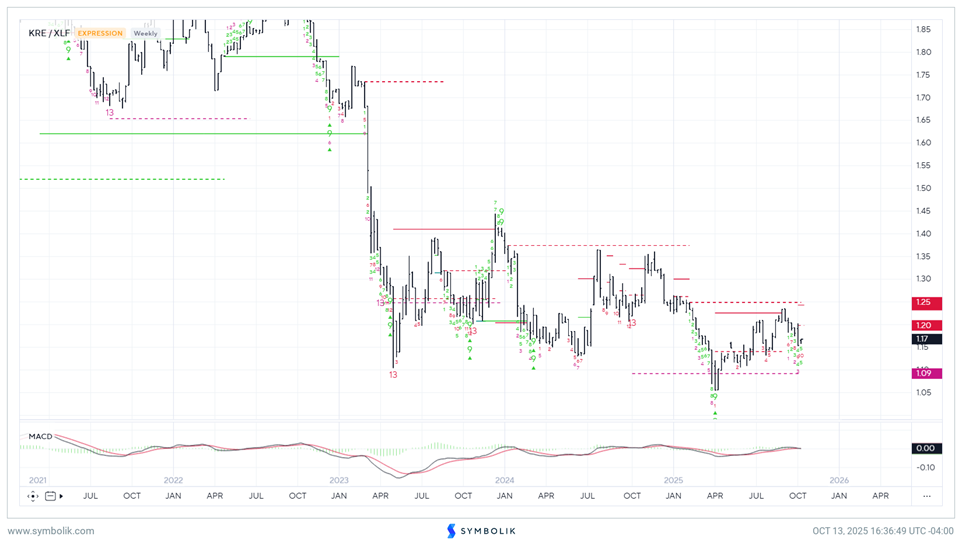
Regional Banks still largely quite mixed vs. XLF, so owning both would be preferred over just favoring KRE
While the Small-cap rally seems to have kicked in over the last couple of months, it’s difficult yet to overweight Small-cap Financials vs. the broader XLF 0.80% , the SPDR Select S&P Financials ETF.
As this ratio chart shows below, KRE 1.45% has largely moved sideways vs. XLF 0.80% , following the sharp period of underperformance during 2022 into 2023.
Until KRE 1.45% can begin to show more strength, I don’t expect that KRE 1.45% can immediately outperform XLF 0.80% . On an absolute basis, the ability to recoup $65 would be positive for KRE 1.45% to begin a move back to challenge last year’s highs near $70. However, in the short run, the near-term trend favors a choppy pattern between the two ETFs, with no clear-cut favorite.
KRE/XLF