
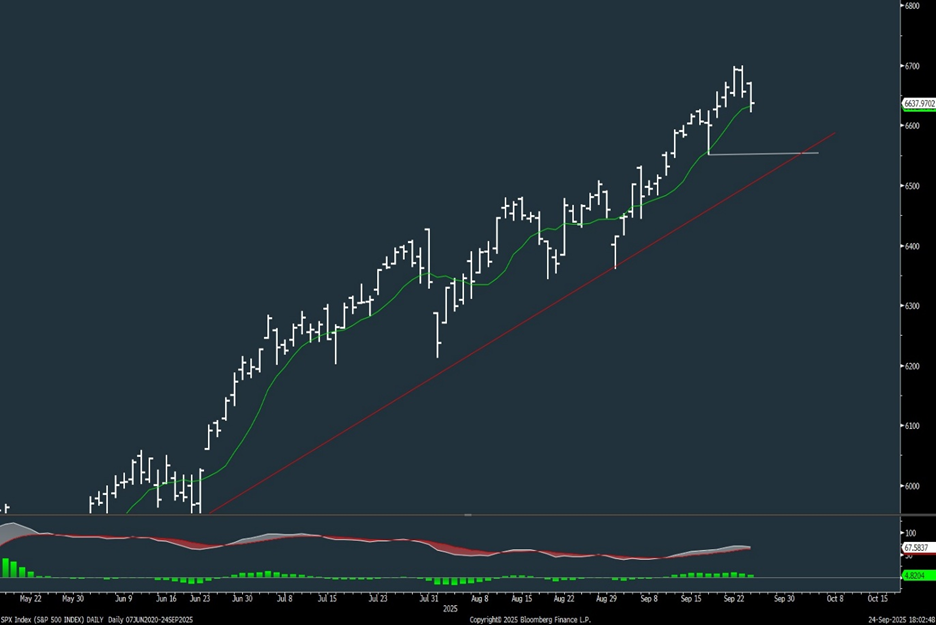
Near-term and intermediate-term technical trends remain bullish for US Equities, but Tuesday’s setback might have kicked off the start of a minor pullback in Stock indices, lining up with a traditional “Sell Rosh Hashanah, Buy Yom Kippur” theme, which could allow for continued weakness into next week before US Equity markets stabilize and begin to turn higher. As detailed in recent days, there’s been some massive divergence between Technology and the broader market of late. Furthermore, short-term overbought conditions are present along with some DeMark-related exhaustion signals, which might result in some short-term consolidation for US indices. Both DXY and Treasury yields should be in the process of rolling over following minor bounces this past week. Finally, the rally in precious and industrial metals has continued, and it still seems early to avoid this area, despite how overbought momentum has become lately.
Technically, the pullback that began Tuesday shouldn’t have much downside before turning back higher to challenge all-time highs. I had expected 3-5 days of possible weakness, but I don’t feel that ^SPX gets under 6551 (September 17th lows), making the downside quite limited.
^SPX broke its rising 5-day moving average (m.a.) but failed to undercut the 9-day as of now. Support levels given for both ^SPX and QQQ 0.05% have not yet been violated, and these remain important for the days ahead. Overall, I’m not expecting much weakness in September, so whether or not ^SPX extends down much further into Yom Kippur won’t make too much difference, technically. In the bigger picture, downside looks limited and should be followed by a push back to new highs.
Levels for the next couple of weeks are as follows:
SPX – Support- 6625, then 6600, 6551; Resistance- 6699, then 6726
QQQ – Support- 593, then 583; Resistance: 601, 615
SPX Index
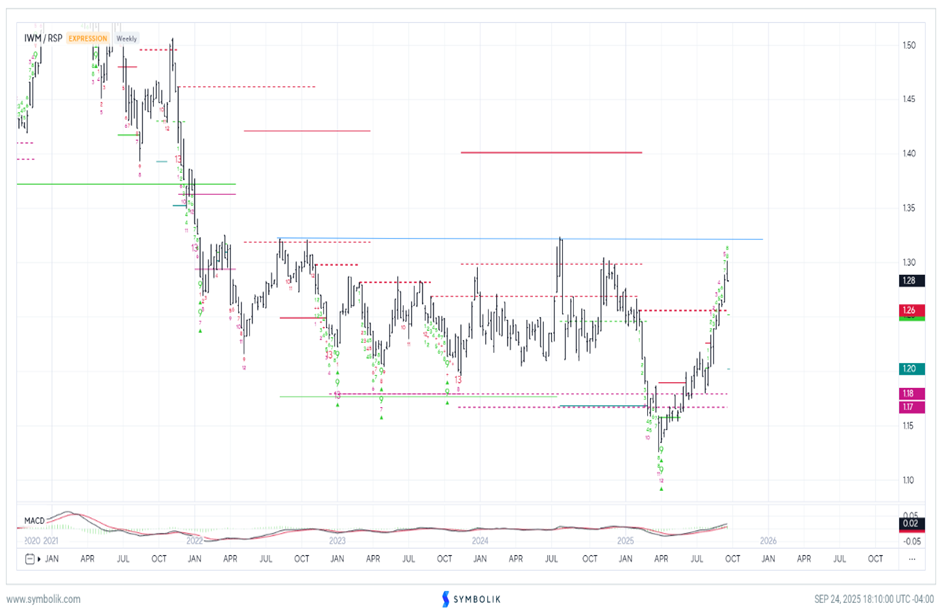
IWM 1.40% relative chart could show some slowdown vs. the Equal-weighted SPX following the recent runup
While the breakout in IWM 1.40% last week was certainly a technical positive in my view, the relative chart of IWM 1.40% vs. Equal-weighted ^SPX seems to suggest a coming period of stalling out.
As shown below, this ratio chart of IWM 1.40% to RSP 0.67% has reached the highs of the last few years, which normally can result in relative resistance.
Furthermore, TD Sell Setups on this ratio are within a week of possibly completing the “9 count”.
In plain English, while the absolute IWM 1.40% chart remains quite bullish, I suspect that we might be nearing a time when the Equal-weighted SPX starts to play catch-up and outperforms Small-caps for a period of time.
Overall, IWM 1.40% remains bullish technically on an absolute basis, and any absolute or relative weakness should make this even more appealing between now and Year-end. However, it’s thought that this rally from April is simply nearing some temporary relative resistance.
Bottom line, this speaks more to the possibility, in my mind, of a coming period of catchup to the broader market, not necessarily a time to avoid IWM.
IWM/RSP
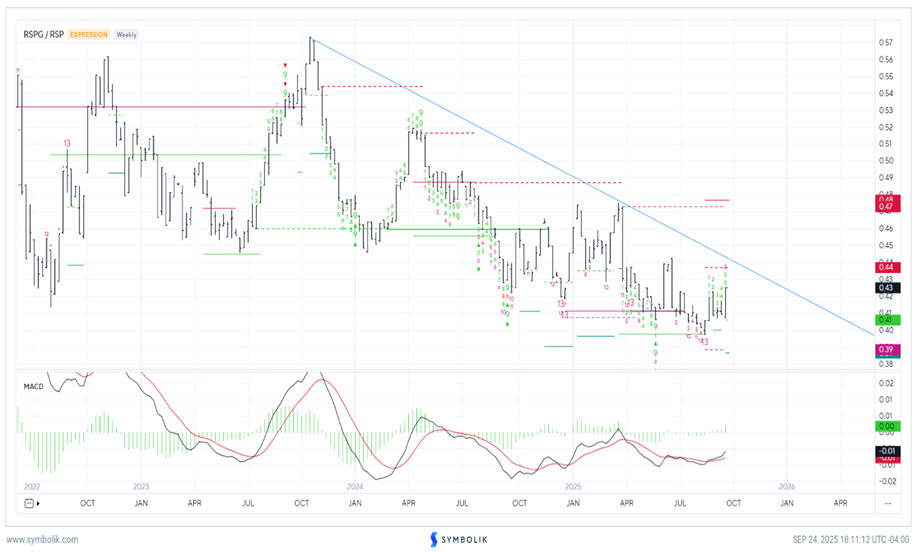
Energy is making a push to new multi-week highs in relative terms, which might allow for near-term outperformance
Despite the ongoing downtrend in Equal-weighted Energy relative to Equal-weighted ^SPX, this week’s move is important and bullish for Energy with two days left in the week.
Moving to new multi-week highs might allow for some temporary outperformance in Energy in the next month before this starts to fade.
Historically, Energy has a very weak seasonal pattern during the back half of most years, and I still expect that Crude likely will turn lower to the low $50’s in the months to come.
However, for the purposes of weighting Energy, it does appear like some temporary outperformance might happen between now and mid-October before this starts to fade and drop back lower.
RSPG/RSP
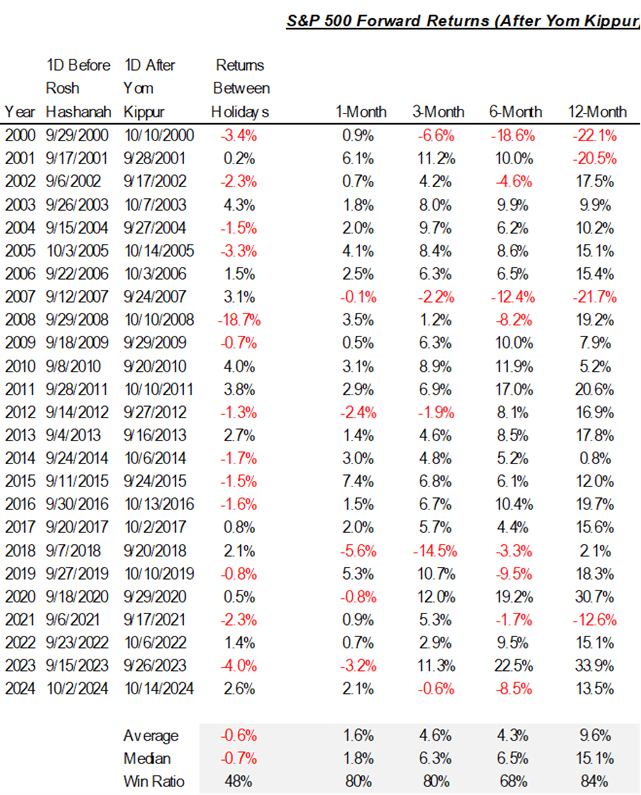
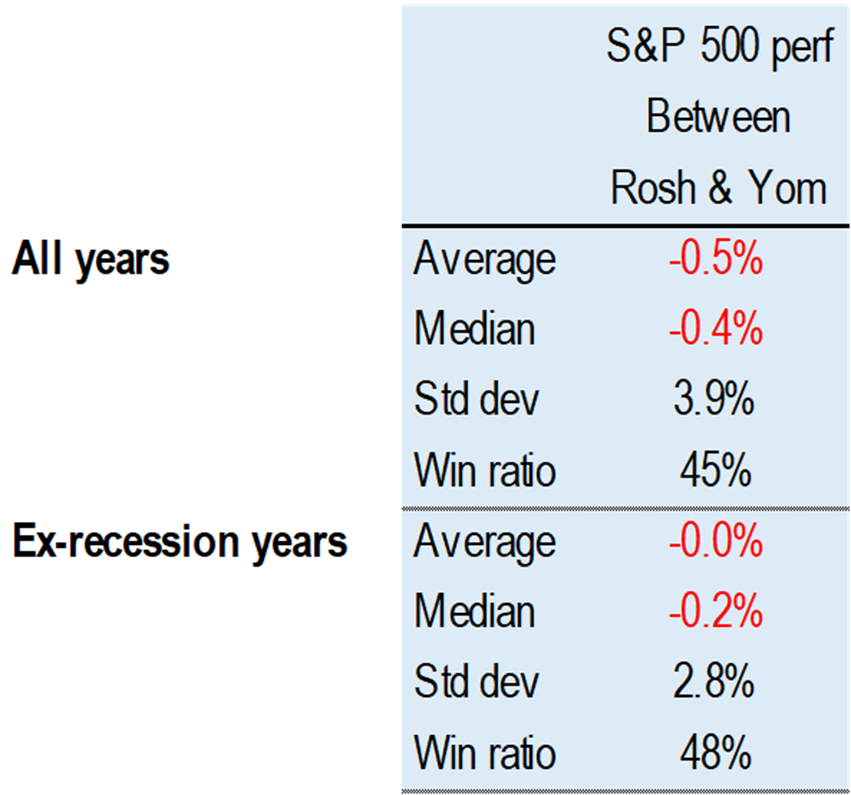
Median return from Rosh Hashanah to Yom Kippur holiday has been negative since 1928
The sudden about-face right at the beginning of the Autumn Equinox period isn’t particularly surprising from a seasonal perspective in my view and also lined up right with the start of Rosh Hashanah.
This table, going back since 1928, does show a minor negative bias during this period. However, I am suspecting that weakness proves short-lived before ^SPX starts to push back to highs starting next week.
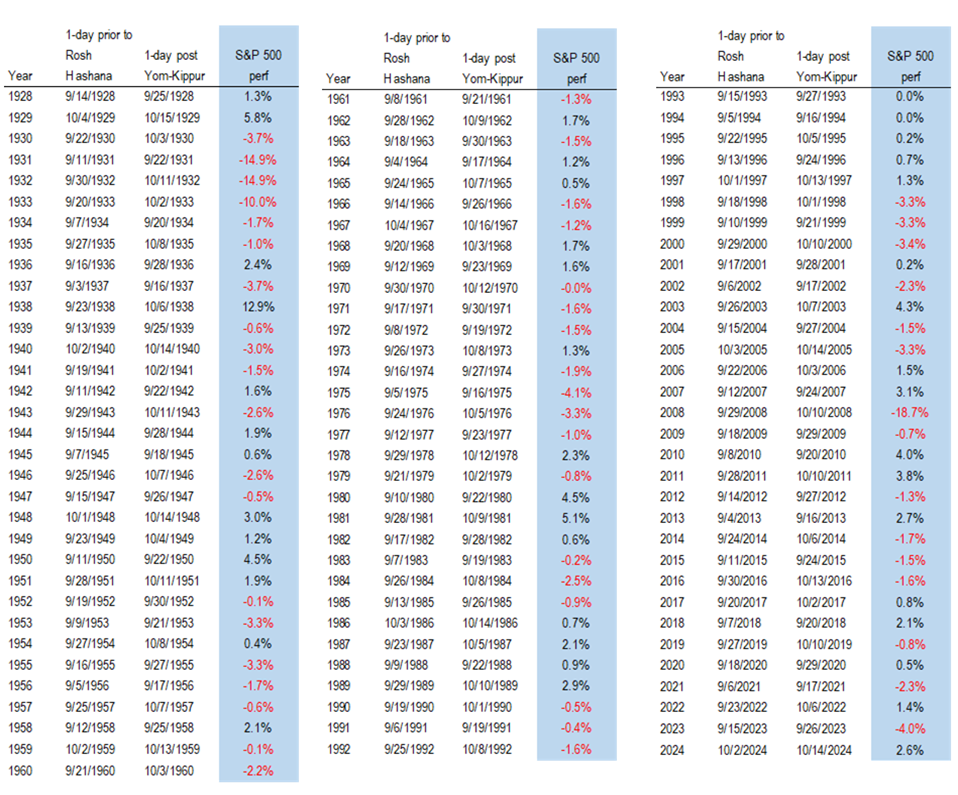
Performance between Rosh Hashanah to Yom Kippur holidays has been negative since 1928
As shown below, the median return during this period tends to be better in non-recession years.
Thus, I’m not expecting much further weakness this month, and ^SPX should remain above mid-September lows.
Returns following Yom Kippur can normally be quite good
The data since 2000 shows a more negative return from Rosh Hashanah to Yom Kippur than was seen from 1928 but also shows a very positive period thereafter.
The forward returns below are shown on a 1-month, 3-month, 6-month, and 12-month basis.