Short-term US Equity trends are bullish and likely begin to accelerate higher into mid-October before finding much resistance. Despite the bearish seasonality trends, it’s hard to be too negative on recent price action, which combined with rising momentum and above-average bullish breadth, necessitates a bullish stance into October. Triangle patterns have been exceeded to the upside for SPX, DJIA and NASDAQ, and are forthcoming for Russell 2000 index. Following the Fed’s first interest rate cut in over four years, precious metals look to be showing parabolic strength while both the US Dollar and US Treasury yields start to stabilize. Overall, without evidence of any serious technical damage, it’s difficult turning too negative on US equity markets.
Fractional gains occurred to kick off the last full week of September, and it was noticeable that Equities continue to prove resilient during this time of normal seasonal weakness for the US Equity market during Election years.
The prior positive correlation between S&P 500 and Treasuries continues to be unwound, and it’s thought that minor push higher in ^TNX does not have to be necessarily bearish for ^SPX.
Last week’s rally back to new all-time highs for SPX to join the DJIA looks constructive, and despite NASDAQ having not yet completed this move, it’s expected that NASDAQ 100 and Composite likely both could challenge July peaks into mid-October.
As discussed last week, the combination of bullish technical structure, less than ebullient market sentiment coupled with constructive market breadth, and a healthy rebound in Technology likely could help US Equities push higher despite the bearish seasonality trends.
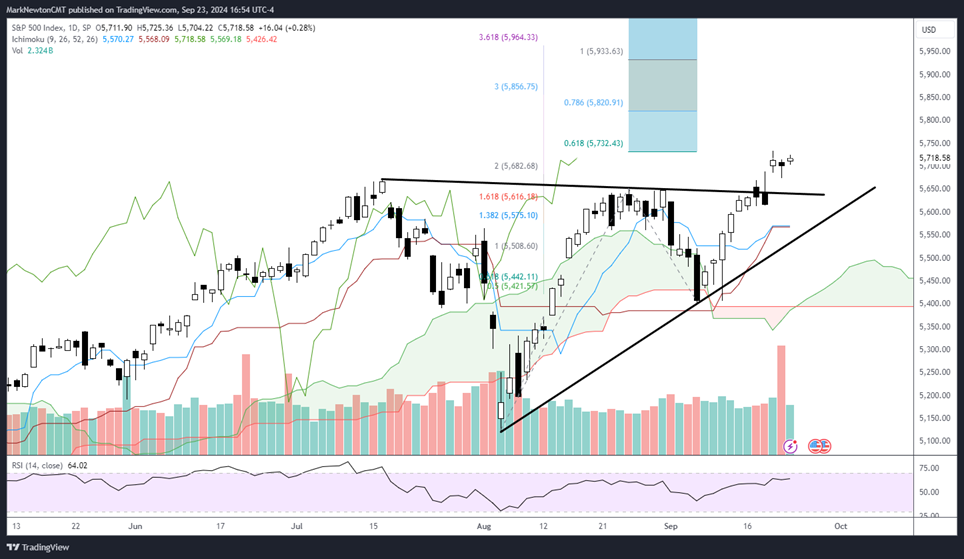
As seen in SPX below, last Thursday’s breakout to new highs has shown some mild “sideways action” since that time. This is not thought to be bearish. Movement back over SPX-5733 likely could take SPX higher to near 5933 before finding much resistance. (At that price, the rally from early September would equal the rally from early August in “price points gained”).
As discussed last week, the NASDAQ 100 index would have a target in this instance near $21k.
Overall, until some evidence of price deterioration begins, it’s thought that last week’s rally helped the market “show its hand” and is considered bullish, technically speaking. Daily SPX charts showing last week’s triangle breakout are shown below.
S&P 500 Index
Equal-weighted S&P very well could break out again vs. SPX following recent range
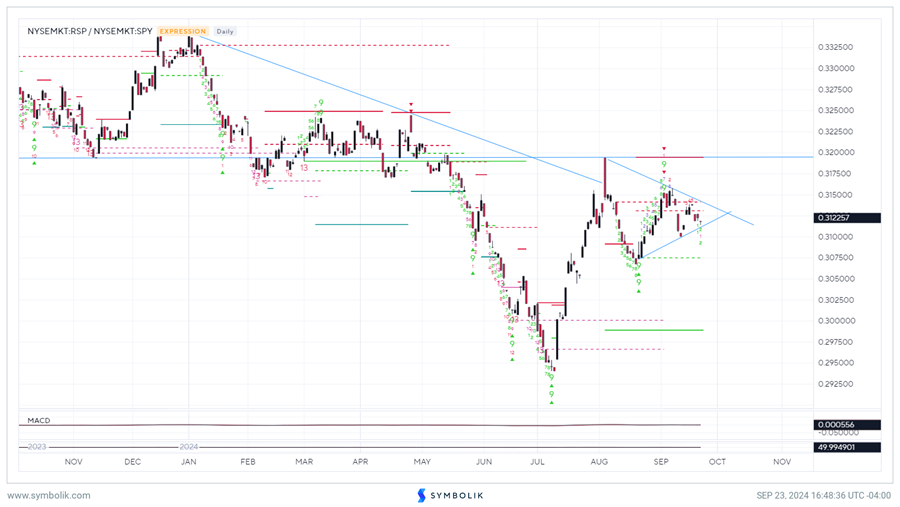
This relative chart of Invesco’s Equal-weighted S&P 500 ETF (RSP 0.59% ) vs. SPY 0.35% shows a very strong broad-based move having taken place in RSP vs. SPY from July into early August ahead of some range-bound consolidation in the last month.
While the trend in this ratio chart since early July favors RSP, the last month has proven sideways, as Technology rebounded, but Financials and Industrials along with Healthcare managed to do well.
Overall, this triangle pattern resolution would likely give a clear pattern as to whether another period of outperformance is starting for the Equal-weighted S&P 500, or whether Large-cap Technology strengthens enough to favor SPY 0.35% outperformance.
The pattern seems to suggest that RSP likely could break out again in the coming week which would favor a broad-based rally into mid-October. Note, this wouldn’t necessarily suggest that Technology would decline on an absolute basis. Rather, it’s thought that Industrials, Financials, and Healthcare might simply outperform Technology in this case.
I expect this triangle to be resolved in the coming weeks and will discuss on Flash Insights when this occurs.
NYSEMKT:RSP/NYSEMKT:SPY
China’s US Equity ETF’s: FXI and KWEB have both started to accelerate higher
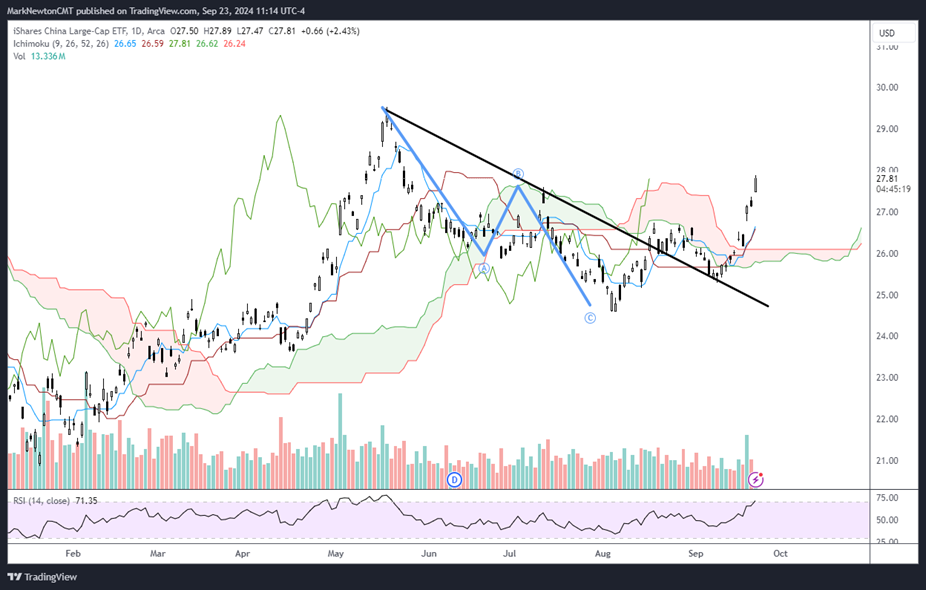
China finally looks technically attractive again on a short-term basis following strength over the last few weeks. FXI 1.02% (Ishares China Large-cap ETF) advanced to the highest levels since late May on Monday.
The People’s Bank of China (PBOC) reduced their 14-day reverse repo rate over the weekend which was thought to be a possible catalyst for this week’s surge. They also set the “fixing” of Dollar/Yuan higher than the prevailing level, indicating that PBOC likely does not want to see the Renminbi reach the 7.0 line too quickly.
The fact this happened directly ahead of the October week-long holiday is probably not a coincidence in my view, as Chinese authorities are trying to do whatever they can to try to drum up financial support for economic development and maintain an upbeat mood.
Overall, this bounce in FXI has been a work in progress in recent months, but the strength over August highs at $26.74 is very positive technically. This helps to kick off another wave higher and has certainly caused this decline from May to resemble a three-wave decline.
Thus, it’s certainly possible that FXI can push back up above May highs in my view. However, this will certainly take some time. Prior highs at $29.50 are the first major target, and any minor dips in the week ahead likely could find strong support near $27. However, given the big boost of volume in recent days on FXI gains, there stands a chance that this acceleration continues until 10/1 without much resistance. This is the date when China’s National Day holiday begins, lasting until 10/7.
Outside owning FXI and/or KWEB for exposure to this China bounce, some of my favorite technical patterns right now of Chinese stocks which trade actively in US are:
BABA 0.91% , TCEHY, JD 0.63% , TCOM 1.38% , BACHY, and XIACY.
iShares China Large-Cap ETF
Copper has begun to turn higher coinciding with China’s US Equity ETF strength
Interestingly enough, Copper has also begun to show signs of a possible serious move higher in prices over the next month which might correlate with China’s Equities pushing higher.
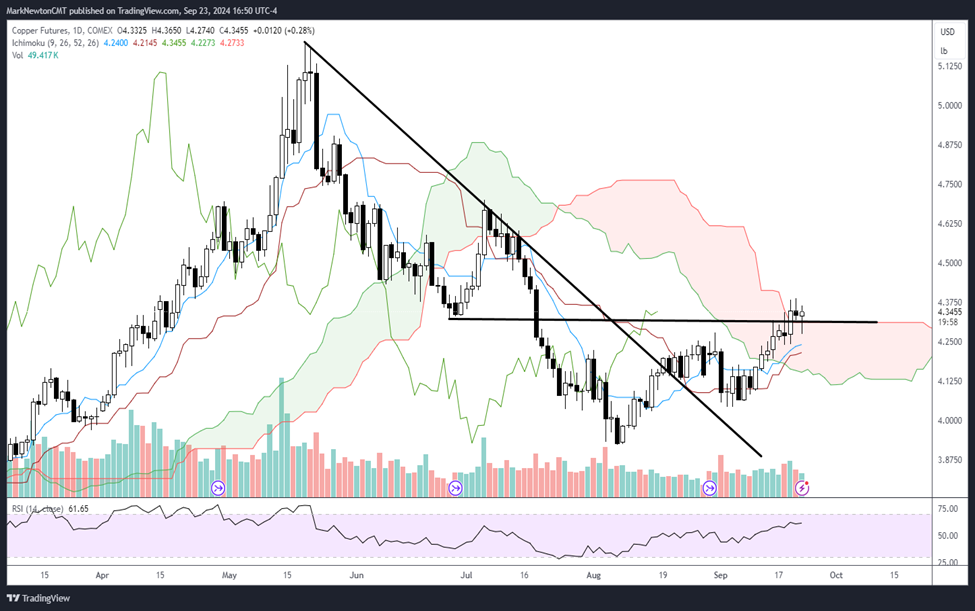
Price on Copper futures recently exceeded the prior lows from late June which solidify this downtrend as a three-wave decline. Moreover, similar to FXI, price of Copper futures has also just exceeded the peaks from late August.
This looks to be a bullish development for Copper and both COPX 2.36% (Global X Copper Miners ETF) and FCX 1.80% (Freeport McMoran) look likely to push higher in response between now and mid-October.
If the price follows the trajectory of the Cycle composite for Copper which I shared last month, rallies might be possible into October/November ahead of weakness into 2025.
The two most likely initial targets of resistance for generic Copper futures lie at $4.70, then $5.20. Strong support lies near $4.12 and should not be breached right away without postponing a Copper rally.
Copper Futures