
^SPX 0.24% managed to extend gains sharply following FOMC’s 75bp hike Wednesday, though there seems to be confusion everywhere as to whether the hike was dovish or hawkish. Technically speaking, this kind of uncertainty is precisely what can lead Equities higher at a time when most market participants remain on the sidelines. Near-term, this won’t be a straight line to 4200, but I do suspect that technical resistance might resurface as August gets underway next Monday at 4080-4125 which might cause a slowdown/minor reversal to this bounce. Defensive outperformance has been prevalent this entire week. Overall, ^SPX 0.24% gains should not exceed 50% retracement area at 4138 before pulling back to near 3800-50 into mid-August. However, there doesn’t need to be a move down to test lows right away and trends remain bullish overall for gains into September, regardless of if the first couple weeks of August are rocky. For those with a four-to-six week timeframe or longer, being long and buying dips looks correct.
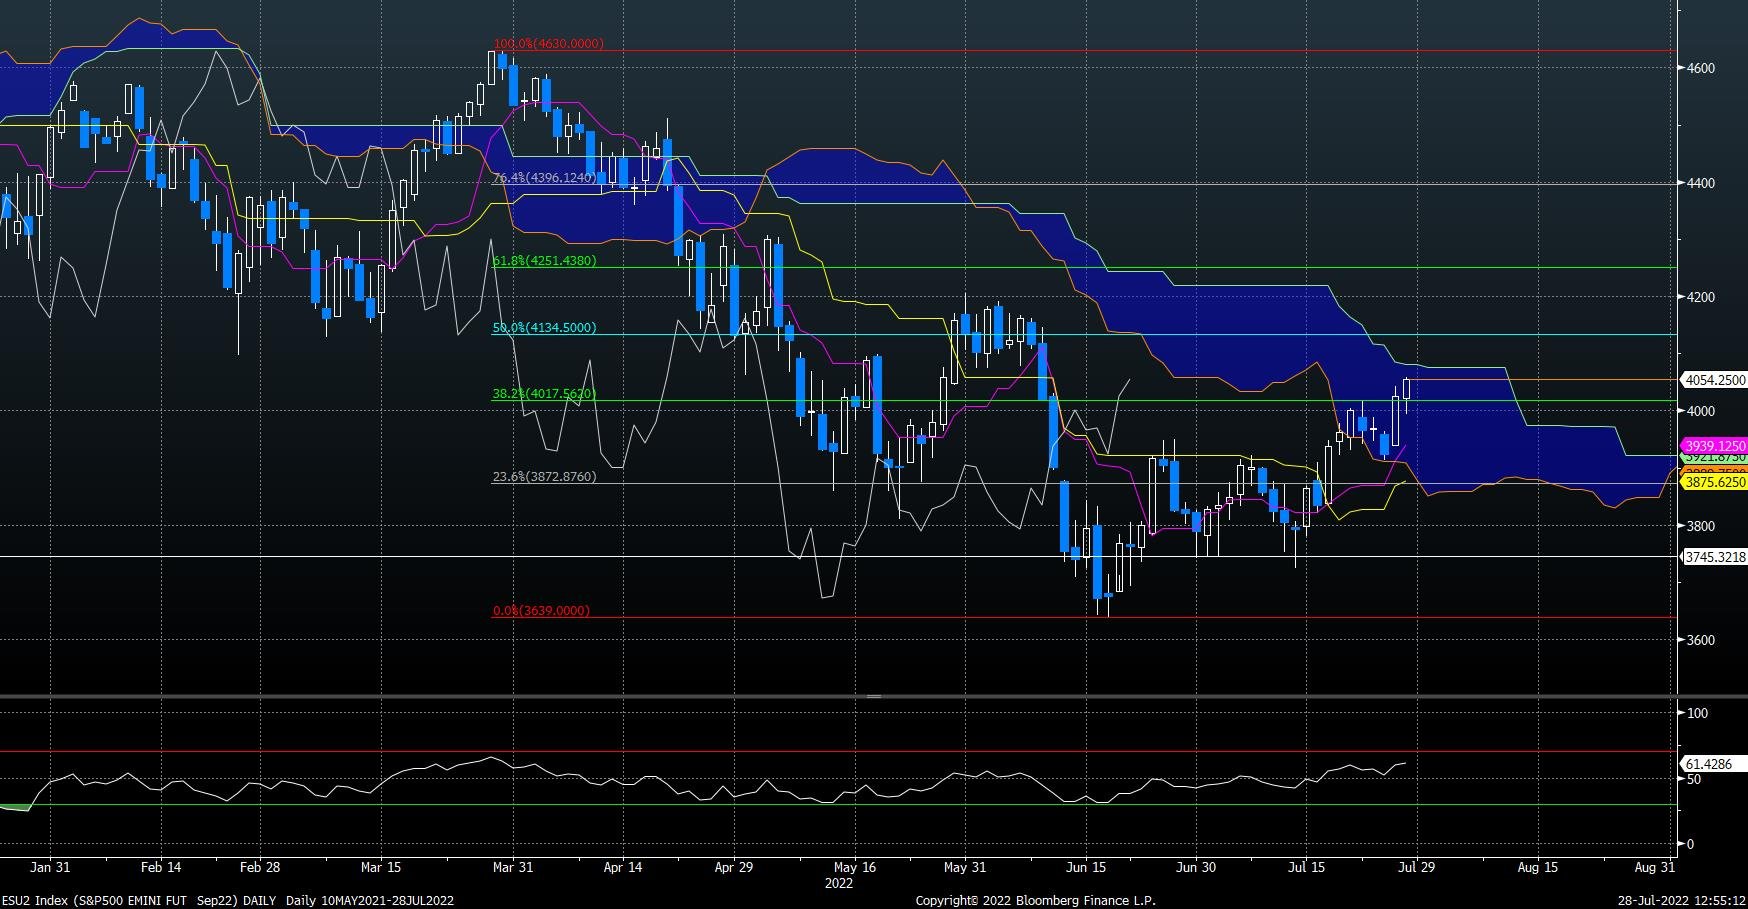
Technically speaking, the following seem important reasons as to “why” Equity indices might stall as we close out July and head into early August:
-SPX is nearing Ichimoku resistance which should come into play Friday/Monday.
-Wave structure shows this rally from June lows as a possible “5-wave advance.”
-Technology has stalled out and underperformed this last week, and SOX looks to be right up against strong downtrend line resistance.
-Most of this week has been defensive in nature, with Utilities and REITS outperforming, and Staples outperforming Discretionary.
-Overall, while this has been a constructive move off the lows from June, Technology has been a big winner and outperformer over the last month. Pullbacks should prove short-lived and likely begin in early August and extend into mid-August before a continued rally into September.
Treasury yields break down after poor GDP print
Thursday’s violation of support in ^TNX 1.12% looks important and negative, as yields have just breached the “neckline” of what is now an official Head and Shoulders pattern.
This was difficult to confirm as a Head and Shoulders pattern until Thursday’s breakdown, but this is a bearish pattern that should lead ^TNX 1.12% lower to 2.35-2.45% in the coming weeks.
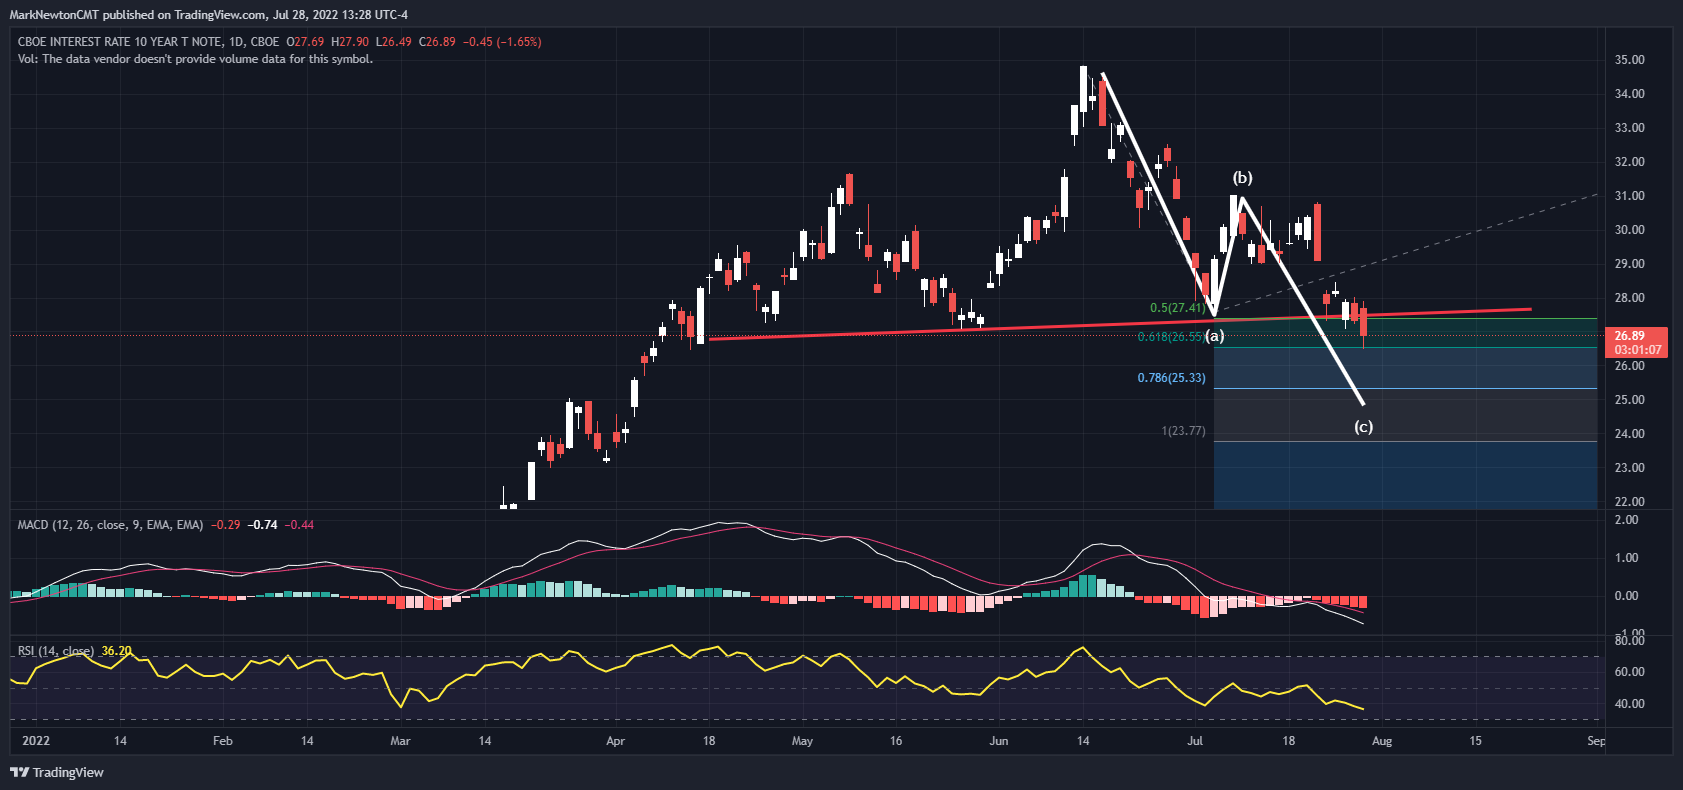
Overall, my thinking of “one-more” move back to highs in yields remains intact, and I do not feel that highs for the year in Treasury yields have been established. Yet, this turn back higher likely won’t start until early August, and this week’s near-term breach of monthly lows in US 10-Year Yields as well as 5’s and 30’s looks important for the days ahead.
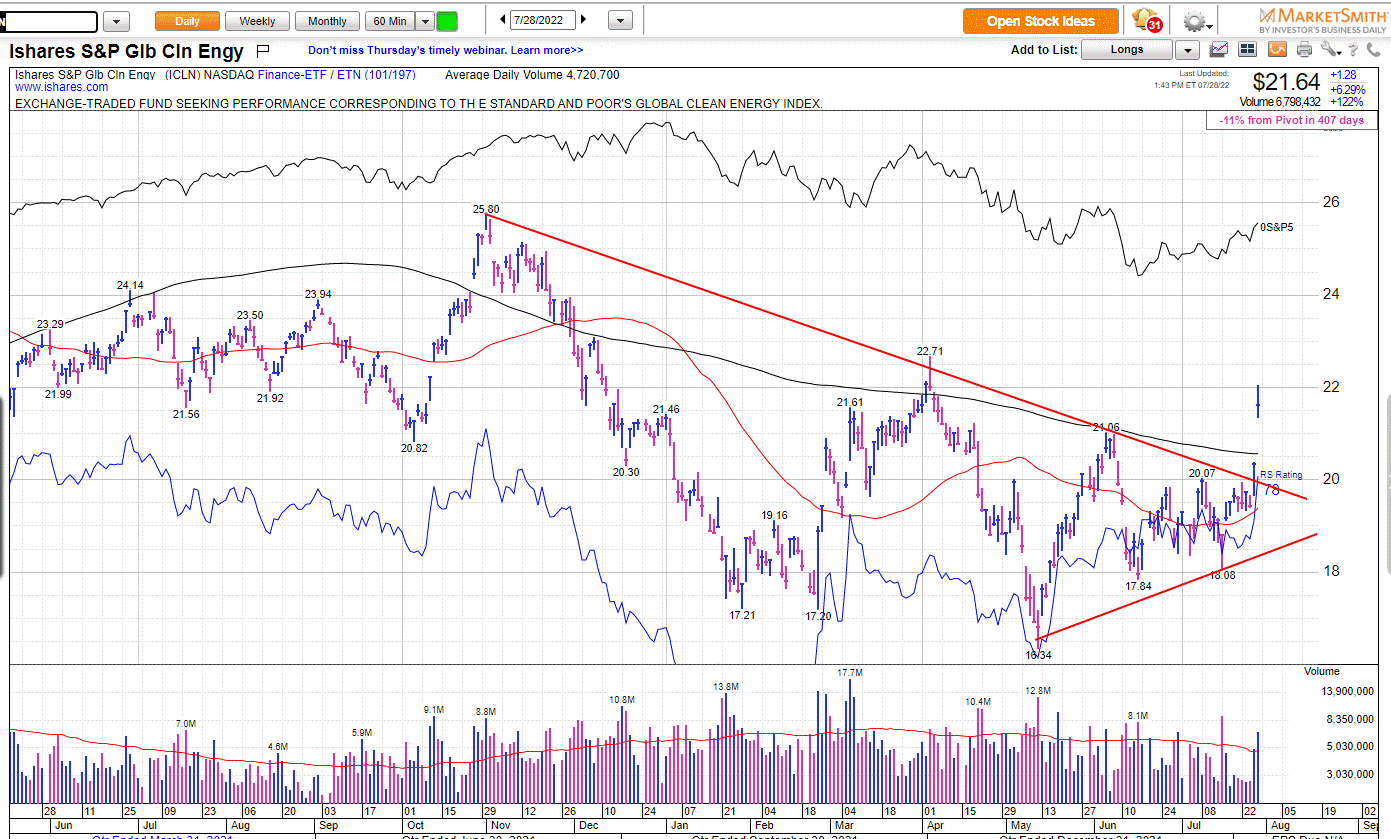
Clean Energy stocks starting to play catchup; Bullish breakout bodes well for this group to strengthen into September
Senator Manchin’s resurrection of the bill addressing Taxes, Climate, and Energy looks to have spurred on some constructive movement out of many of the Alternative Energy issues. The iShares S&P Global Clean Energy ETF, or ICLN -1.10% , broke out of a triangle pattern that had been forming since the peak last November 2021. This can also be seen in Invesco’s Solar ETF TAN -0.52% which is making a similar breakout.
Rallies up to 22.50-22.75 look possible in the near-term to test April 2022 peaks. However, some type of low volume consolidation is likely in August to alleviate overbought conditions. Bottom line, any pullback over the next 2-3 weeks creates a very attractive risk/reward opportunity to buy dips in this group. Intermediate-term targets lie at $26, then $27.40.
Favored stocks within the Clean Energy space include ENPH -2.61% , SEDG -1.68% , and to a lesser extent, FSLR -2.58% . Daily charts of ICLN -1.10% shown below illustrate this technical breakout today.
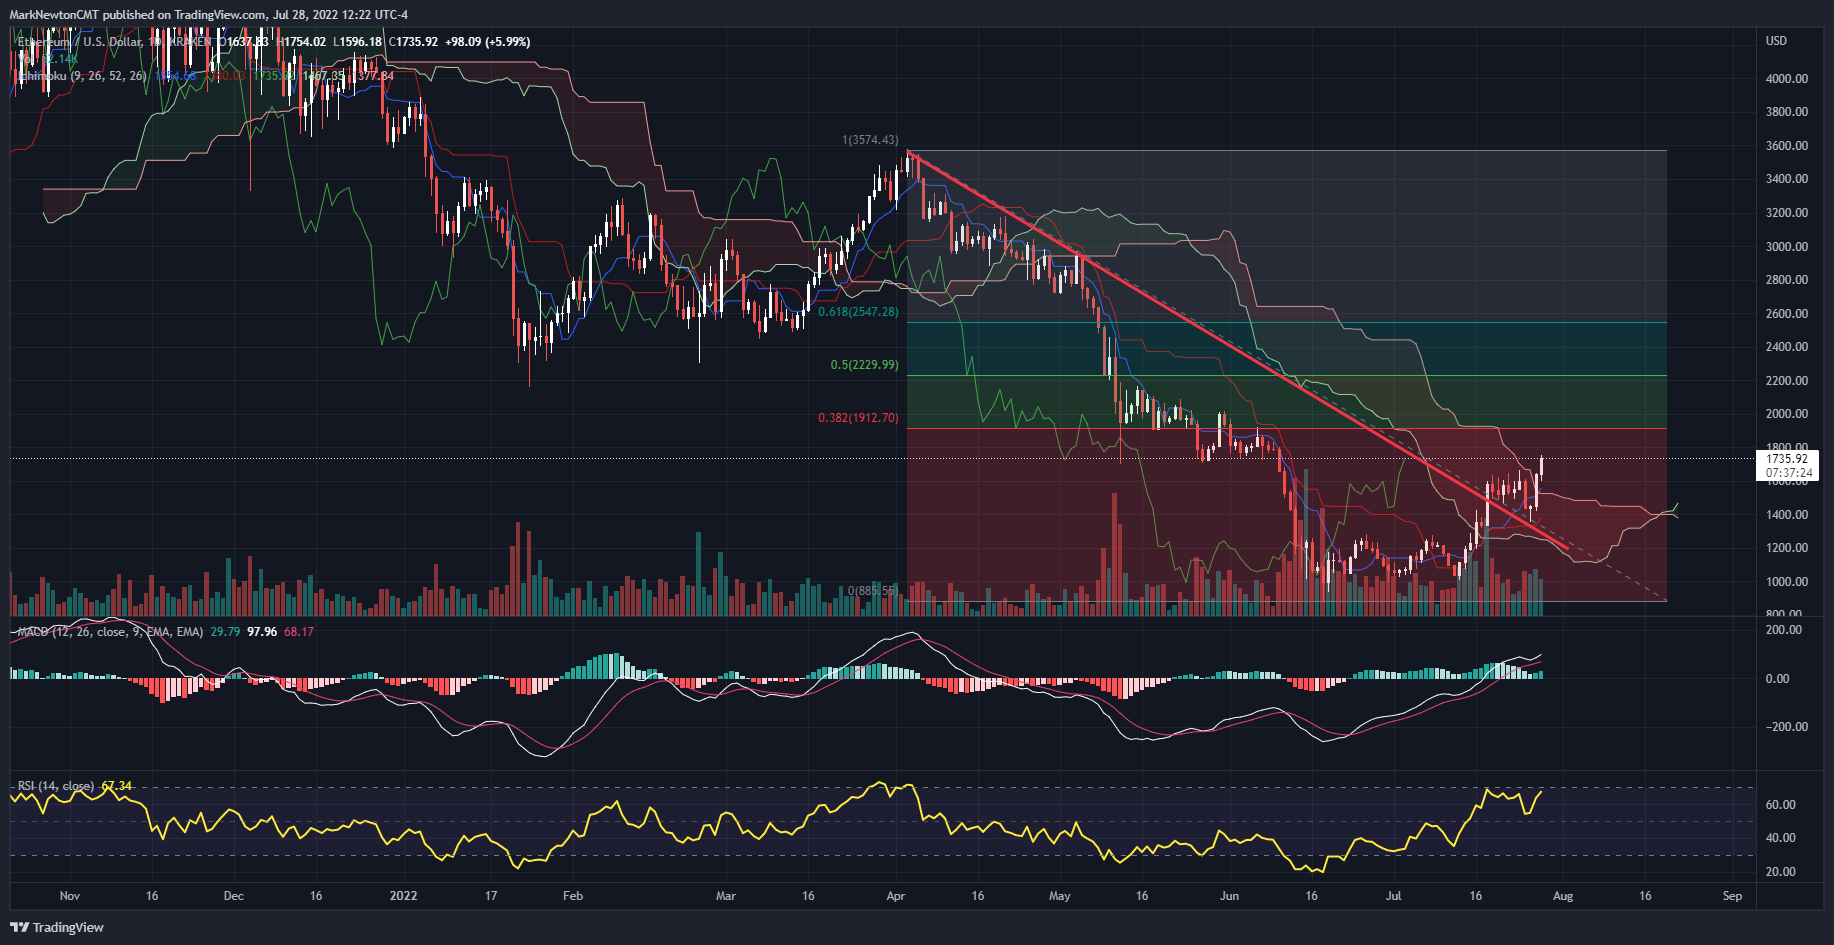
Ethereum breakout bodes well for near-term follow-through into early August
Ethereum’s breakout of last week’s range is technically bullish near-term and should result in prices pushing higher to 1915-2000 in the days ahead before some consolidation gets underway. As daily charts show, ETHUSD broke out of its multi-month downtrend back in mid-July before moving sideways over the last 10 days. This helped to alleviate near-term overbought conditions. Overall, prices have now doubled off the lows from June 18, though I’m not expecting any meaningful resistance prior to ETHUSD reaching the 38.2% Fibonacci retracement area which intersects near $1913. Long bias remains preferred for the months to come but traders could look to sell into gains by end of week on any advance back over $1900. Following a stalling out into next week, pullbacks would be attractive to buy at $1450-1550 on any weakness, particularly into mid-August, time-wise. Ethereum looks more attractive technically than Bitcoin in the short run, so pullbacks into mid-August should be buyable.