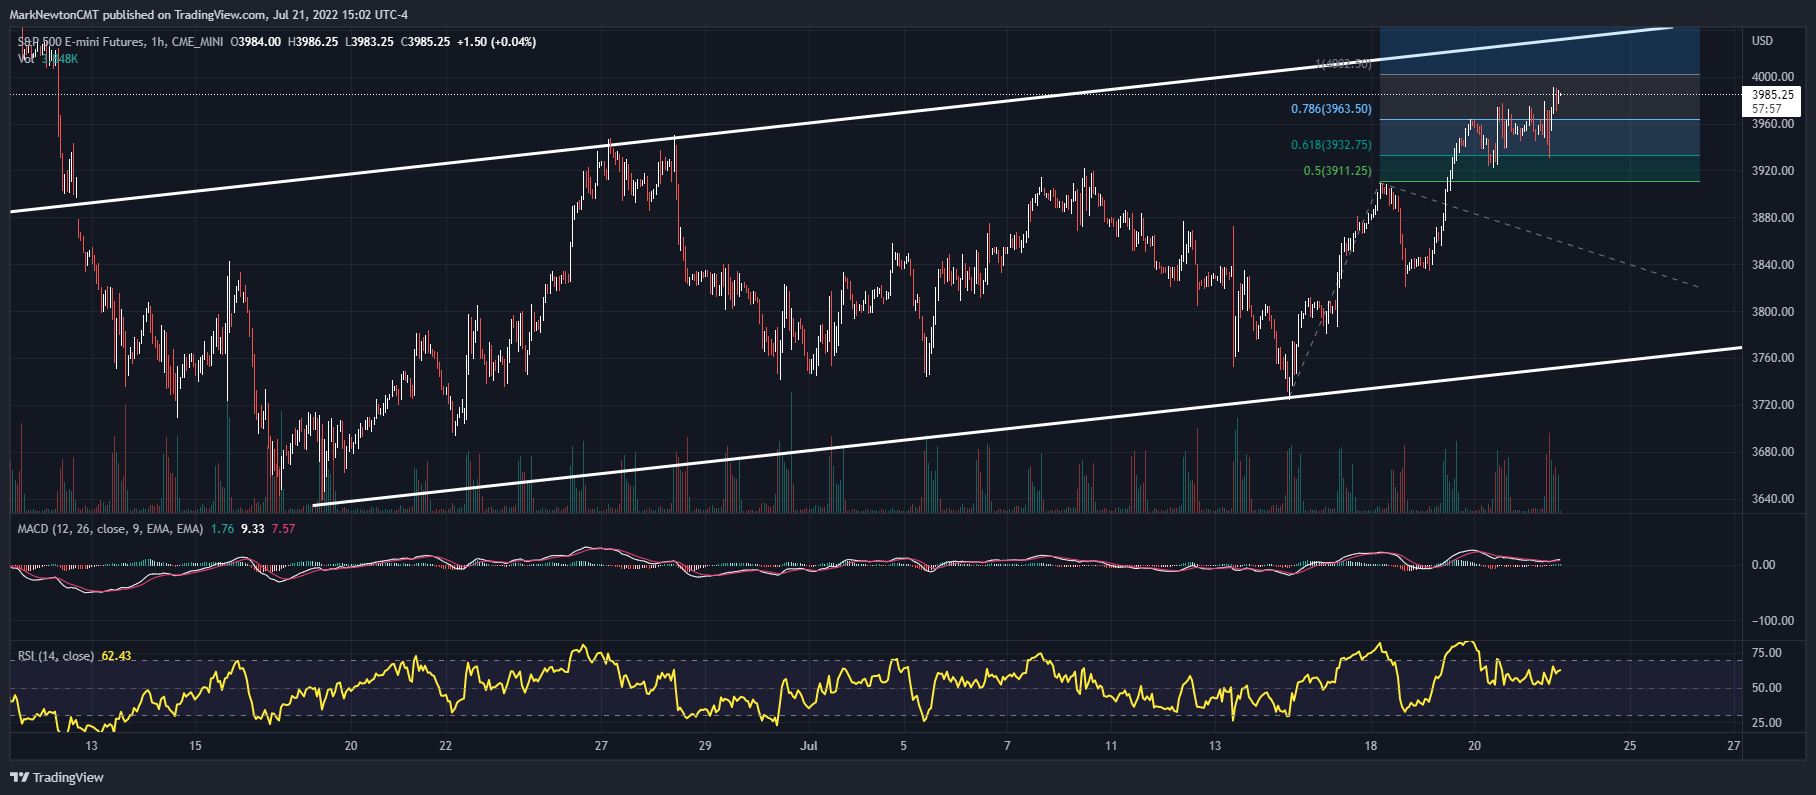
Stock indices and many sectors are getting closer to areas of near-term tactical resistance, and this could materialize Friday before starting a minor consolidation. The bounce from July 14th is now close to equaling the price points gained of the initial push off the lows from mid-June, and ^SPX 0.24% is nearing the upper edge of its trading channel of the last month. While both ^SPX 0.24% and QQQ 0.36% managed to extend gains around 1-1.5% in Thursday’s trading, the formerly strong breadth from early in the week has begun to wither. While no evidence of any trend reversal occurred on Thursday, DeMark indicators like TD Sequential and TD Combo are starting to show a confluence of exhaustion on a confluence of intra-day charts. Overall, while this week’s move has been quite constructive, it’s tough pressing long bets with ^SPX 0.24% up nearly 9% off the June lows heading into one of the more important FOMC meetings this year. Technically, traders might wish to book some profits Friday/Monday, while investors should be ready to buy dips on any corrective activity seen heading into next week. Cycles start to turn higher in August, and it’s thought that any pullback into next week should be buyable.
Semiconductor stocks nearing resistance
While the Software names have just begun to spring back to life in recent days, it’s the price action of the leading groups like Semiconductors that bears watching closely in the days ahead.
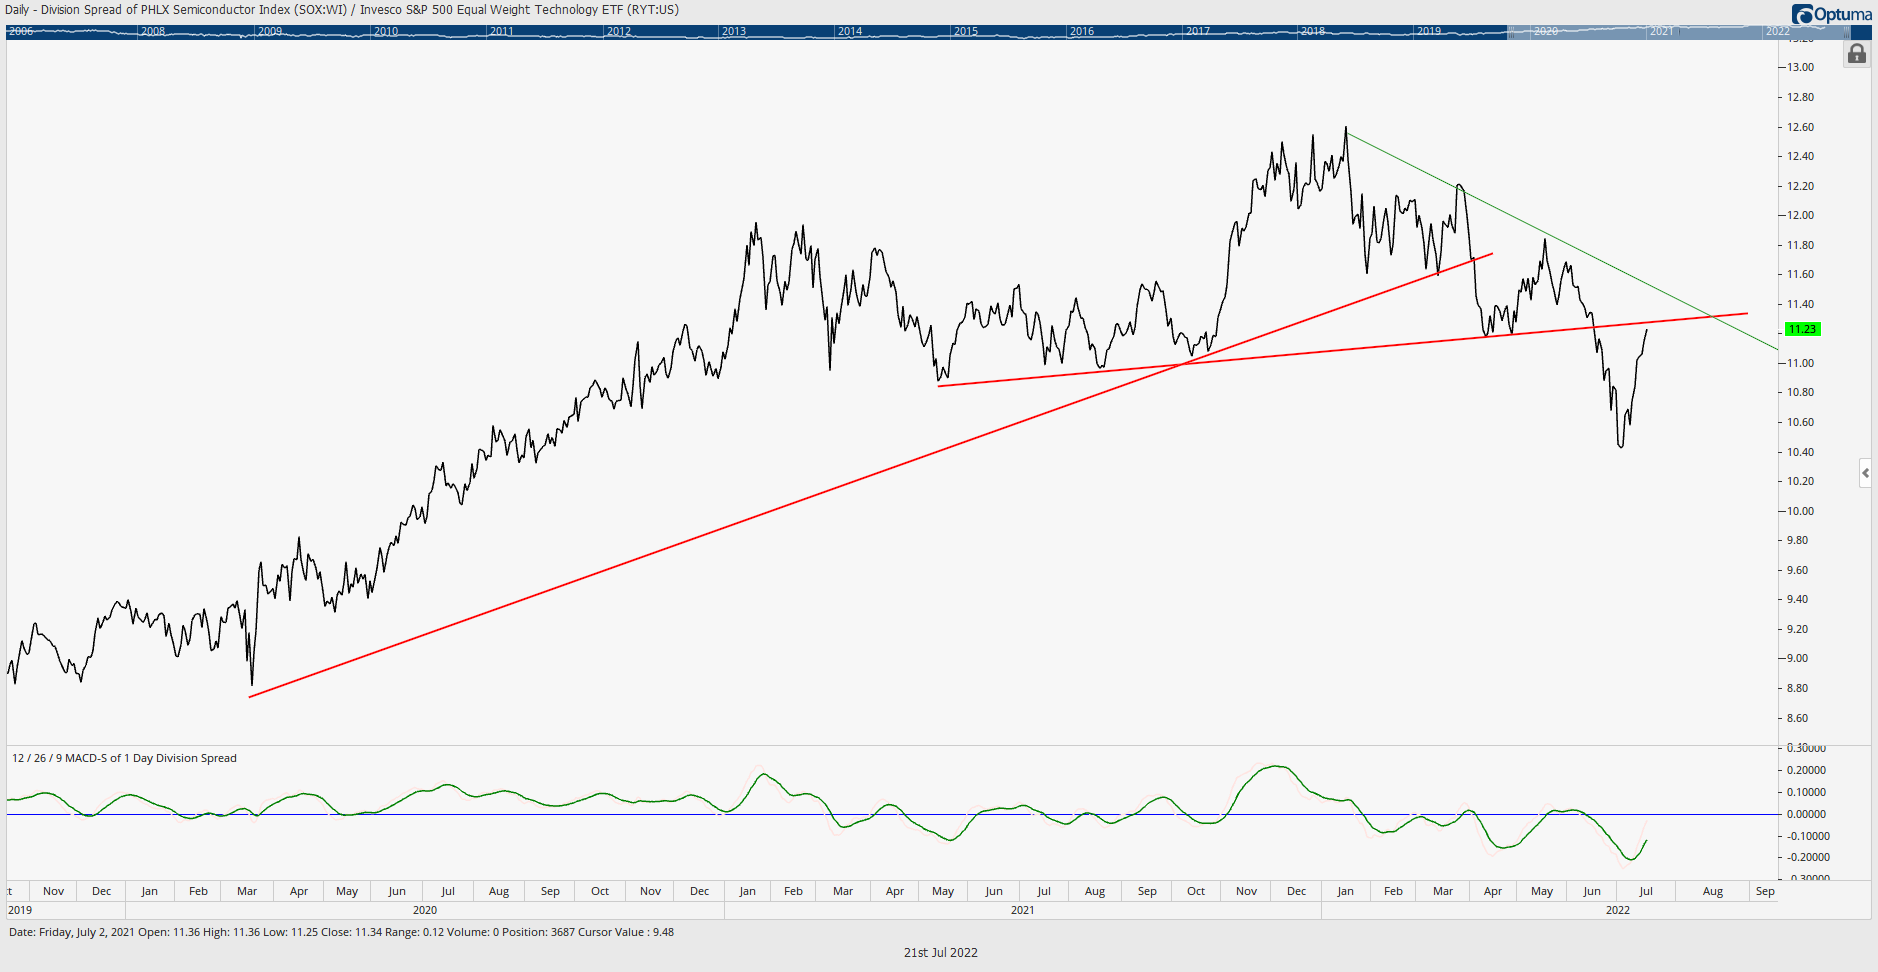
As daily ratio charts show, the Philadelphia Semiconductor Index (SOX) vs Technology (Invesco’s Equal-weighted Technology ETF RYT used) has now rebounded to test the area of the breakdown last month. Technical formations like this tend to be strong overhead resistance.
While a breakout above the red and green lines shown below would certainly be respected and used to increase weightings of Semiconductor holdings, at present, technicals suggest some stalling out is a very likely outcome after this recent bounce. Many other Equity indices and Sectors are showing similar chart structure, which likely translates into near-term consolidation for risk assets after a very strong bounce in price and breadth this week. Key resistance for SOX in absolute terms lies near 3000, a level that bears are watching carefully into next week.
Small-caps might also “Hit a Wall” in the short run after having rallied to Make-or-Break resistance
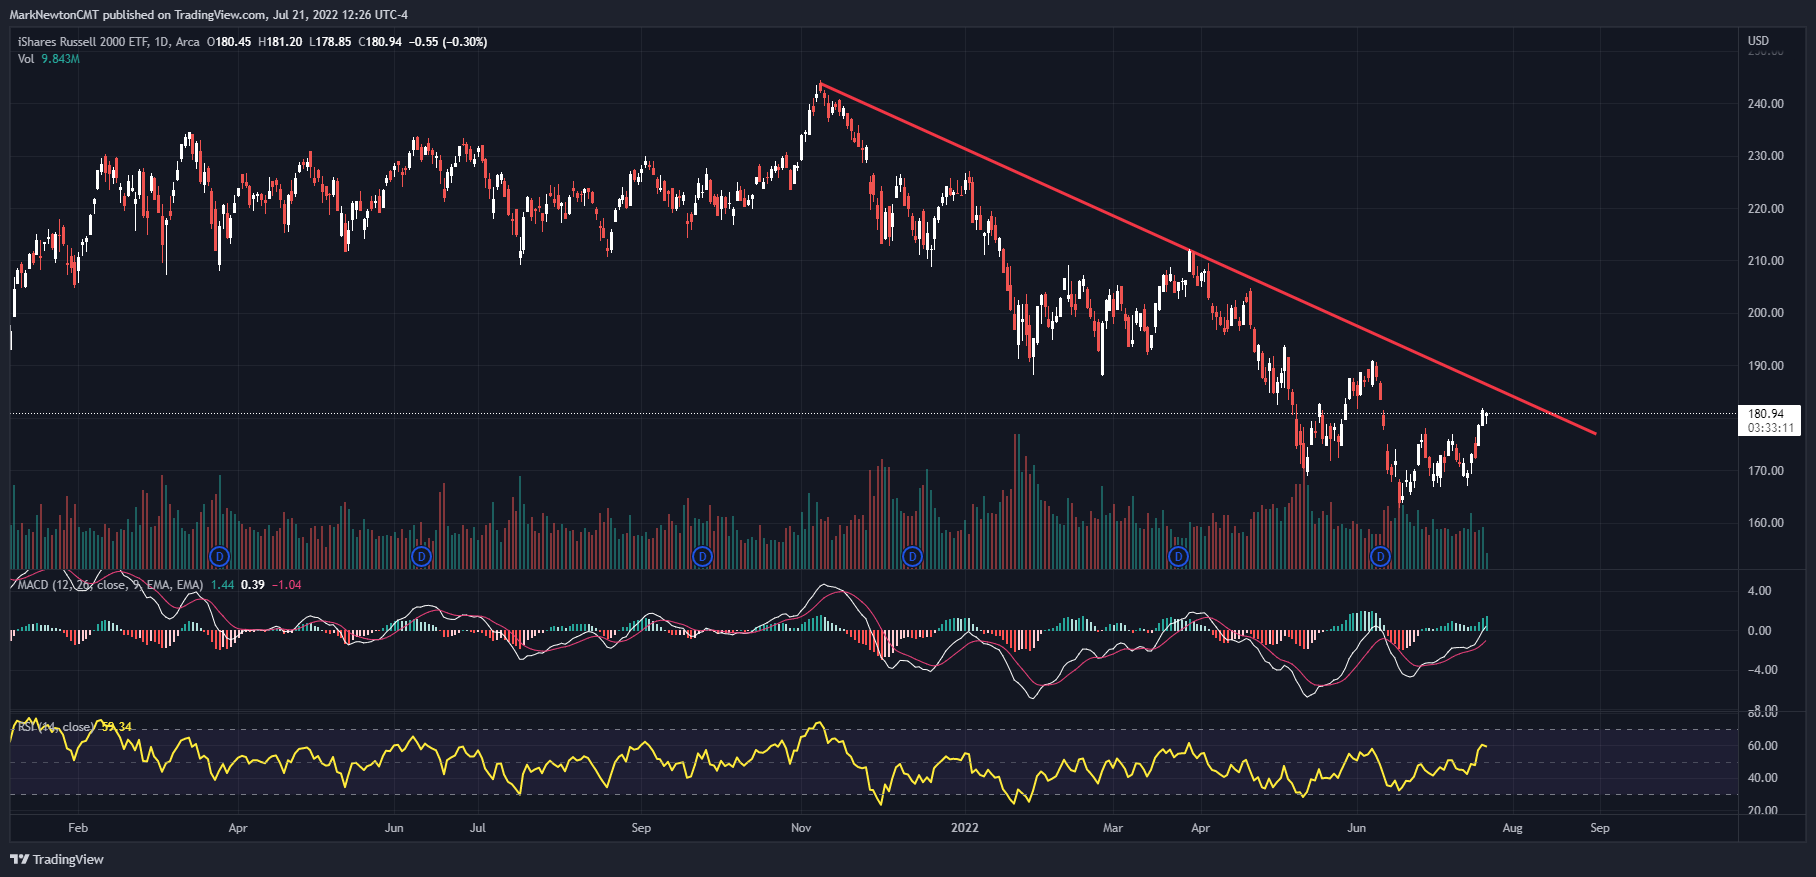
In the last week, we’ve seen favorable price action out of the Small-cap arena, and relative charts shown earlier in the week illustrated the breakout in Russell 2000 vs the S&P 500. This looks to be another piece of the puzzle, which suggests that some stalling out is very possible after this recent rally.
Trend following bulls will need to see IWM -0.03% rally back over 185 to have confidence of a breakout. At present, it’s right to watch this down sloping trendline carefully for evidence of a stall out and/or trend reversal. However, while not immediately expected, any close back over 185 would lead to an immediate follow-through. Overall, the next 2-3 days will answer lots of questions on whether prices stall or breakout in absolute terms. It’s expected that reversals could be more likely over the next few days after reaching this “make-or-break” level, but given the bearish sentiment levels and our early week breadth thrust, one cannot rule out a continuation.
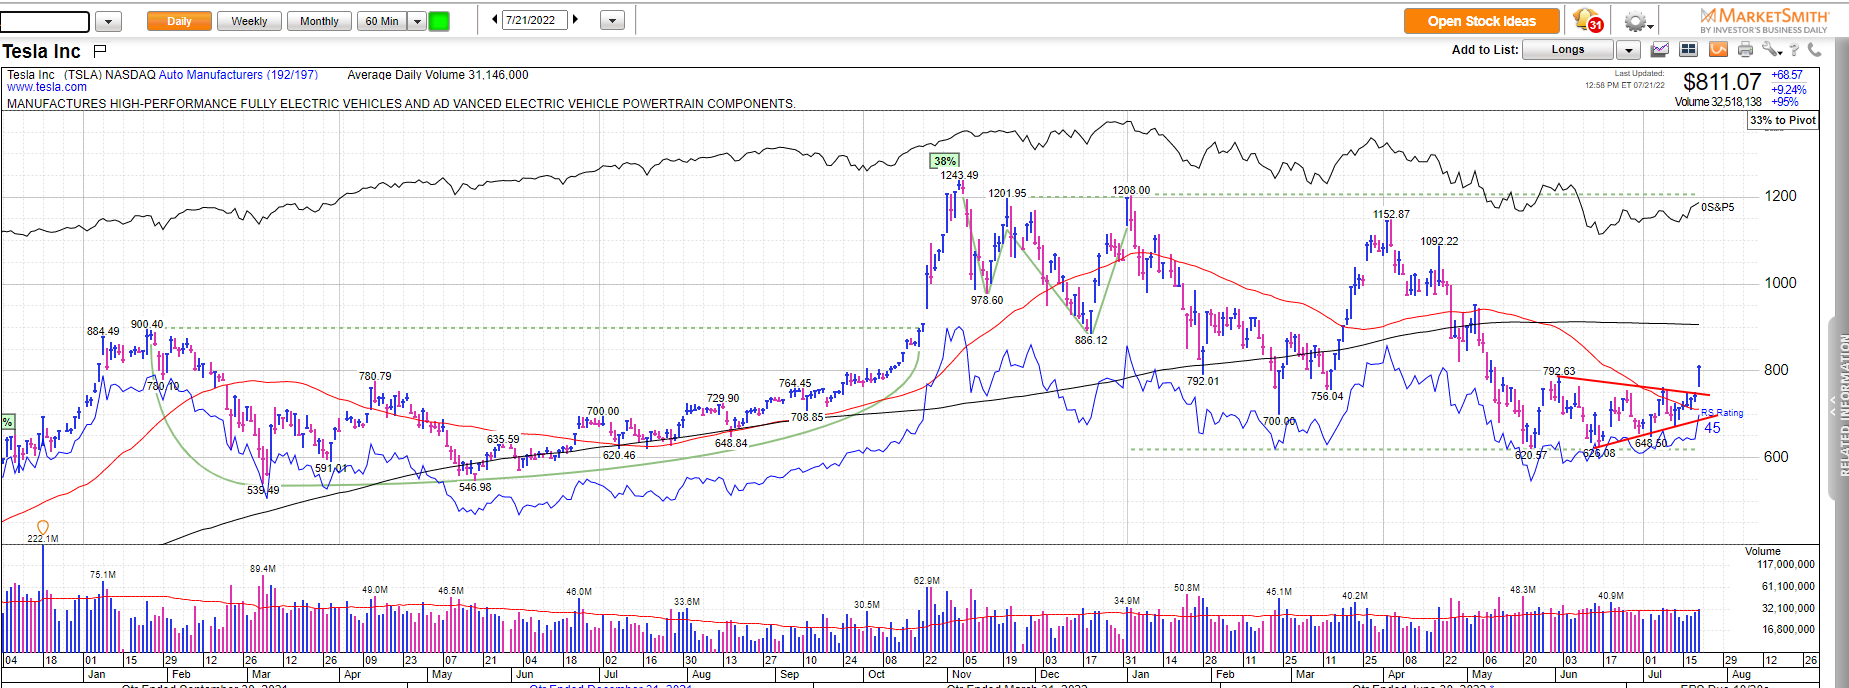
Tesla consolidation breakout a relative bright spot
Shares of TSLA -3.53% broke out Thursday above important consolidation resistance, suggesting that this recent range-bound trading likely is being resolved to the upside.
Short-term resistance targets lie at 824, then 886. Despite broader markets showing evidence of being stretched near resistance, TSLA -3.53% looks likely to continue higher in the weeks to come.
Importantly, this move helps to bolster the “FAANG” group even further, which has largely proven resilient since bottoming out in May. It’s thought that a return to Growth is likely in 2H 2022, as Tech starts to show better performance, while Energy and Materials might slump a bit more into August.