Key Takeaways
- S&P, NASDAQ and DJIA have all bounced to key downtrend lines from early September. Thursday’s relief rally doesn’t yet turn trends bullish, but closing above Sept 27 highs would argue a move to new highs is underway
- Breadth is an impressive 5/1 bullish with 8 major SPX GICS Level 1 groups up more than 1%
- Treasury yields have pushed higher to test Sept 28 peaks. Climbing to new monthly highs would argue that a Treasury selloff/yield breakout to test former yield highs is underway
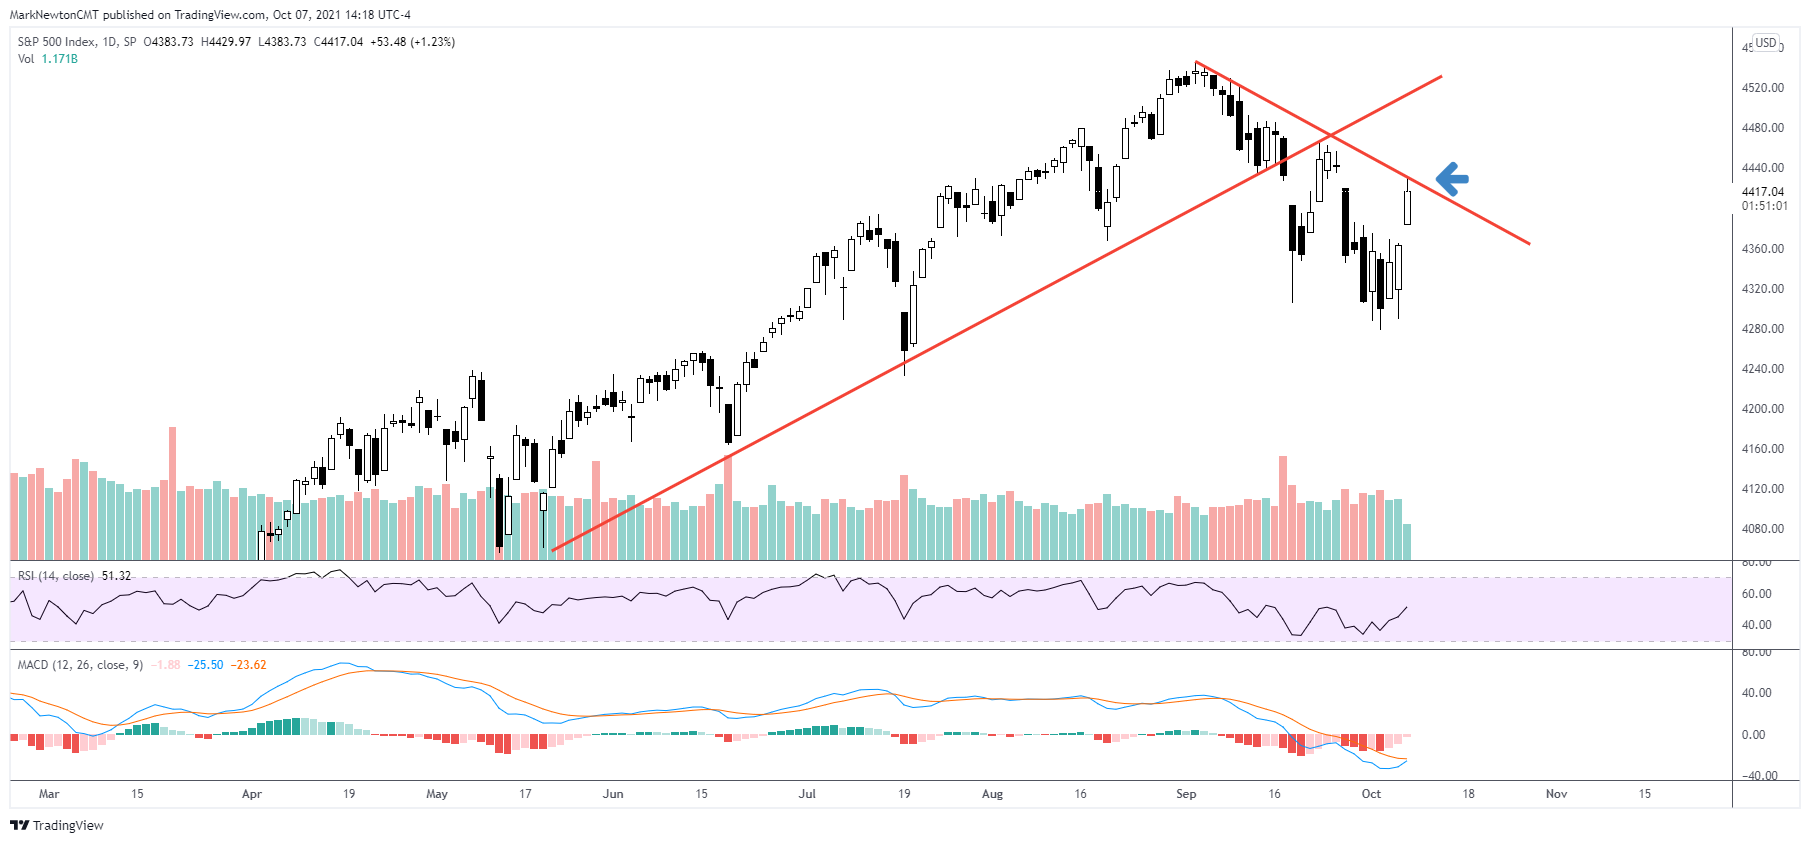
US Equities have nearly climbed to the maximum area which can still allow for a near-term bearish stance. SPX, DJIA and NDX have all pushed higher to test the downtrend from early September and breadth is a strong 5/1 bullish with 8 sectors up 1% or greater. Key levels for SPX lie at 4435-7-SPX while any close over 4465.40 from Sept 27 intra-day peaks would lead to a push back to new high territory. Unfortunately, one cannot yet make this call and price action is not unlike what was seen two weeks ago on 9/23 which ultimately proved to be just a bounce
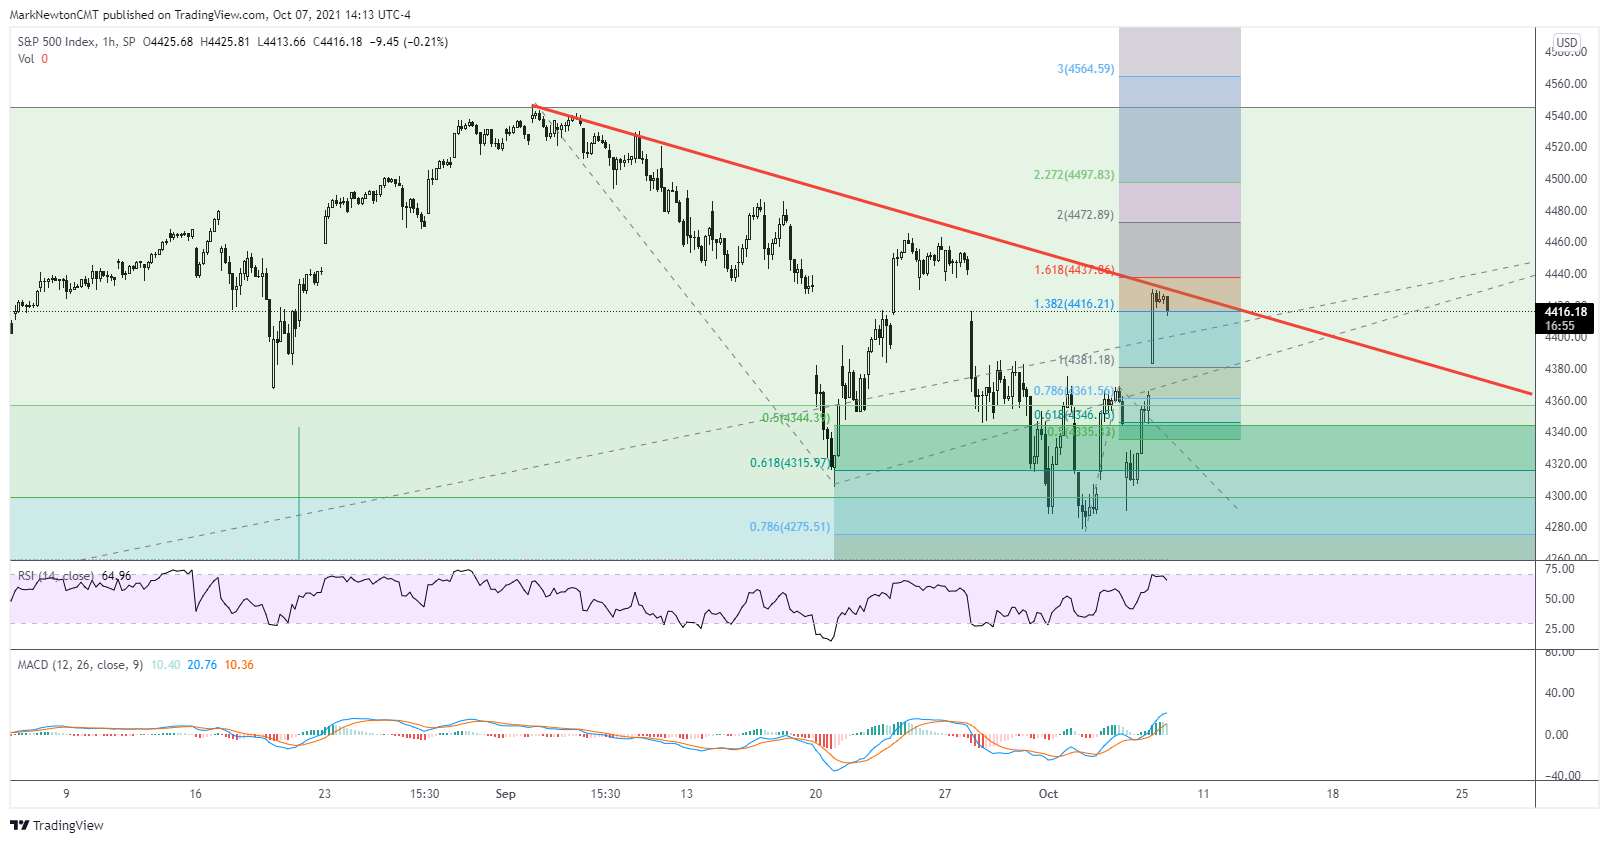
SPX daily chart shows prices right up to Resistance -Next 2-3 days important- Key Levels given below
Three additional comments: 1) I think it’s fair to say a breadth low is a strong possibility given Thursday’s 5/1 positive breadth. 2) Any further deterioration from here given 3 days of higher prices likely will not record the same degree of negative breadth nor momentum lows. Thus, this will create positive momentum divergence, even if this week’s lows are taken out. Both of these are positives, suggesting any further dips should be bought if they approach, and/or take out this week’s lows, and further declines will prove short-lived, for now. 3) Key areas which if exceeded, would turn the trend to bullish are 4465.40 for SPX cash (4473 for S&P Futures) The area at 4435-7 is initially important (This is a Fibonacci extension of the first bounce off Monday 10/4 lows. )
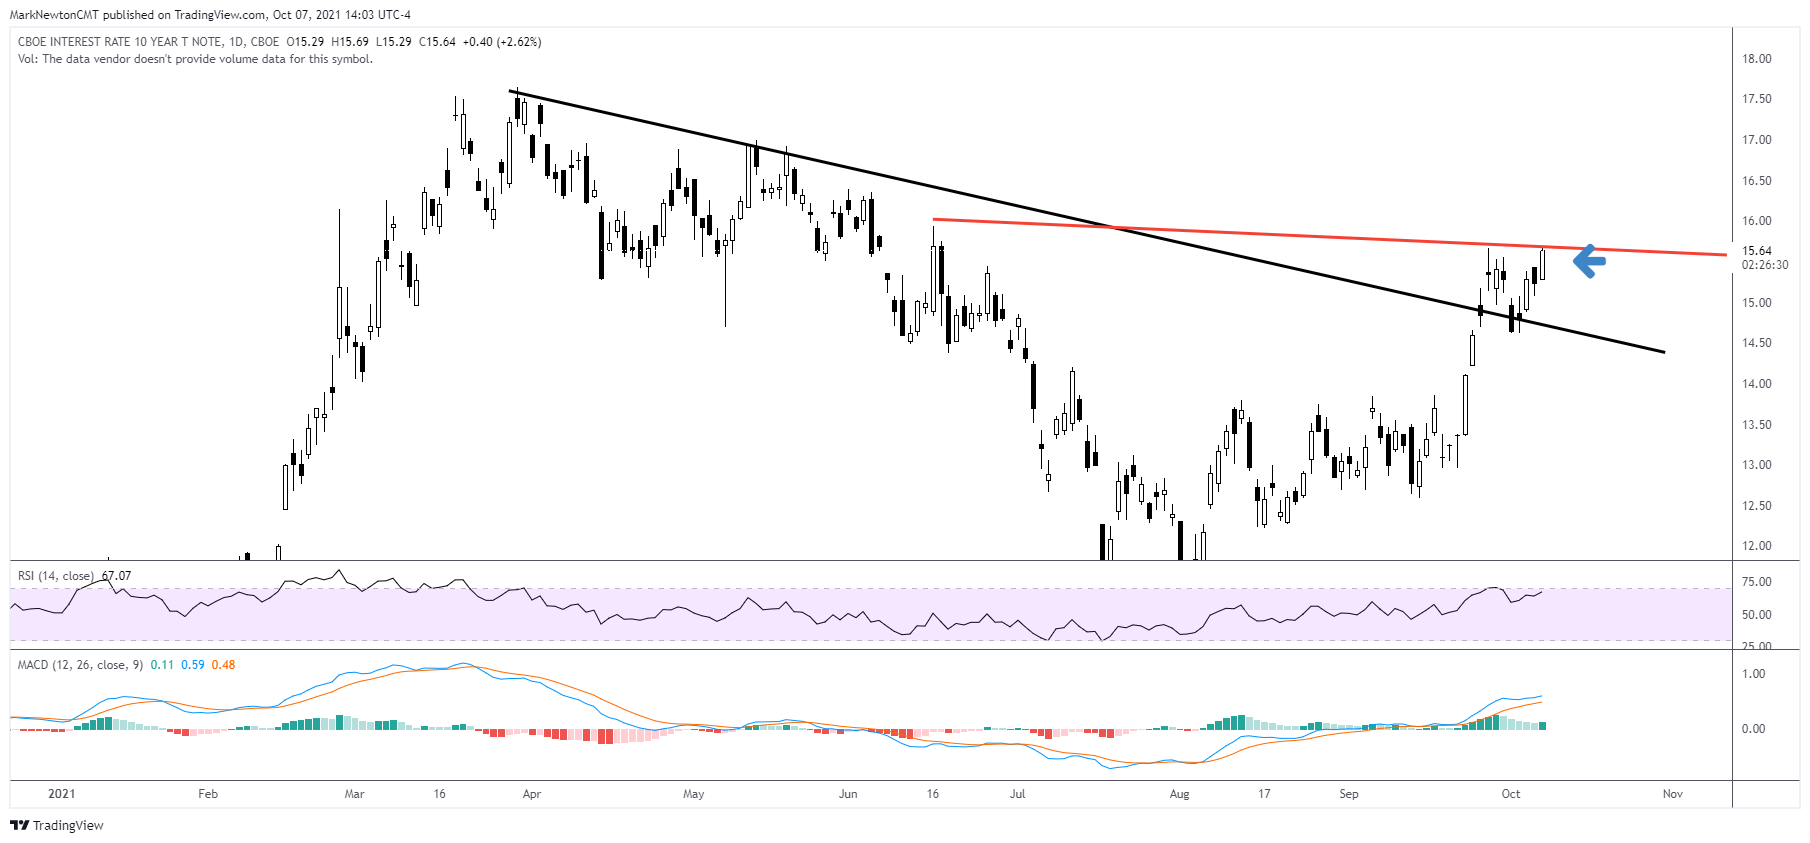
Treasury selloff has continued, and new monthly highs for yields would argue for larger rally in yield terms
10-Year Treasury yields have pushed up to test highs from September 28th and also June 16th. The entire yield curve has pushed higher and yields are now up to make-or-break resistance, not dissimilar from Equities. Climbing above 1.595 would argue for an extension of yields into November
Even if yields back off in the short run, it’s still likely that any minor dip should be one to consider selling Treasuries, expecting yields start a larger move up to test Spring highs.
This Move in yields has been tremendously helpful for Financials, a group that’s outperformed given the recent move in Treasuries, and one which looks to continue into mid-Q4. Thus, Financials should be favored, and specifically, Regional Banks and Insurance names.
10-Year Treasury Yield Daily chart- Yields now up to key levels