After rallying some 25% from the December, 2018, low it shouldn’t be surprising to see US equity investors take some money off the table, particularly in face of increasingly uncertain US-China trade tensions. But, as I’ll point out, that’s likely to be short-lived.
The weekly technical indicators I have featured here over the past few weeks have signaled the growing risk of pullback developing in the second quarter. However, as always, once equity markets begin to decline, investor sentiment quickly pivots to the negative, reinforcing already worrisome headlines in a sort of self-perpetuating spiral lower. With most stocks selling off quickly this week, it’s certainly understandable investors remain nervous and quick on the sell trigger.
From a technical analysis perspective, however, there are early signs the sell-off is likely to be a passing storm. Why?
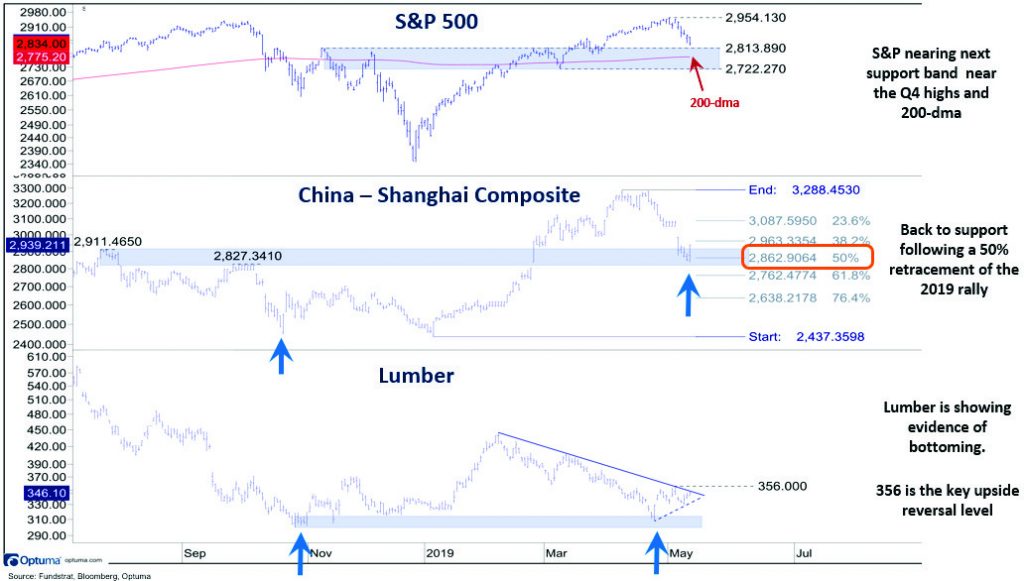
First, shorter-term trading indicators are becoming oversold as the S&P 500 corrects back to its first important support range near the Q4 2018 trading range highs (2814), its 200-day moving average (2775) and the March pullback lows (2722).
Secondly, China’s Shanghai Composite, which peaked in early April, well in advance of the S&P 500’s highs, is already showing early evidence of bottoming near an important support range between 2800-2900. (See chart below.) This support band is meaningful given it coincides with the highs in July and October 2018 which conveniently is at a 50% retracement of the 2019 rebound. Here again, like the S&P 500, short-term technical indicators are oversold and supporting a rebound.
Lastly, as one of many economic commodity barometers, lumber is showing evidence of bottoming following a pullback from its February highs.
Granted, lumber can march to its own drummer, but we have seen it lead many turns in macro markets. As a reminder, lumber established its initial low in the fourth quarter of 2018, as did China’s Shanghai’s Composite, well in advance of the S&P 500’s late December lows.
The bottom line: The second quarter should remain choppy for US equity markets but the recent pullback is an opportunity to add to equity exposure in anticipation of a strong second half in 2019.


