


Key Takeaways
- Of the six factors we track, the size factor (small-cap stocks) showed the best performance over the past month. Value and momentum also outperformed, while the growth factor continued to lag.
- After a strong April, our dynamic factor portfolio continued to outperform in May, returning 0.4% more than the S&P 500. Since the start of 2020, this strategy has outperformed the S&P 500 by 8.7%.
- After the latest rebalance, the dynamic factor portfolio is overweight low-volatility and momentum while being underweight size (small-cap) and growth.
- Our stock selection model continued its winning ways in May, as a basket of the favored stocks from the model outperformed the S&P 500 by 2.41%. Four of the five custom factors that make up the stock selection model outperformed the S&P 500, with the value, quality and estimates factors all contributing strongly in May.
- Our market valuation methodology continues to see equities as overvalued relative to investment grade fixed income. As a result, we expect muted returns and sustained volatility to continue in the equity market.
Factor Performance Review
We track the performance of six factors (growth, quality, low-volatility, momentum, size, and value) as part of our multi-factor strategy. Over the past month, the best factor was size, as the Russell 2000 outperformed the S&P 500 by 3.3% over that period. Other factors showing positive return were momentum (+1.5% relative to the S&P 500) and value (+1.3%). Growth continued its trend of underperformance, as it trailed the S&P 500 by 1.4% over the past month. Performance for each of the six factors over the past month is shown as the gray bars in Fig. 1.
Looking back over a 3-month period, the low-volatility and value factors performed best, outperforming the S&P 500 by 5.1% and 3.6%, respectively. The worst factor on a trailing 3-month basis was growth, which underperformed by 3.7%. At a 12-month horizon, size still lags the other five factors by a substantial margin, as small-cap stocks have underperformed the benchmark by 16.7% on a trailing 12-month basis.
Fig. 1 – Recent Performance of Factors
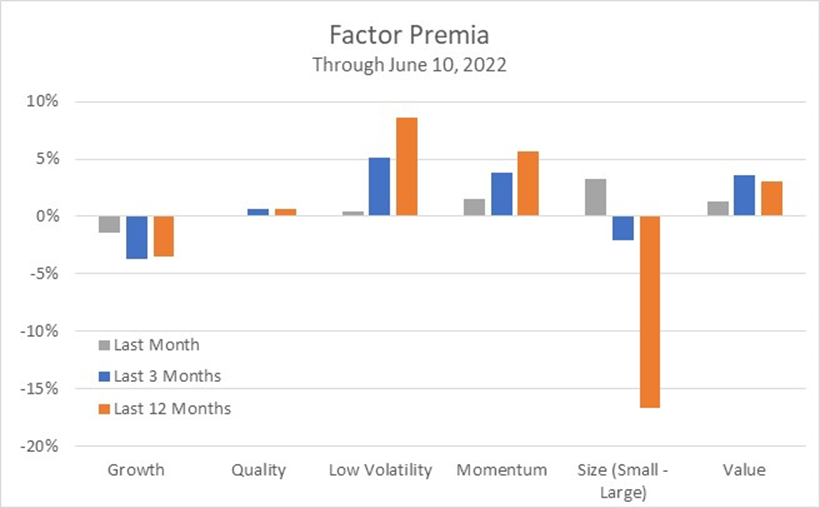
Note: Shows the performance of six factors (growth, quality, low-volatility, momentum, size, and value) relative to the S&P 500. Gray bars indicate performance over the past month, blue bars over the past 3 months, and orange bars over the past 12 months. Analysis runs through June 10, 2022. Transaction costs are not considered.
Multi-Factor Portfolio Performance Review
We track a dynamic multi-factor portfolio that tilts weight toward the factors with the best recent performance, and away from the factors with the worst recent performance. Fig. 2 shows the cumulative performance of this dynamic multi-factor strategy relative to the S&P 500 since 1997.
Fig. 2 – Dynamic Multi-Factor Strategy Relative Performance
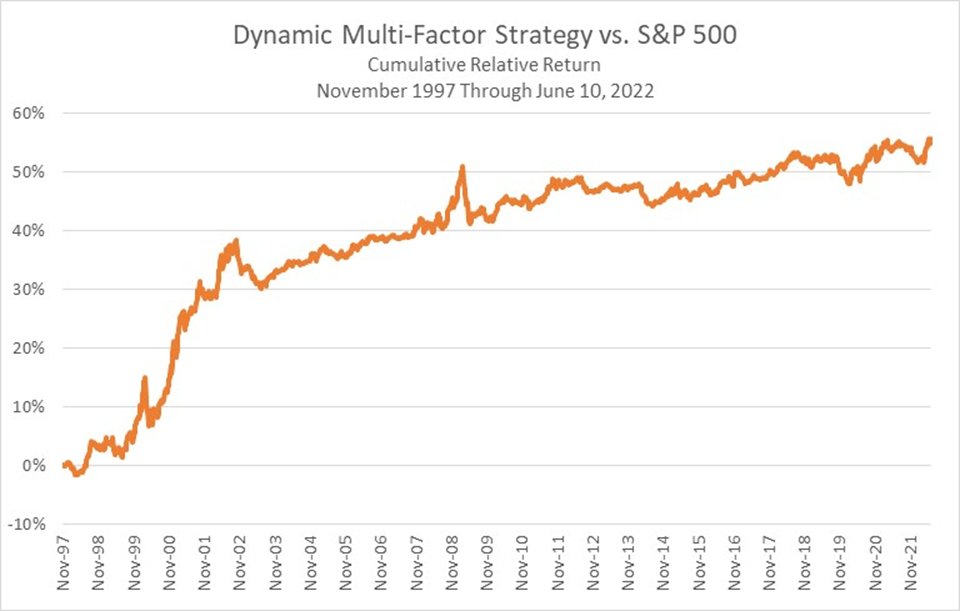
Note: Shows the cumulative returns of the dynamic multi-factor investing strategy. Strategy assigns factor weights using the inverse of 52-week trailing return volatility, and overweights (underweights) the factor with the best (worst) trailing momentum. Strategy is rebalanced monthly. Period of analysis is from November 1997 through June 10, 2022. Transaction costs are not considered.
From the start of 2020 through June 10, 2022, the dynamic multi-factor strategy returned 29.4%. Over that same period, the S&P 500 gained 20.7%, for 8.7% of outperformance for the dynamic multi-factor strategy. Fig. 3 below shows the monthly performance of the dynamic strategy vs. the S&P 500 since the start of 2020. After a very strong April, the dynamic strategy continued to generate outperformance in May, beating the S&P 500 by 0.4%. An overweight toward value and an under-allocation to growth contributed to the model outperformance.
Fig. 3 – Dynamic Strategy Recent Relative Performance
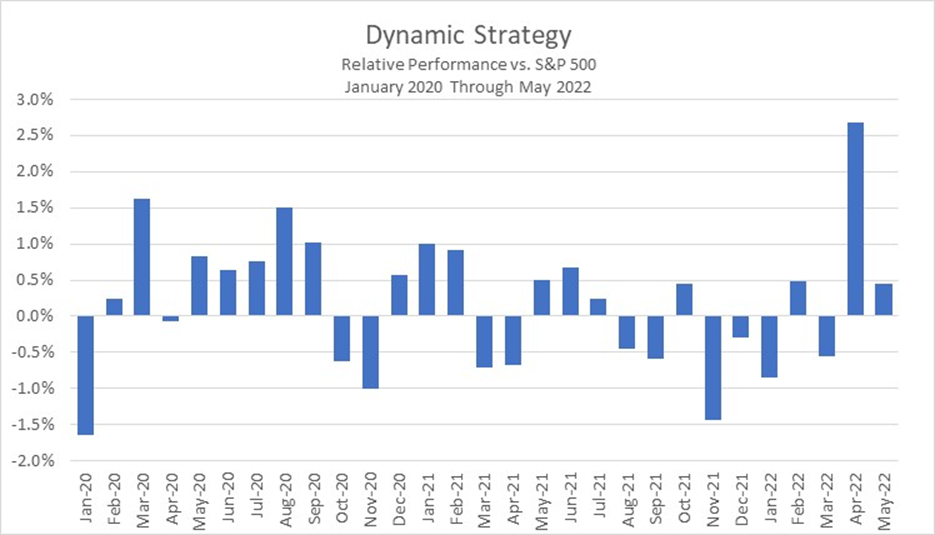
Note: Shows the monthly returns of the dynamic multi-factor investing strategy. Strategy assigns factor weights using the inverse of 52-week trailing return volatility, and overweights (underweights) the factor with the best (worst) trailing momentum. Strategy is rebalanced monthly. Period of analysis is from January 2020 through May 2022. Transaction costs are not considered.
Dynamic Model: Factor Weights for June
Fig. 4 below indicates the latest weights assigned to each of the six factors in the dynamic multi-factor strategy. The dynamic strategy is overweight the low-volatility and momentum factors while being underweight size (small-cap) and growth.
Fig. 4 – Updated Factor Weights in Dynamic vs. Static Multi-Factor Portfolio
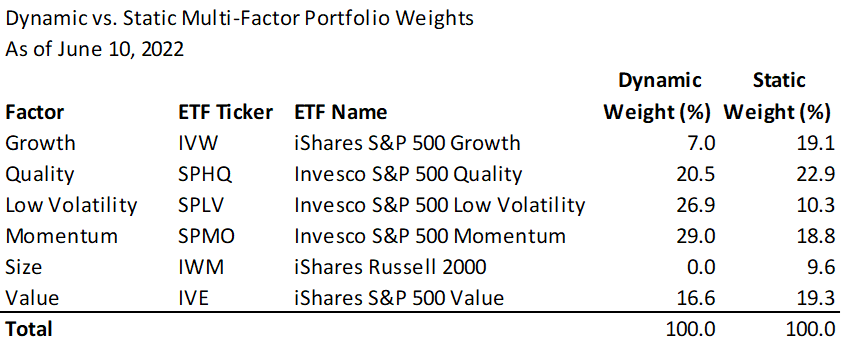
Note: Shows weight for each of the six factors in the dynamic and static multi-factor portfolios as of June 10, 2022.
Baseline Stock Selection Model: Performance and Discussion
We have a stock selection framework that uses composite factors across five dimensions (value, quality, momentum, estimates, and investment) to predict stock performance. The model produces a list of 100 favored investments from across the S&P 500. Fig. 5 below shows the historical performance of the basket of favored stocks, rebalanced monthly.
Fig. 5 – Performance of Long Basket of Stock Selection Model (Relative to S&P 500)
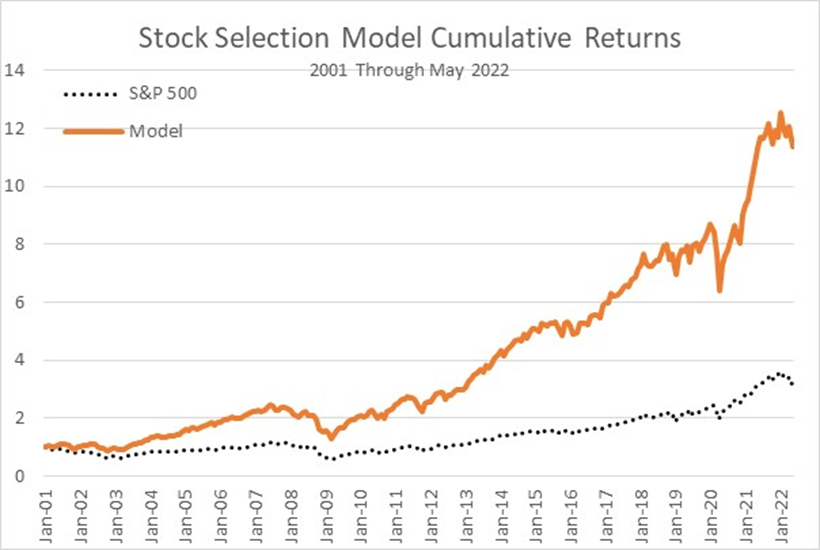
Note: Shows the cumulative return of the favored basket of 100 stocks from baseline 5-factor stock selection model (orange line) and the S&P 500 index (dotted black line). Basket of favored stocks is weighted using square root of market capitalization and rebalanced monthly. Period of analysis is from 2001 through May 2022. Transaction costs are not considered.
Fig. 6 below shows the performance during May of each of the 5 composite factors (value, quality, momentum, estimates and investment) that make up the stock selection model, along with the performance of the overall model. After outperforming the S&P 500 by nearly 3% during April, the model continued to outperform in May, beating the benchmark index by 2.41% (orange bar at right). Four of the five of the composite factors outperformed last month, with only momentum showing slight underperformance. The value, quality and estimates factors all outperformed the S&P 500 by over 1.5% during May.
Fig. 6 – Performance of Factors and Overall Model for May
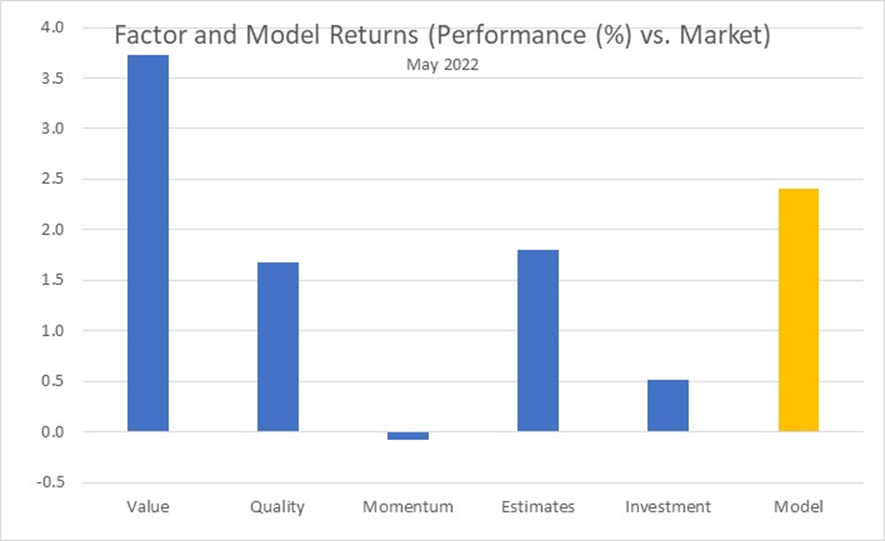
Note: Shows the performance for May 2022 for the top quintile of the five composite factors (value, quality, momentum, estimates and investment – blue bars) and for the overall model (orange bar). Baskets are weighted using square root of market capitalization. Universe is the S&P 500. Transaction costs are not considered.
Market Valuation: Residual Income Model
We use a residual income model to value the market[1]. The residual income model produces an estimate for the equity risk premium, or the additional return that equity investors are compensated over the risk-free rate. The history of the equity risk premium is shown in Fig. 7. At the end of May, the equity risk premium implied by the model was 3.5%. This falls within the recent historical range of 3-5%.
Fig. 7 – History of the Equity Risk Premium Implied by the Residual Income Model
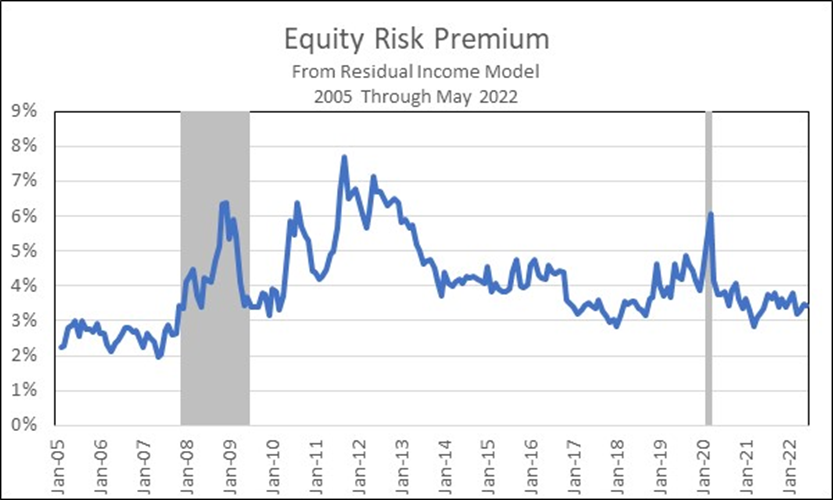
Note: Shows the equity risk premium implied by a residual income model. Gray shaded regions indicate recessions. Period of analysis is from January 2005 through May 2022.
We also use the equity risk premium to evaluate the relative attractiveness of equities compared to investment grade fixed income via the ratio of their yields. Historically, when equities are expensive compared to fixed income (i.e., equities have a relatively low yield) the stock market experiences smaller average returns and higher volatility over the subsequent quarter (see Fig. 8).
Fig. 8 – Equity Market Return and Volatility Conditioned on Yield Ratio
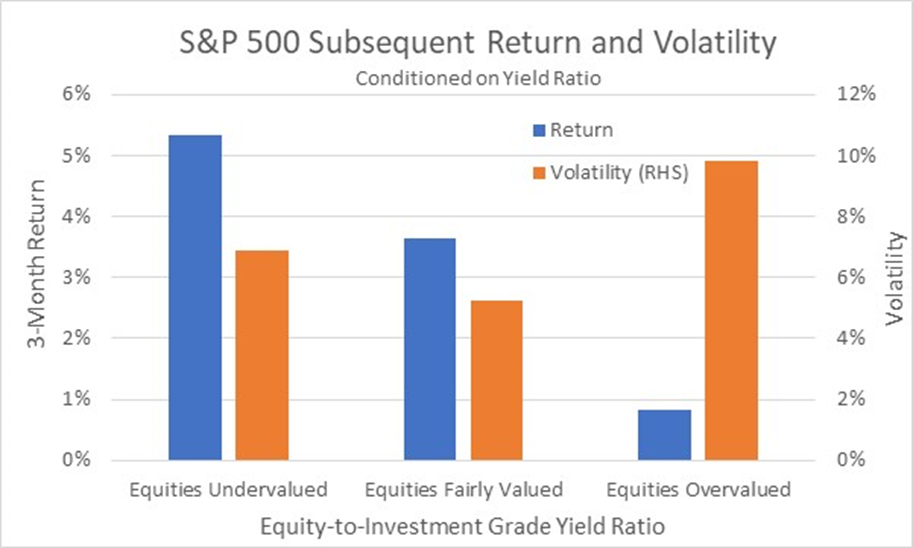
Note: Shows subsequent 3-month S&P 500 return (blue bars) and volatility (orange bars, right-hand axis) conditioned on the ratio of equity-to-investment grade yield. High (low) equity-to-investment grade yield is defined as the equity-to-investment grade yield being above (below) the 75th (25th) percentile observation using a rolling 60-month window. Medium equity-to-investment grade yield is when the equity-to-investment grade yield is between the 25th and 75th percentile observations, using a rolling 60-month window. Period of analysis is from January 2006 through May 2022. Transaction costs are not considered.
At the end of May, the yield ratio indicated that equities continued to be overvalued. Based on the above relationship, we continue to expect muted returns and higher equity market volatility over the next 3 months.
[1] See https://fsinsight.com/quantitative-strategy/2021/12/21/market-valuation/


