Elevated trade tensions between the U.S. and China continued to occupy investors’ attention last week. Sentiment, as measured by the American Association of Individual Investors (AAII) weekly survey, had previously begun to look at least slightly bullish, only to revert back to net bearish last week. Fundstrat Head of Technology Tom Lee and Head of Technical Strategy Mark Newton agree that this is good for stock investors. “I view this as contrarian positive,” Lee wrote, pointing out that “if conviction wavers easily, that is a sign that sentiment is not ebullient.”
Further supporting Lee’s bullish view for the final quarter of the year is the underperformance of active fund managers during the first three quarters of the year, with only 22% of them beating their benchmarks, according to data compiled by Jefferies. This represents some of the worst performance by this group in decades. That means “there’s pressure for funds to outperform into year end,” Lee observed. For underperforming managers to do that, they will likely need to move cash off the sidelines and put it to work, and that’s arguably constructive for the markets.
Small Caps
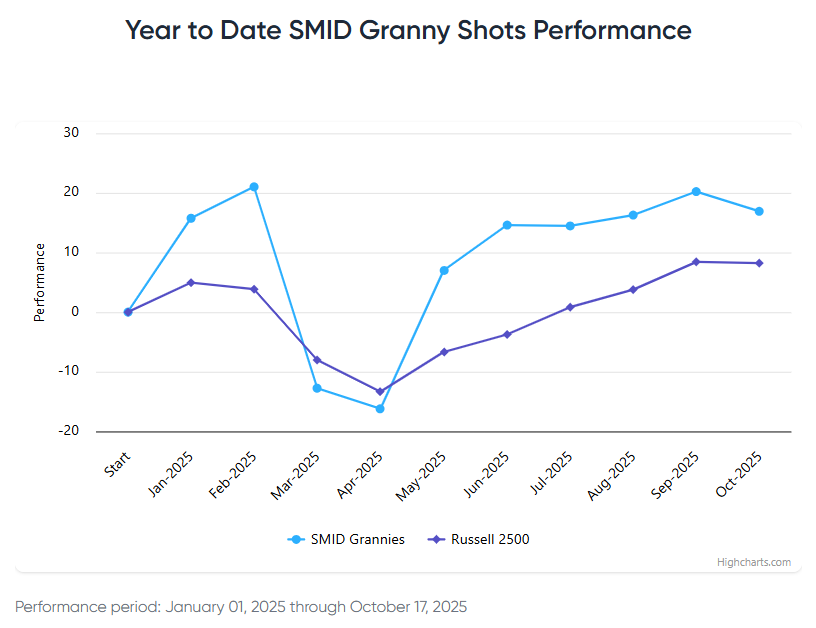
As followers of our work know, Lee has long been overweight small caps, seeing the sector as both undervalued and especially well-positioned to benefit from a Fed rate-cut cycle that now looks to have begun. Fed Chair Jerome Powell on Tuesday made remarks supportive of that thesis, reiterating the message that inflation remained largely under control while “downside risks to employment” had risen.
As Mark Newton observed at our weekly huddle last week, “small caps officially have broken out,” pushing through to new all-time highs on Wednesday before settling back slightly on Friday. As a sector, small caps (IWM 0.74% ) had a good week on an absolute basis, advancing 2.38% to close on Friday at 243.45. Yet the sector’s relative performance has been impressive as well. While small-caps have outperformed equal-weighted S&P 500 (RSP 0.52% ) for the last six months, as Newton observed, “what many people haven’t realized is that when you look at the larger ratios of IWM versus SPY, we’ve now broken out of the entire four-year downtrend since 2021.” On a month-to-date basis, small caps are now also outperforming both the S&P 500 and the Mag Seven.
To be sure, some of that outperformance has resulted from recent underperformance of Mag Seven stocks like Meta, Microsoft, and even Nvidia. Nevertheless, Newton views this week’s small-cap action as intermediate-term bullish. “I think this persists into the year-end,” he said. Aligning with Lee’s outlook on the sector, Newton said: “It’s right to be long small caps. It’s right to overweight small caps versus large caps.”
Chart of the Week
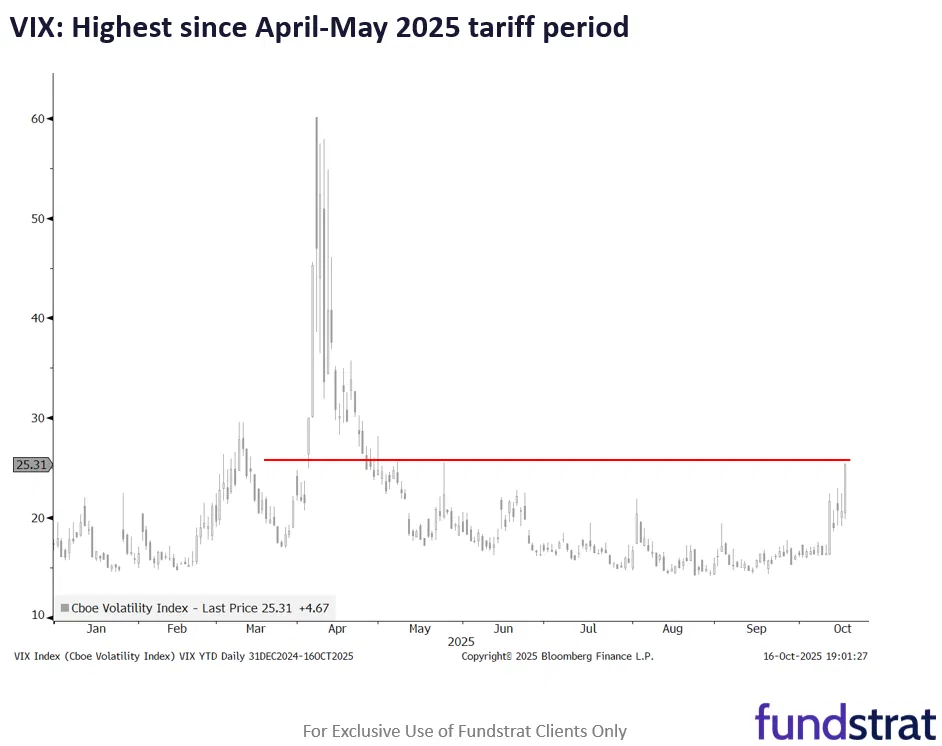
Volatility, which spiked after President Trump’s truculent response to China’s intensified rare-earth export restrictions, continued to rise this week as China reacted in turn. Worries over the state of U.S. credit markets after the collapses of First Brands and Tricolor also contributed to uncertainty As our Chart of the Week shows, VIX is now at its highest level since President Trump launched his tariff broadside in April and May – though still significantly lower than its springtime peak. Still, history shows that VIX surges greater than 30%, as we saw on Oct. 10, are often a sign of a local bottom, with media gains for the S&P 500 one month later at 2.8%. This week’s higher volatility does not change Lee’s view.
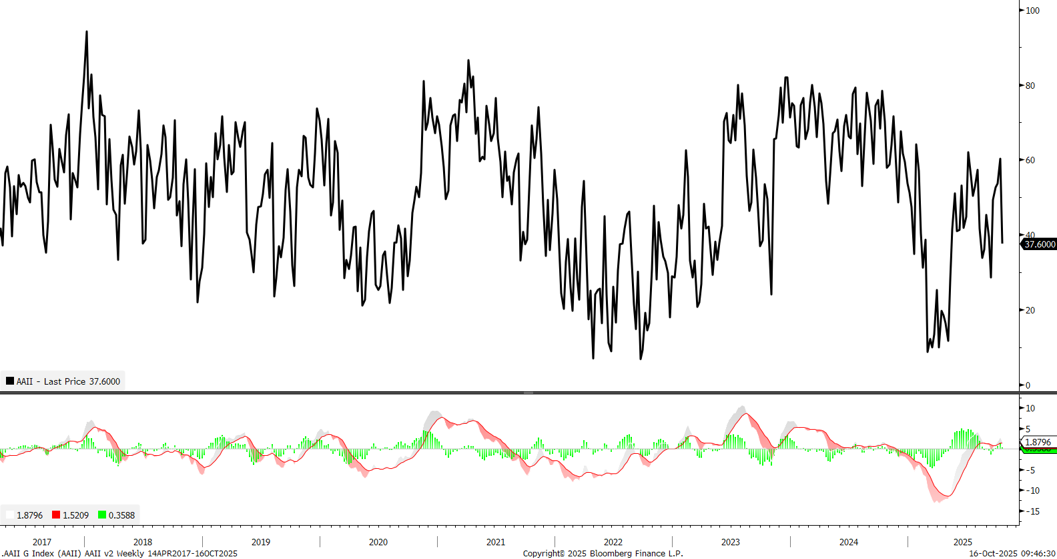
Today’s AAII sentiment data flipped back to bearish as the trade tension has caused both price action and sentiment to grow a bit skittish this week. Overall, this is a positive from a contrarian perspective as the Shutdown nor trade tension with China have not resulted in any break in the larger uptrend for SPX. As of now, AAII bears stand at 46.10% while Bulls are 33.70%. As can be seen, Sentiment is very much mid-range, not really extremely bullish nor bearish but did turn more mildly bearish last week, which is unusual after a 35% rally since April lows and more than 85% gains since 2022. However, this goes to show that the investing public remains very susceptible towards letting their own market sentiment be dictated by what’s happening in the news and media, geopolitics and politics, rather than concentrating on price trends, or earnings. This is generally a mistake. An interesting time indeed.
This research is for the clients of FS Insight only. FSI Subscription entitles the subscriber to 1 user, research cannot be shared or redistributed. For additional information, please contact your sales representative or FS Insight at fsinsight.com.
Conflicts of Interest
This research contains the views, opinions and recommendations of FS Insight. At the time of publication of this report, FS Insight does not know of, or have reason to know of any material conflicts of interest.
General Disclosures
FS Insight is an independent research company and is not a registered investment advisor and is not acting as a broker dealer under any federal or state securities laws.
FS Insight is a member of IRC Securities’ Research Prime Services Platform. IRC Securities is a FINRA registered broker-dealer that is focused on supporting the independent research industry. Certain personnel of FS Insight (i.e. Research Analysts) are registered representatives of IRC Securities, a FINRA member firm registered as a broker-dealer with the Securities and Exchange Commission and certain state securities regulators. As registered representatives and independent contractors of IRC Securities, such personnel may receive commissions paid to or shared with IRC Securities for transactions placed by FS Insight clients directly with IRC Securities or with securities firms that may share commissions with IRC Securities in accordance with applicable SEC and FINRA requirements. IRC Securities does not distribute the research of FS Insight, which is available to select institutional clients that have engaged FS Insight.
As registered representatives of IRC Securities our analysts must follow IRC Securities’ Written Supervisory Procedures. Notable compliance policies include (1) prohibition of insider trading or the facilitation thereof, (2) maintaining client confidentiality, (3) archival of electronic communications, and (4) appropriate use of electronic communications, amongst other compliance related policies.
FS Insight does not have the same conflicts that traditional sell-side research organizations have because FS Insight (1) does not conduct any investment banking activities, and (2) does not manage any investment funds.
This communication is issued by FS Insight and/or affiliates of FS Insight. This is not a personal recommendation, nor an offer to buy or sell nor a solicitation to buy or sell any securities, investment products or other financial instruments or services. This material is distributed for general informational and educational purposes only and is not intended to constitute legal, tax, accounting or investment advice.
The statements in this document shall not be considered as an objective or independent explanation of the matters. Please note that this document (a) has not been prepared in accordance with legal requirements designed to promote the independence of investment research, and (b) is not subject to any prohibition on dealing ahead of the dissemination or publication of investment research.
Intended for recipient only and not for further distribution without the consent of FS Insight.
This research is for the clients of FS Insight only. Additional information is available upon request. Information has been obtained from sources believed to be reliable, but FS Insight does not warrant its completeness or accuracy except with respect to any disclosures relative to FS Insight and the analyst’s involvement (if any) with any of the subject companies of the research. All pricing is as of the market close for the securities discussed, unless otherwise stated. Opinions and estimates constitute our judgment as of the date of this material and are subject to change without notice. Past performance is not indicative of future results. This material is not intended as an offer or solicitation for the purchase or sale of any financial instrument. The opinions and recommendations herein do not take into account individual client circumstances, risk tolerance, objectives, or needs and are not intended as recommendations of particular securities, financial instruments or strategies. The recipient of this report must make its own independent decision regarding any securities or financial instruments mentioned herein. Except in circumstances where FS Insight expressly agrees otherwise in writing, FS Insight is not acting as a municipal advisor and the opinions or views contained herein are not intended to be, and do not constitute, advice, including within the meaning of Section 15B of the Securities Exchange Act of 1934. All research reports are disseminated and available to all clients simultaneously through electronic publication to our internal client website, fsinsight.com. Not all research content is redistributed to our clients or made available to third-party aggregators or the media. Please contact your sales representative if you would like to receive any of our research publications.