For close to half a year, Fundstrat Head of Research Tom Lee has been referring to the V-shaped rally we’ve experienced since April as one of the “most hated” in his memory. Last week, we saw some evidence that the “hate” was subsiding ever-so-slightly (see our Chart of the Week below).
Then on Friday, U.S.-China trade tensions intensified, with President Trump’s unambiguous response to China’s latest decision to intensify export restrictions on rare-earth materials. This was followed by a significant dip in both the S&P 500 and Nasdaq Composite that led both indices to finish the week in the red. The S&P 500 suffered its biggest one-day decline since April 21.
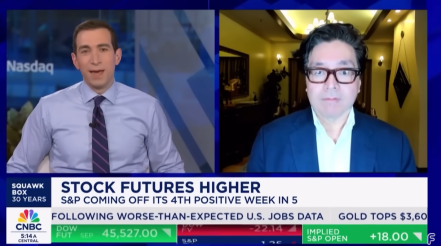
“I don’t want to be glib and say ‘hey this is nothing,'” Lee remarked on CNBC, but he remains largely unfazed. As he noted, the structural tailwinds that form the basis for his intermediate- and long-term constructivism are unlikely to be affected by a rare-earth dispute with China, and dips in 2025 have tended to be bought. Absent any structural change, Lee does not see why this time needs to be different. That doesn’t mean markets necessarily bottomed on Friday, but to Lee, “this pullback is a buying opportunity.”
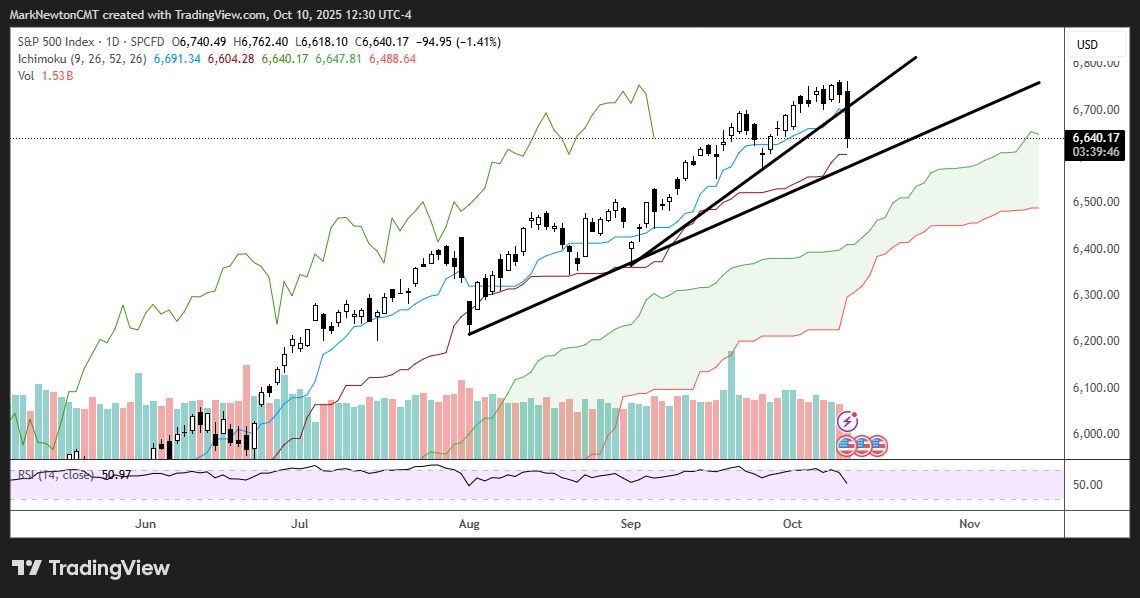
For his part, Head of Technical Strategy Mark Newton suggested the possibility that Friday’s break of 6569, which technically violates late September lows along with the ongoing uptrend, might signify that a Fall correction had gotten underway, though this is still unconfirmed at the moment. Even if so, however, “I believe that a pullback […] should be healthy for U.S. equities ahead of a further push higher into year-end,” he wrote.
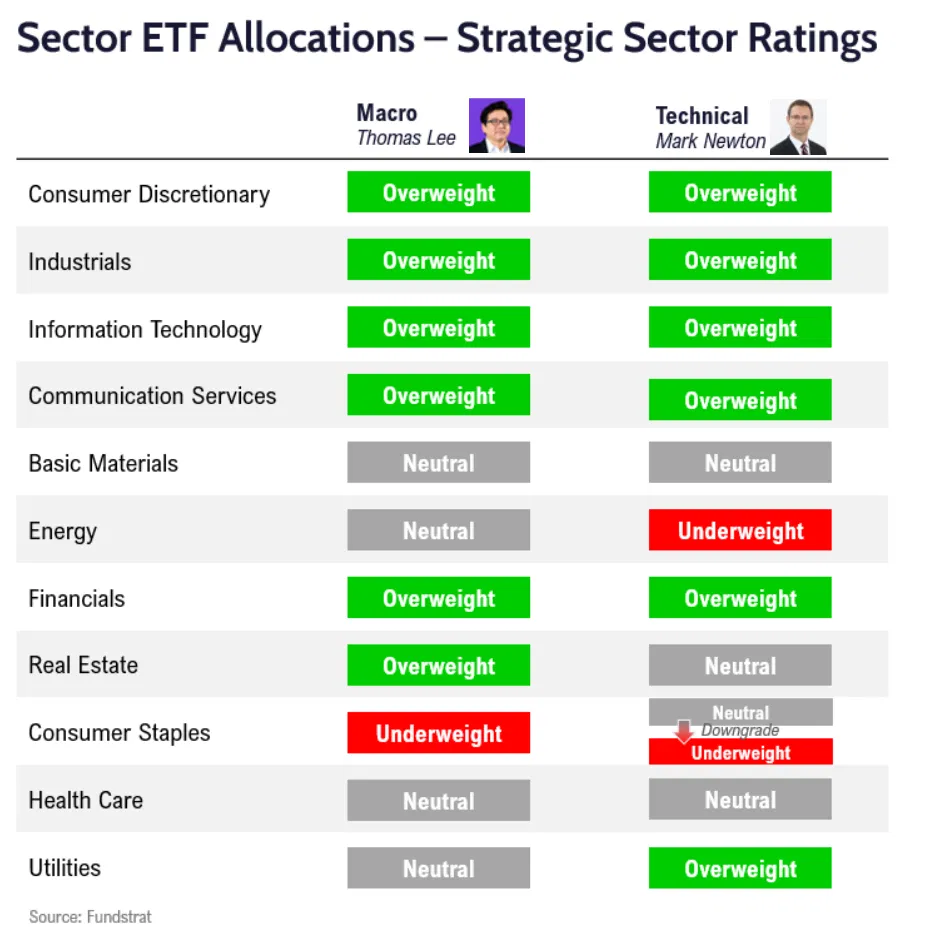
Sector Allocation Strategy
These are the latest strategic sector ratings from Head of Research Tom Lee and Head of Technical Strategy Mark Newton – part of the October 2025 update to the FSI Sector Allocation Strategy. FS Insight Macro and Pro subscribers can click here for ETF recommendations, precise guidance on strategic and tactical weightings, detailed commentary, and methodology.
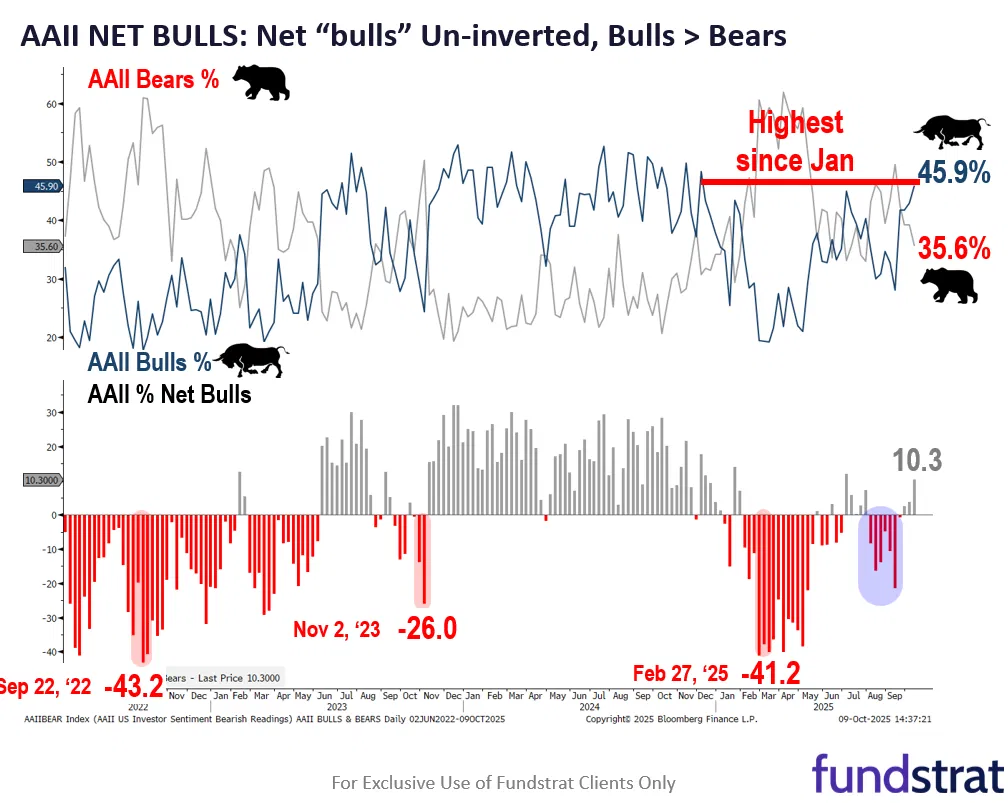
Chart of the Week
The latest American Association of Individual Investors (AAII) survey showed sentiment uninverting: The bullish reading rose to 45.9%, the highest since January, flipping the sentiment metric net bearish to net bullish (+10.3%). For those inclined toward contrarianism, however, Lee remarked, “I don’t see the flip to positive as that consequential.” As shown by our Chart of the Week, the extent of net bullishness is still at or below even levels seen for much of 2024, a year in which the S&P 500 rose 23%. In any case, the re-intensified trade tensions between the U.S. and China that emerged on Friday also call into question whether this uninversion will endure.
While it’s normally important not to pay attention to news events and headlines from the Administration until they result in tangible action, today’s comments regarding the trade deal souring with China have put the Trump/XI meeting in jeopardy. SPX broke 6700 and is currently lower by -1.5% as the violation of 6700 resulted in some quick acceleration lower by 80 points in the last 90 minutes. Treasury yields are plunging and the US Dollar has reversed lower today. Emerging markets are being particularly hard hit as China’s Large-cap ETF by Ishares, FXI -5.50% has plunged on heavy volume down to 38.87 from yesterday’s $40.51 close. (See last night’s Technical note for reasons why EEM might underperform in Q4) At this point, the main area to watch for ^SPX will occur near 6600 and then late September lows at 6569. This can’t be broken without suggesting a Fall correction is upon us. For now, this is early, and i do suspect that SPX stabilizes and turns higher next week. However, breadth and momentum have been waning in the last week and i do anticipate that upside should prove limited to 6800, while a break of 6569 would bring about a 5% drop into November.
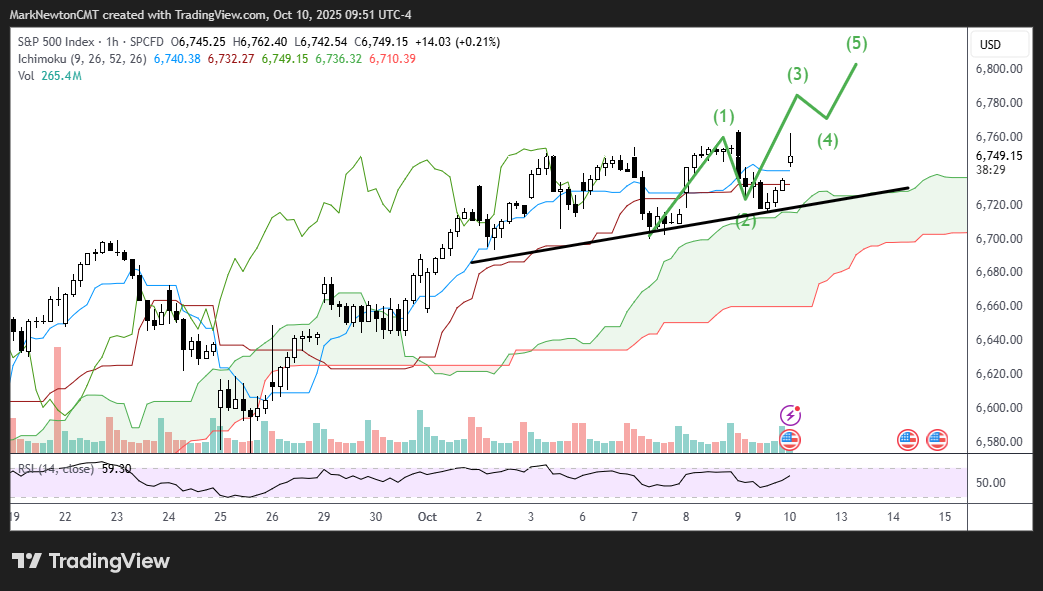
Near-term ^SPX pattern shows price having hit support near the hourly trend channel since early October and turning up today. This is a positive and should lead SPX to push higher up to 6790-6800 area. Furthermore, it’s likely that this trend pushes higher sharply today in a wave 3 type pattern before settling and then a 5 into next week, which could hit resistance. Key support lies at 6716 near yesterday’s lows. If this were to be broken, it would result in weakness, which isn’t expected right away.
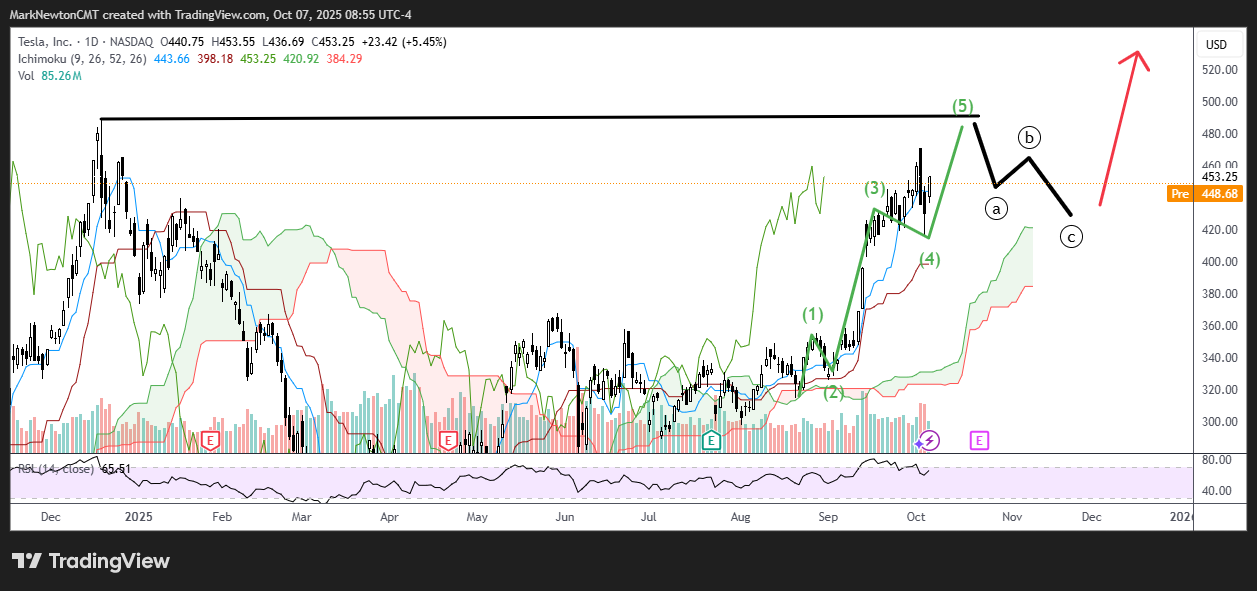
TSLA -5.34% has advanced nicely in recent weeks and yesterday’s rally likely paves the way for a coming challenge of $488 before some stalling out and possible consolidation into November. While i expect that TSLA likely will push up to potentially $600-$700 into January, i’m not yet expecting that this happens over the next month. At present, the potential Elliott-wave count is shown below and despite poor German sales, i anticipate TSLA to rise to challenge and exceed last Thursday’s peaks at $470.75 to near $488 before stalling in the short run. Overall, i remain quite bullish on TSLA and it’s right to be long technically, looking to buy dips if/when they arise over the next month.
This research is for the clients of FS Insight only. FSI Subscription entitles the subscriber to 1 user, research cannot be shared or redistributed. For additional information, please contact your sales representative or FS Insight at fsinsight.com.
Conflicts of Interest
This research contains the views, opinions and recommendations of FS Insight. At the time of publication of this report, FS Insight does not know of, or have reason to know of any material conflicts of interest.
General Disclosures
FS Insight is an independent research company and is not a registered investment advisor and is not acting as a broker dealer under any federal or state securities laws.
FS Insight is a member of IRC Securities’ Research Prime Services Platform. IRC Securities is a FINRA registered broker-dealer that is focused on supporting the independent research industry. Certain personnel of FS Insight (i.e. Research Analysts) are registered representatives of IRC Securities, a FINRA member firm registered as a broker-dealer with the Securities and Exchange Commission and certain state securities regulators. As registered representatives and independent contractors of IRC Securities, such personnel may receive commissions paid to or shared with IRC Securities for transactions placed by FS Insight clients directly with IRC Securities or with securities firms that may share commissions with IRC Securities in accordance with applicable SEC and FINRA requirements. IRC Securities does not distribute the research of FS Insight, which is available to select institutional clients that have engaged FS Insight.
As registered representatives of IRC Securities our analysts must follow IRC Securities’ Written Supervisory Procedures. Notable compliance policies include (1) prohibition of insider trading or the facilitation thereof, (2) maintaining client confidentiality, (3) archival of electronic communications, and (4) appropriate use of electronic communications, amongst other compliance related policies.
FS Insight does not have the same conflicts that traditional sell-side research organizations have because FS Insight (1) does not conduct any investment banking activities, and (2) does not manage any investment funds.
This communication is issued by FS Insight and/or affiliates of FS Insight. This is not a personal recommendation, nor an offer to buy or sell nor a solicitation to buy or sell any securities, investment products or other financial instruments or services. This material is distributed for general informational and educational purposes only and is not intended to constitute legal, tax, accounting or investment advice.
The statements in this document shall not be considered as an objective or independent explanation of the matters. Please note that this document (a) has not been prepared in accordance with legal requirements designed to promote the independence of investment research, and (b) is not subject to any prohibition on dealing ahead of the dissemination or publication of investment research.
Intended for recipient only and not for further distribution without the consent of FS Insight.
This research is for the clients of FS Insight only. Additional information is available upon request. Information has been obtained from sources believed to be reliable, but FS Insight does not warrant its completeness or accuracy except with respect to any disclosures relative to FS Insight and the analyst’s involvement (if any) with any of the subject companies of the research. All pricing is as of the market close for the securities discussed, unless otherwise stated. Opinions and estimates constitute our judgment as of the date of this material and are subject to change without notice. Past performance is not indicative of future results. This material is not intended as an offer or solicitation for the purchase or sale of any financial instrument. The opinions and recommendations herein do not take into account individual client circumstances, risk tolerance, objectives, or needs and are not intended as recommendations of particular securities, financial instruments or strategies. The recipient of this report must make its own independent decision regarding any securities or financial instruments mentioned herein. Except in circumstances where FS Insight expressly agrees otherwise in writing, FS Insight is not acting as a municipal advisor and the opinions or views contained herein are not intended to be, and do not constitute, advice, including within the meaning of Section 15B of the Securities Exchange Act of 1934. All research reports are disseminated and available to all clients simultaneously through electronic publication to our internal client website, fsinsight.com. Not all research content is redistributed to our clients or made available to third-party aggregators or the media. Please contact your sales representative if you would like to receive any of our research publications.