Click HERE to access the FSInsight COVID-19 Daily Chartbook.
We are shifting to a 4-day a week publication schedule:
- Monday
- Tuesday
- Wednesday
- SKIP THURSDAY
- Friday
STRATEGY: PEAK “growth scare” and now expect interest rates to push higher
Stocks have endured a tough few days which is not evident looking at indices. There has been a breadth deterioration and most easily seen by realizing only a few sectors are still in uptrends.
– Energy
– FAANG
– Technology
Everything else looks to be in a consolidation and/or downtrend. These few groups are really supporting the market.
And our central case has been for a choppy July with a possible selloff to S&P 500 falling to 4,100. While this is a possibility, we think there is a chance Thursday marked the peak of “growth scare” and if this is correct, equities might be shifting towards a broader risk on.

We sent out an INTRADAY WORD about the most important reversals we are watching possible:
– bottoming of US 10-year at 1.25%, touching 200D
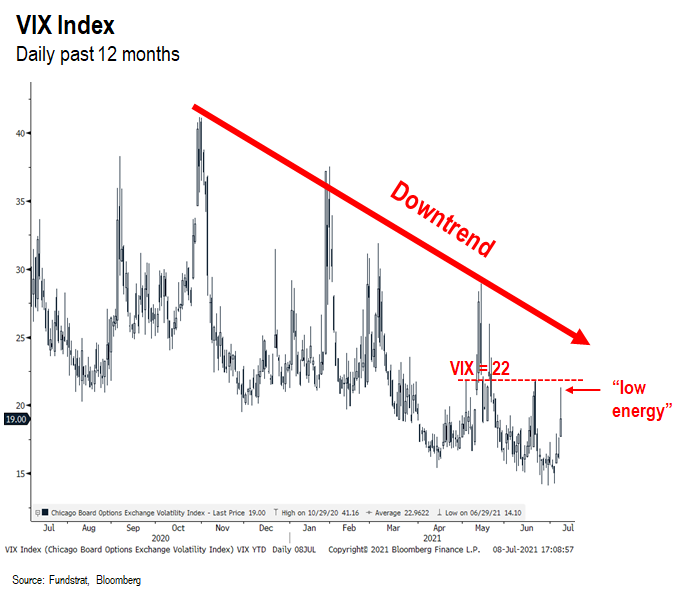
– VIX not mustering much upside oompf and making lower highs = risk-on
Thus, if these two conditions are correct, it would be appropriate to expect some major shifts in sector leadership. Specifically:
– S&P 500 might not fall to 4,100 as this might just be another rolling correction
– US 10-year will start drifting higher, possibly back to 1.75%
– Epicenter stocks will rally strongly, as they are the most sensitive to rising rates
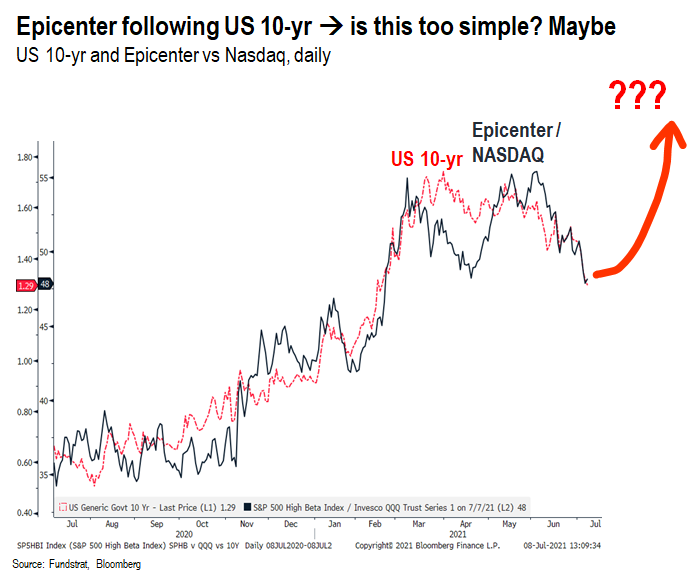
Take a look at this chart below. It’s the US 10-yr yield and price ratio Epicenter/ Nasdaq 100.
– since 10-year started falling
– Epicenter lagging badly
– Is this too simple? Maybe
I realize this could be early to make this call. And our conviction is 60%. But this is a reversal of our views on the market. So directionally it’s a big change.
…where are we wrong? Two things we are watching
The natural question is where will we be wrong?
– if US 10-year falls below 200D (1.25%), we reassess
– If VIX surges past prior high (22) we reassess
The technical picture per demark is not really decisive on rates or Vix. So we are in “no man’s land” from a technical perspective. This is what keeps our conviction lower. By the way, see our INTRADAY WORD for the rationale behind our change in interest rate views.
BACKGROUND: 3 factors drive interest change vs consensus…
We don’t explicitly forecast interest rates. However, logically, there are the 3 components (of interest rate change) influencing future rate changes for the US 10-year:
– GDP growth expectations –> if lower vs consensus –> rates downside
– Inflation expectations –> if lower vs consensus –> rates lower
– Interest rate “risk premia” (aka vol) –> if risk lower vs consensus –> rates downside
For the past few months, we have highlighted the fact that these factors were likely to cause the 10-year to undershoot. This the rationale for our downgrade of Financials on June 11th. And commensurately, our “double upgrade” of FAANG on June 11th. Basically, bet on FAANG if rates would undershoot.
BACKGROUND: we now think actual direction of interest rates “overshoots” consensus
We now think the next 50bp of interest rate change is higher. As explained below, going forward 3 components (of interest rate change):
– Growth expectations –> flat vs consensus –> FSInsight now sees “higher”
– Inflation expectations –> flat vs consensus –> FSInsight now sees “flat”
– Interest rate “risk premia” (aka vol) –> flat vs consensus –> FOMC took away “risk” by eliminating tail events
As you can see, we don’t see the “soft factors” pushing interest rates lower. Thus, we think the next move is higher in the US 10-year.

Similarly, a VIX above 22 would be a “higher high” — the VIX has been in a pronounced downtrend since October 2020 and as shown there have been successfully lower “highs”
– the last local high was 22
– if the VIX cannot muster a move above 22, then we think VIX is headed lower
= risk-on
ENERGY: Energy stocks undershooting Oil, which we see as a bullish divergence
Increasingly, the chorus of Energy bears has risen in recent weeks. The price declines have certainly added to the negativity (price dictates sentiment much of the time).
That said, Energy remains our highest conviction sector. Here are some of our high level thoughts:
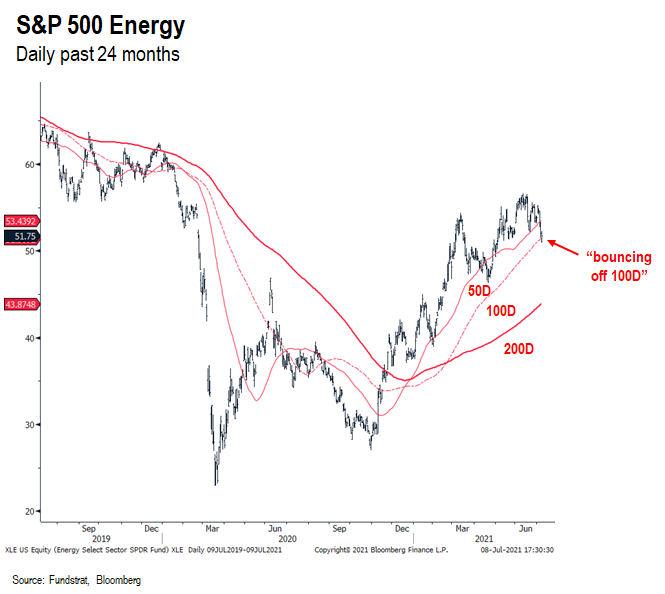
– Energy stocks (XLE 1.58% ETF as a proxy) is in an uptrend
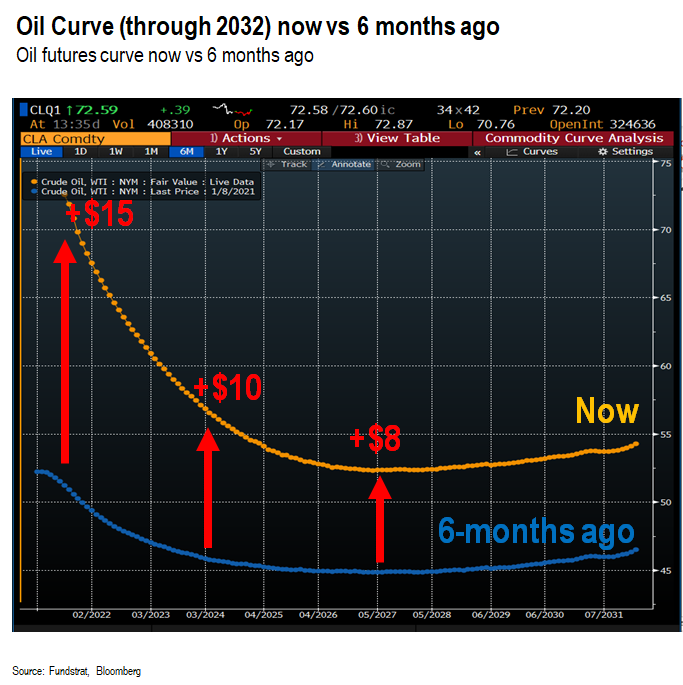
– Oil curve has moved up sharply since January from $8 to $15 across all maturities = bullish
– Oil services companies like SLB 2.02% are showing tremendous operating leverage = good for equities
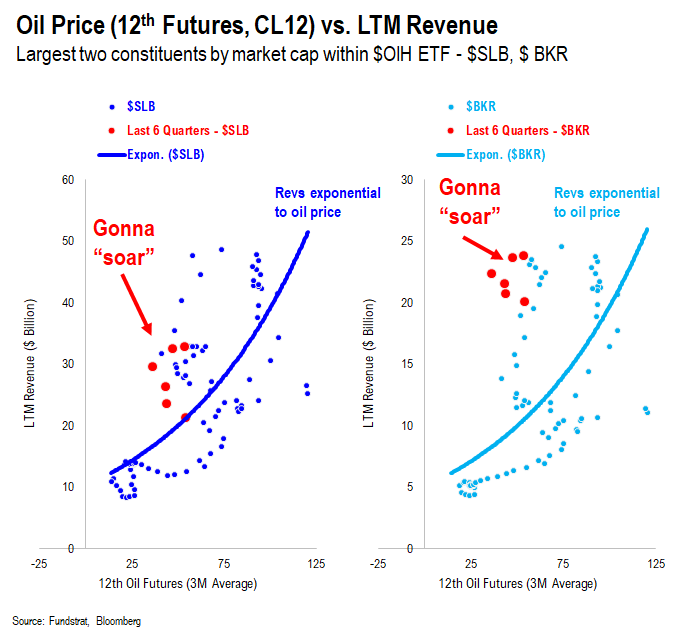
– Oil services revs are “exponential” versus rise in oil prices = upside to 2022 forecasts
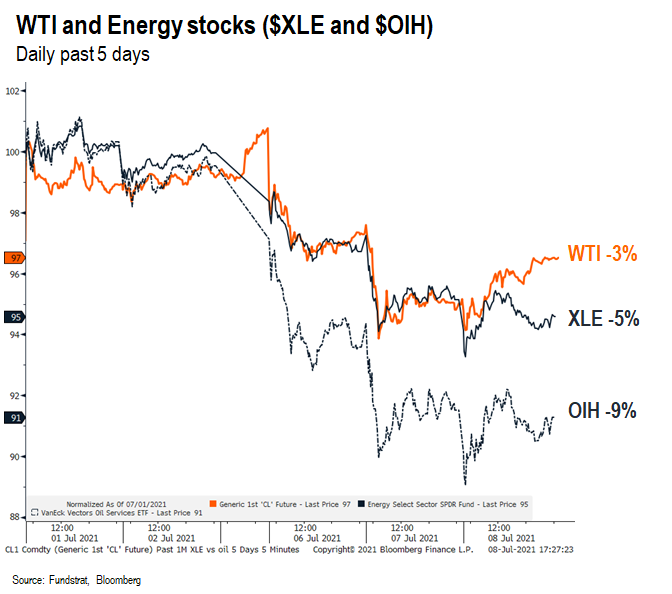
– Energy stocks diverged from oil in past week, oil basically flattish while Energy stocks down big
– This is even more true since 2019, Oil +14% while Energy stocks down -14%
As you can see below, Energy stocks, represented by XLE 1.58% , are bouncing off the 100D moving average.
– this is a place to expect a reversal
– and a place where a deep enough correction has been met
…Oil prices have risen across the curve since start of year = it’s not “temporary”
Also look at oil futures across all maturities through 2031, or 10 years ahead.
– since start of year, the prices have moved up +$8 to +$15 across the curve
– supply will get even tighter into 2022 as the $300 billion in shortfall in capex past 24 months robs future production capacity
…Oilfield Services revenues rise exponentially with a rise in oil prices
It is worth remembering that revenues for oilfield services companies rise exponentially with oil prices. Take a look at SLB 2.02% and BKR 2.95% , the two largest stocks in OIH. As you can see, there is an exponential rise in revs. There is a lag of course:
– but if WTI reaches mid-$80s
– revs will be far higher than consensus forecasts
– upside to stocks
…SLB and BKR are already generating higher EBITDA margins on lower revs
And evidence of the operating leverage is below as EBITDA margins are already set to exceed 2019 levels, even with lower revenues. This is the operating leverage story seen time and again across many Epicenter industries:
– operating leverage
– plus topline surprise
= positive surprise for stocks

Last 5 days, energy stocks over-reacting downside versus moves in oil
The last 5 days, WTI has barely moved, down 3% versus a week ago. Yet:
– XLE 1.58% is down 5%
– OIH is down 9%
Overreaction? Yes, especially considering this came when interest rates were falling and thus, coming on the heels of a growth scare. See our INTRADAY WORD from Thursday to get full context why we think the growth scare might be ending.
…past 2 years, WTI outperformed Energy stocks
And compared to the last 2 years, WTI is now above pre-pandemic levels.
– WTI +12%
– XLE 1.58% -14%
– OIH -22%
If someone suggests this is because Energy stocks know something, this is a possibility. However, we know few investors who actually own these stocks. Thus, the bigger issue, in our view, is Energy is not widely held. Thus, investors are finding more “excuses” to do little work and maintain little exposure. This is what we think is the positive surprise potential for Energy stocks.

BOTTOM LINE: If interest rates REVERSE, BUY Epicenter which is gonna rally MOST
July is shaping up to be a choppy month. But going forward, we see strong 2H gains. Given the shift in our interest rate view, we now think this leads to a rally in the Epicenter stocks. As below shows:
– US 10-yr interest level leads Epicenter stocks
– Price ratio: Epicenter / NASDAQ (SPHB/QQQ 0.64% )
MEANING: higher 10-yr = surge in Epicenter
– Energy remains our favorite sector, given the positive supply/demand dynamics in oil
– Epicenter stocks lead if interest rates flatten/rise
– FAANG still works even if interest rates backup due to “catch-up” trade
Is this too simple? Maybe. But it surely seems to be at work since the pandemic started. We would be aggressively buying Epicenter here. We realize the 10-yr might not bottom for 5-10 days. But this is tactically the time to be leaning into view of higher rates = buy Epicenter.
ADDENDUM: We are attaching the stock lists for our 3 portfolios:
We get several requests to give the updated list for our stock portfolios. We are including the links here:
– Granny Shots –> core stocks, based on 6 thematic/tactical portfolios
– Trifecta epicenter –> based on the convergence of Quant (tireless Ken), Rauscher (Global strategy), Technicals
– Violence in USA –> companies that are involved in some aspect of home or personal security. We are not “recommending” these stocks, but rather, bringing these stocks to your attention.
Granny Shots:
Full stock list here –> Click here
Trifecta Epicenter (*):
Full stock list here –> Click here
Power Epicenter Trifecta 35 (*):
Full stock list here –> Click here
Violence in USA:
Full stock list here –> Click here
(*) Please note that the stocks rated OW on this list meet the requirements of our investment theme as of the publication date. We do not monitor this list day by day. A stock taken off this list means it no longer meets our investment criteria, but not necessarily that it is neutral rated or should be sold. Please consult your financial advisor to discuss your risk tolerance and other factors that characterize your unique investment profile.
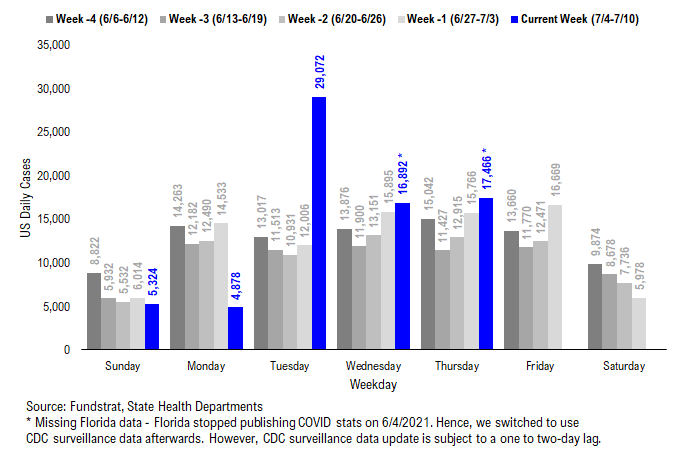
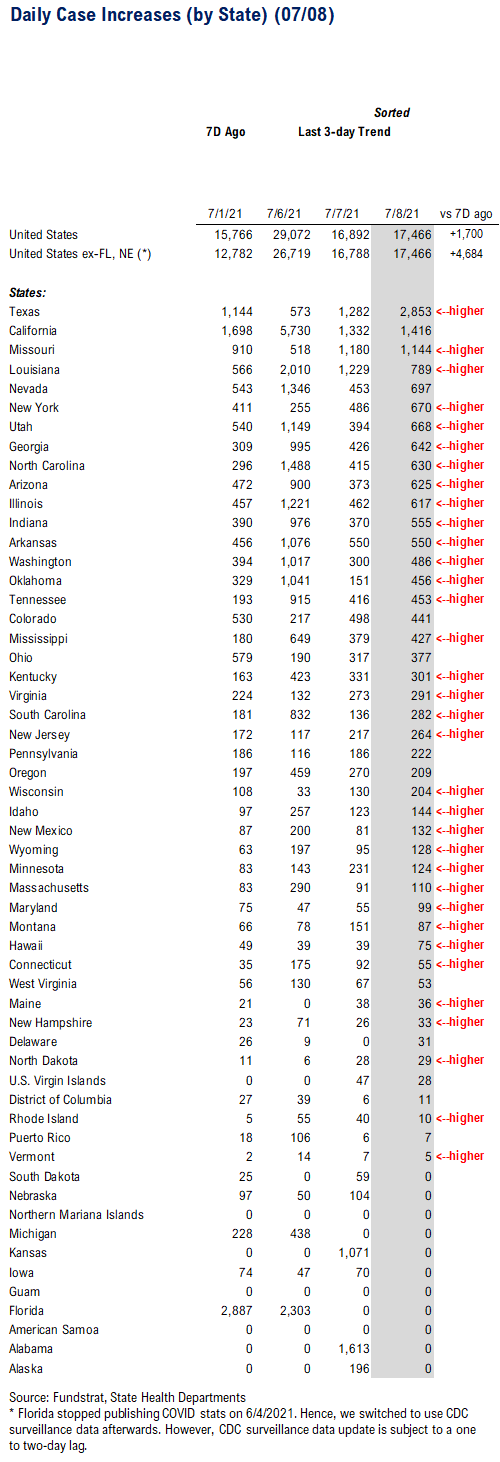
POINT 1: Daily COVID-19 cases 17,466, up +4,684 (ex-FL&NE) vs 7D ago…7D delta has been gradually rising…
_____________________________
Current Trends — COVID-19 cases:
– Daily cases 17,466 vs 15,766 7D ago, up +1,700
– Daily cases ex-FL&NE 17,466 vs 12,782 7D ago, up +4,684
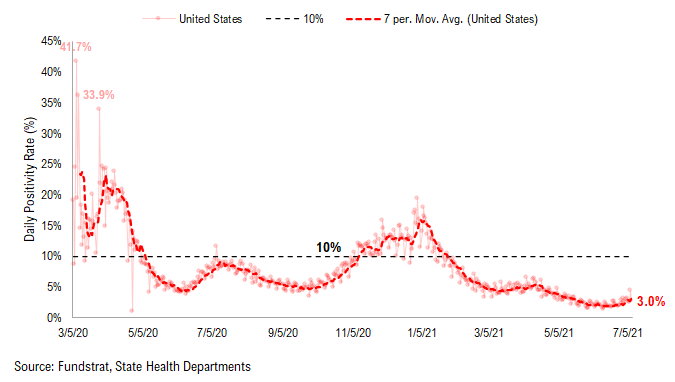
– 7D positivity rate 3.0% vs 2.3% 7D ago
– Hospitalized patients 15,429, up +8.6% vs 7D ago
– Daily deaths 204, down -22% vs 7D ago
_____________________________
*** Florida and Nebraska stopped publishing daily COVID stats updates on 6/4 and 6/30, respectively. We switched to use CDC surveillance data as the substitute. However, as CDC surveillance data is subject to a one to two-day lag, we added a “US ex-FL&NE” in our daily cases and 7D delta sections in order to demonstrate a more comparable COVID development.
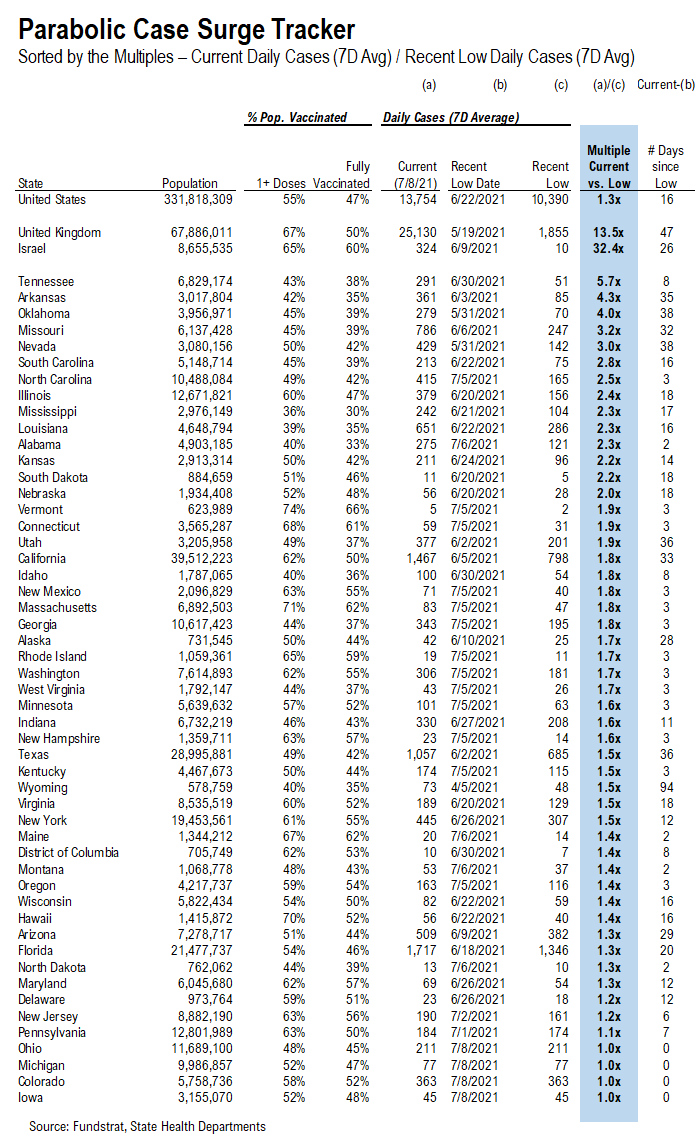
The latest COVID-19 daily cases came in at 17,466, up +4,684 (ex-FL&NE) vs 7D ago. There is no doubt that the number of daily cases has been rising recently even though the under-reporting during the long weekend could still impact the data quality. So far, we have not seen the parabolic surge in daily cases, but it is too early to conclude that US will or will not see a parabolic rise. At state-level, as shown in the “Parabolic Tracker” below, TN, AR, OK, MO and NV are the ones with largest increase in daily cases compared to their recent low. Hence, the COVID developments in these states bear watching. In fact, those states also have relatively lower vaccine penetration.
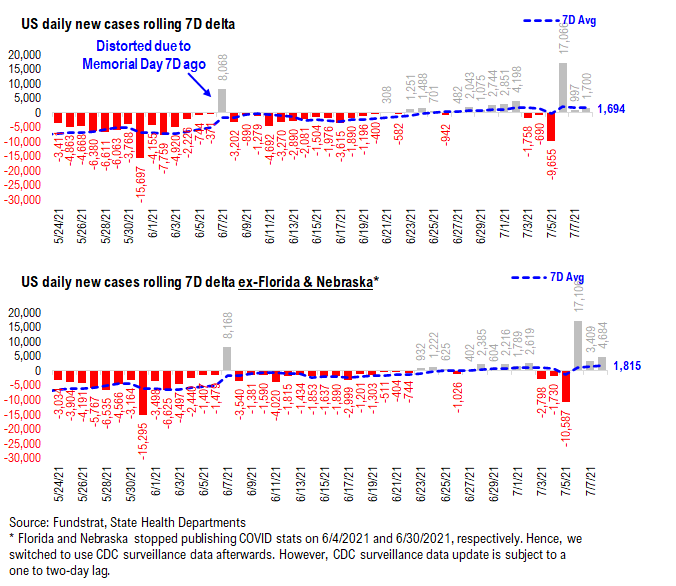
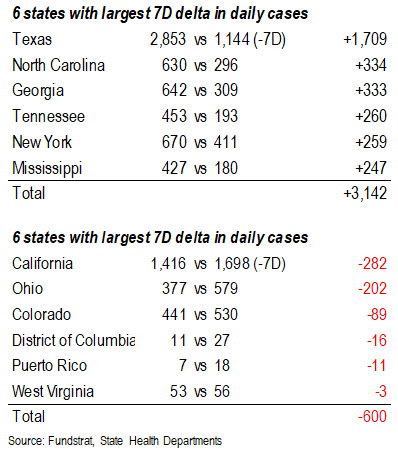
7D delta in daily cases has been slowly rising, but not parabolically…
As shown in the chart below, the 7D delta has been distorted signification due to Independence Day. The 7D avg (blue dash line) provides us with a better view of the trend. Overall, the 7D delta has been gradually rising over the past two weeks. But the good news is the rise is more “linear” and less” parabolic.” However, it is still too early to conclude that the US will or will not see a parabolic surge in daily cases. We will be closely watching the relevant data.
New case surge tracker in order to identify the states that seen largest case surge recently.
Below, we added a new section called “Parabolic Case Surge Tracker” to monitor the possible parabolic surge in daily case figures. In the table, we included both the vaccine penetration and the recent case trend for 50 US states + DC. The table is sorted by the multiple of their current daily cases divided by their recent low daily cases.
– The states with higher ranks are the states that have seen a more significant rise in daily cases.
– The states with multiple 1.0x are the states that sill see the case figures falling.
– US as a whole, UK and Israel are also shown at the top as a reference.
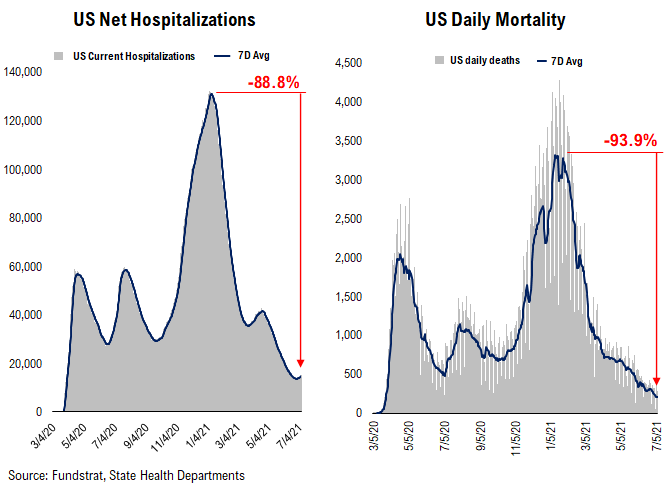
Current hospitalization and positivity rate are gradually ticking up while daily deaths remain falling…
Below we show the aggregate number of patients hospitalized due to COVID, daily mortality associated with COVID, and the daily positivity rate for COVID. As you can see, all three metrics are at their all-time lows since the start of the pandemic. However, current hospitalization and positivity rate have been gradually creeping upwards recently, while daily deaths remain on a downtrend.
POINT 2: VACCINE: Similar to case data, the vaccine data is also distorted due to the holiday.
_____________________________
Current Trends — Vaccinations:
– avg 0.6 million this past week vs 1.1 million last week
– overall, 47.3% fully vaccinated, 54.8% 1-dose+ received
_____________________________
Vaccination frontier update –> all states now near or above 70% combined penetration (vaccines + infections)
Below we sorted the states by the combined penetration (vaccinations + infections). As we commented in the past, the key figure is the combined value >60%, which is presumably near herd immunity. We have overlaid our case progress with that of Israel several times to demonstrate what should happen to cases once immunity reaches a certain critical level in the population. That is, the combined value of infections + vaccinations as % population > 60%. The persistent and rapid decline in cases suggest that the US is following a similar path to Israel (see our prior notes) while nations with less penetration continue to struggle more.
– Currently, all states are near or above 70% combined penetration
– RI, SD, MA, ND, CT, NJ, DE, NY, IL, UT, MN, NM, NE, AZ, PA are now above 90% combined penetration (vaccines + infections)
– So gradually, the US is getting to that threshold of presumable herd immunity. So long as a vaccine resistant variant doesn’t spread widely, the continued retreat of cases should continue.

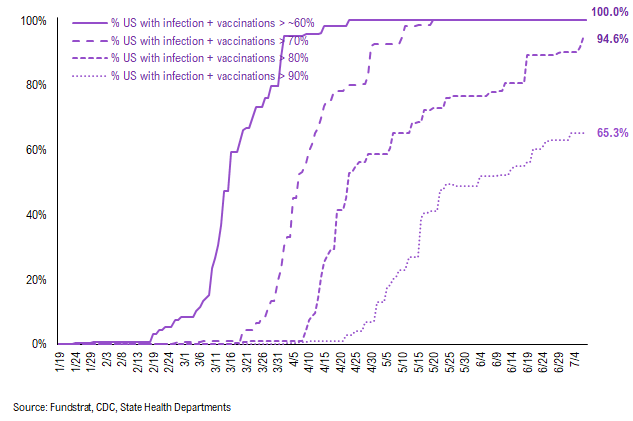
Below is a diffusion chart that shows the % of US states (based on state population) that have reached the combined penetration >60%/70%/80%/90%. As you can see, all states have reached 60% and 70% combined vaccination + infection. 94.6% of US states (based on state population) have seen combined infection & vaccination >80% and 65.3% of US states have seen combined infection & vaccination >90%.
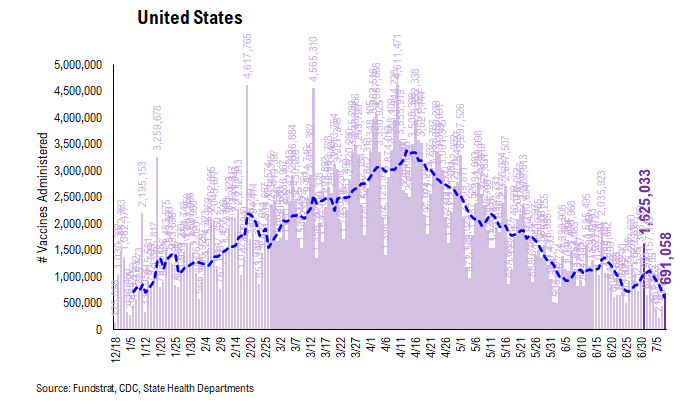
There were a total of 691,058 doses administered reported on Thursday. Over the past 7 days, 595,576 doses were administered per day on average, down 44% from 7D ago. The number of vaccines administered seems to be under-reported again due to the holiday effect. Therefore, the data should start to catch up in the next few days as part of “true-up”. As we wrote previously, the spread of Delta variant across the country could incent more people to seek getting vaccinated. And the recent data (as shown below) seems to suggest that.
97.1% of the US has seen 1-dose penetration >40%…
To better illustrate the actual footprint of the US vaccination effort, we have a time series showing the percent of the US with at least 45%/45%/50% of its residents fully vaccinated, displayed as the orange line on the chart. Currently, 83.0% of US states have seen 40% of their residents fully vaccinated. However, when looking at the percentage of the US with at least 45% of its residents fully vaccinated, this figure is 63.1%. And only 44.5% of US (by state population) have seen 50% of its residents fully vaccinated.
– While 97.1% of US states have seen vaccine penetration >40%, 87.5% of them have seen 1 dose penetration >45% and 63.0% of them have seen 1 dose penetration > 50%.
– 83.0% of the US has at least 40% of its residents fully vaccinated, However, only 63.1% of US has fully vaccinated >45% and 44.5% of US has fully vaccinated >50%.

This is the state by state data below, showing information for individuals with one dose and two doses.

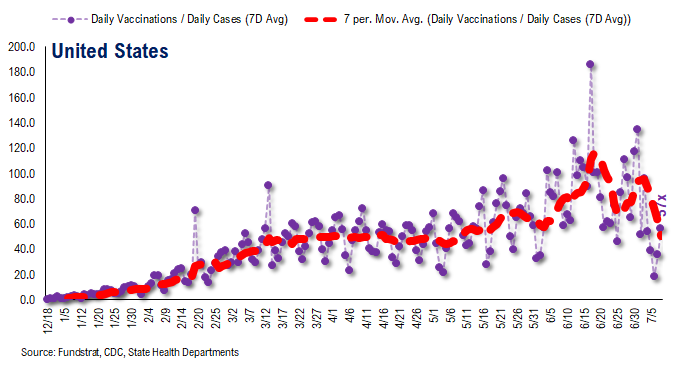
The ratio of vaccinations/ daily confirmed cases is generally trending higher (red line is 7D moving avg).
– the 7D moving average is about ~60 for the past few days
– this means 80 vaccines dosed for every 1 confirmed case
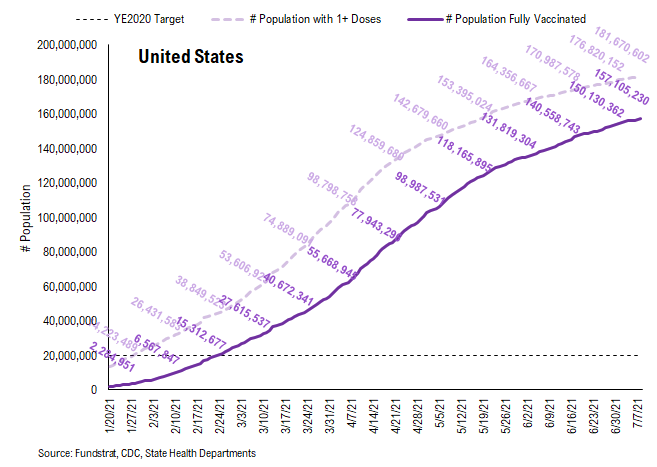
In total, 331 million vaccine doses have been administered across the country. Specifically, 182 million Americans (55% of US population) have received at least 1 dose of the vaccine. And 157 million Americans (47% of US population) are fully vaccinated.
POINT 3: Tracking restrictions lifting and subsequent effects in individual states
Point #3 focuses primarily on tracking the lifting of restrictions, as states have eased the majority of mandates. Keep in mind, easing/lifting restrictions are contingent upon state of emergency ordinances being renewed.
– States in groups 1 and 2 represent states that let their emergency ordinances expire, or that never had one in the first place
– Note: IL and HI are not listed. This is because restrictions lifting is determined at the county / island level, and no statewide policy will be established to lift restrictions until a full reopening
So there is a spectrum of approaches. Our team is listing 3 tiers of states and these are shown below.
– states that eased all restrictions in 2020: AK, OK, MO, FL, TN
– states that have eased all restrictions in 2021 to now: ND, SD, NE, ID, IA, MT, MS, AZ, SC, WY, TX, GA, AR, KS, WI, IN, AL, UT, NH, LA, NJ, KY, MN, MA, VT, OH, WV, ME, MI, NY, OR, PA, MD, DE
– states that are still easing restrictions in 2021: WA, NC, CA, NM, CO, NV, CT, VA, RI, DC
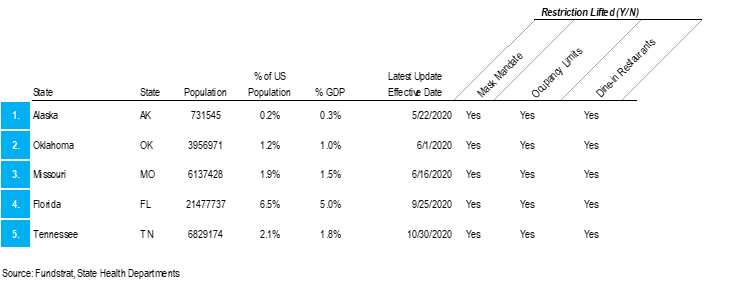
GROUP 1: States that lifted restrictions in 2020…
The daily case trends in these states are impressive and it is difficult to say that lifting restrictions has actually caused a new wave of cases because the case trends in these states look like other states.

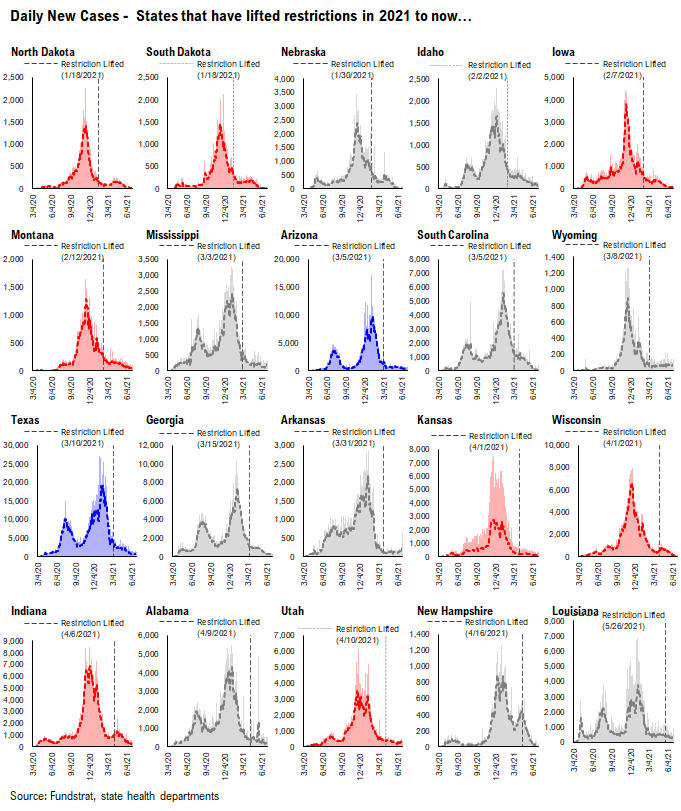
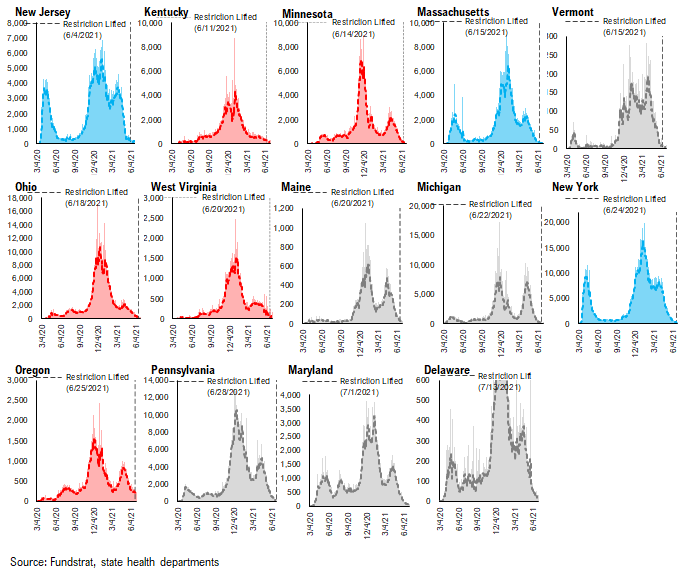
GROUP 2: States that have lifted restrictions in 2021 to now…
Similar to the list of states above, the daily case trends in these states are impressive and it seems that lifting restrictions hasn’t caused an increase in cases.

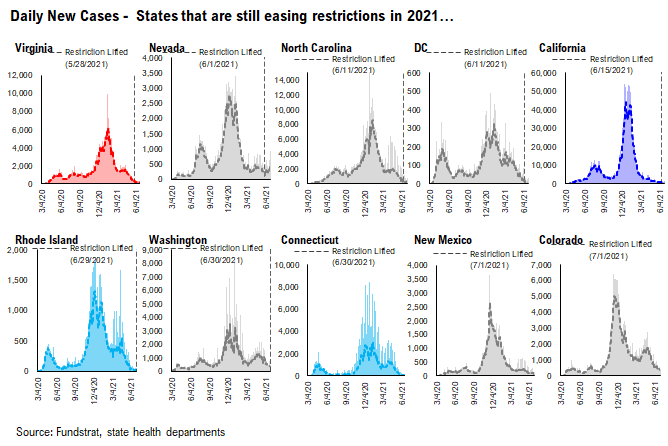
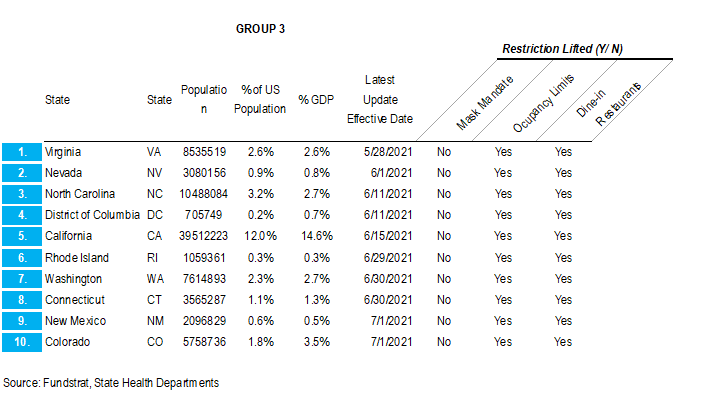
GROUP 3: States that are still easing restrictions in 2021…
These states have begun to lift restrictions, but have yet to ease all restrictions. The date of each state’s most recent restrictions lifting is indicated on each chart. The case trends in these states have been mostly positive.
– Easing restrictions appears to have contributed to an increase in cases in several of these states, most drastically in OR, ME, WA, and MN