Click HERE to access the FSInsight COVID-19 Daily Chartbook.
We are shifting to a 4-day a week publication schedule:
- Monday
- Tuesday
- Wednesday
- SKIP THURSDAY
- Friday NO REPORT (getting vaccine shot #2)
I want to give our clients a heads up. I am getting my second COVID-19 vaccine shot on Thursday (Moderna) and I have been told there are some side effects. Thus, I am not planning to publish our report this coming Friday.
STRATEGY: Investors bearish positioned on the cyclical recovery (contra-signal). IWM, Small-cap ETF and KRE, regional banks, are top 3 most shorted ETFs today.
___________________
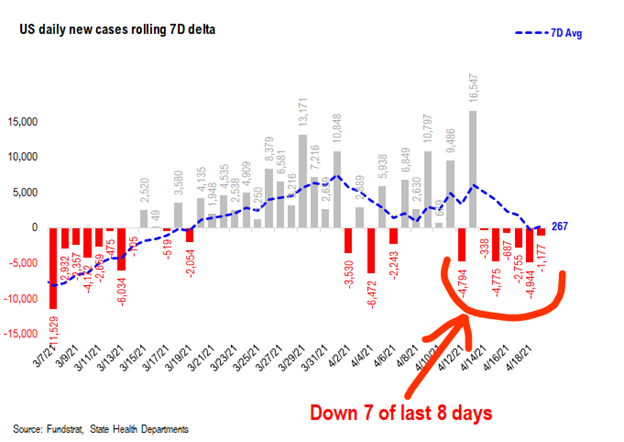
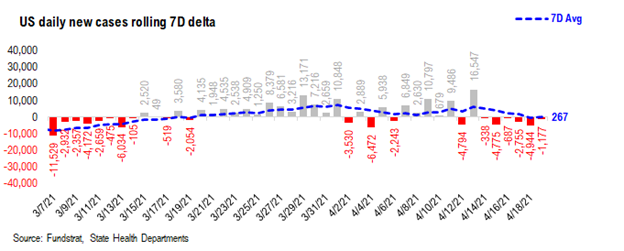
COVID-19 TRENDS: US cases finally rolling to the downside down 7 of last 8 days (vs 7D ago), and MI even looks like it is plateauing…
__________________
While equity indices have advanced for the past few weeks, it has masked a deterioration of the cyclical sectors in the equity market, best evidenced by the weakness in small-caps (IWM), Energy (XLE) despite higher oil and even the pullback of cruise lines and other epicenter stocks. This is the “signal” coming from the market — that is, the price performance of Epicenter aka cyclicals has been terrible.
Within this timeframe, we have seen a “stalling of progress” in COVID-19 trends and it strikes as central to why financial markets have become “stalled” around Epicenter stocks. In simplistic terms:
– COVID-19 case trends in the US stalled, raising fears of mutations leading to a new wave
– US cyclical equities stalled in past few weeks, despite index gains, raising fears that “easy money” has been made
While investors correctly view the performance of an individual stock as driven by the company’s fundamentals, valuation and risk premia are determined by financial markets. And for financial markets, in my opinion, the most important factor is the trend in COVID-19 cases in the US.
In fact, one could even suggest the trend in COVID-19 cases is the most important factor in nearly every major decision today — true whether one is a policymaker, citizen or investor. How one plans or views the next 12 months is based upon a view on the risk of another dangerous wave of COVID-19 cases (possibly from a new variant). Thus, we can’t really talk about financial markets without having some scenarios and framework around COVID-19.
…our 3 most “non-consensus” views are key to our outlook
I thought I would start with a review of where our views are most “non-consensus”, based upon either our having more conviction on something or believing a different outcome is likely, the following three are our most variant views:
– US vaccine penetration likely to drive a steep plunge in COVID-19 cases over next few weeks
– economic path of nations is now bifurcating, based on vaccine penetration, US, UK, Israel, China outperforming Rest of World
– Oil prices are rising, sending a strong reflationary signal, and could reach $80 by Summer
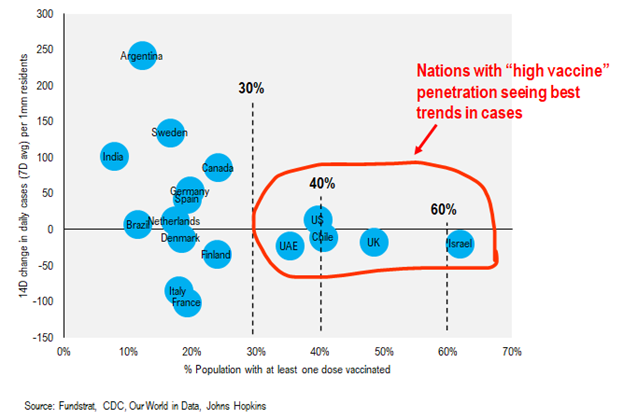
“high vaccine” penetration nations seeing far better COVID-19 trends…
The chart below is a scatter chart, showing vaccine penetration (x-axis) and the 14D change in case trends (y-axis). As we highlight below, countries where 40% or more of the population is vaccinated have seen 14D case trends declining. That is not the case for nations with lower vaccine penetration.
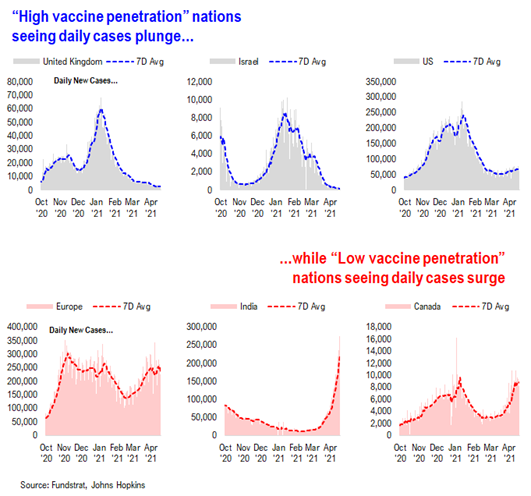
It might be easier to visualize below looking at 6 nations:
– 3 with high vaccine penetration –> UK, Israel and USA
– 3 with low vaccine penetration –> Europe, India and Canada
This perspective is important as we consider situations like Europe, India and even Latin America. On the first order, clearly, we would all like to see COVID-19 contained and retreat across the World at a consistent pace. But this is not the reality.
As for second order effects:
– recall, Dr. Fauci said the Europe surge in cases was alarming, as he expects the US to follow the case trends of Europe
– however, that is not the case. The US has in fact seen a slowdown in case growth even as Europe has seen a surge
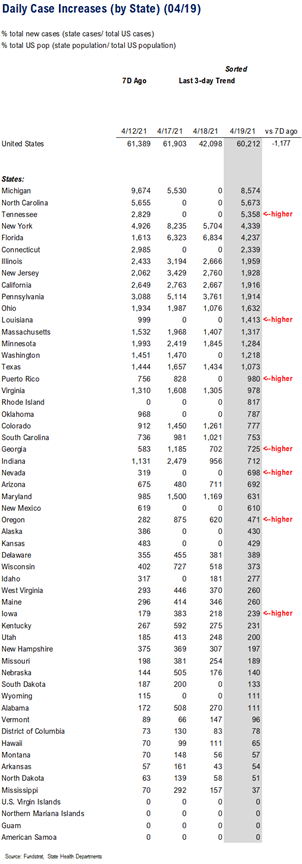
As this relates to the US, notice the steady and stealthily improving case trends (7D change). Even with cases soaring in MI, USA overall cases are rolling over. The 7D delta was negative in 7 of the last 8 days.
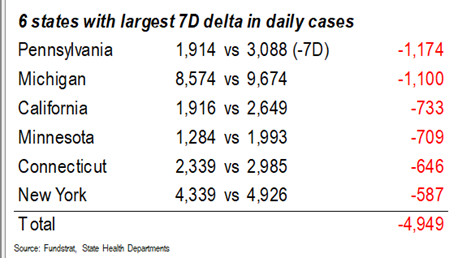
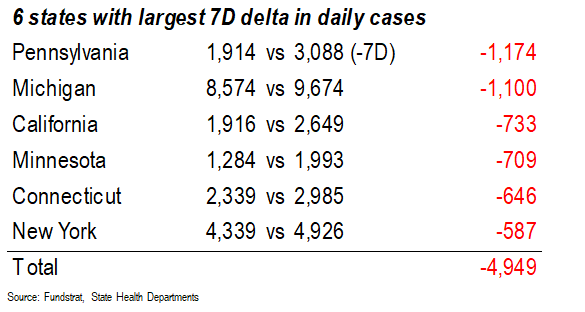
In fact, perhaps Michigan is finally seeing a plateau in cases as well. As shown below, daily cases were down -1,100 vs 7D ago. One day is not a trend, but it is a positive development, nonetheless.
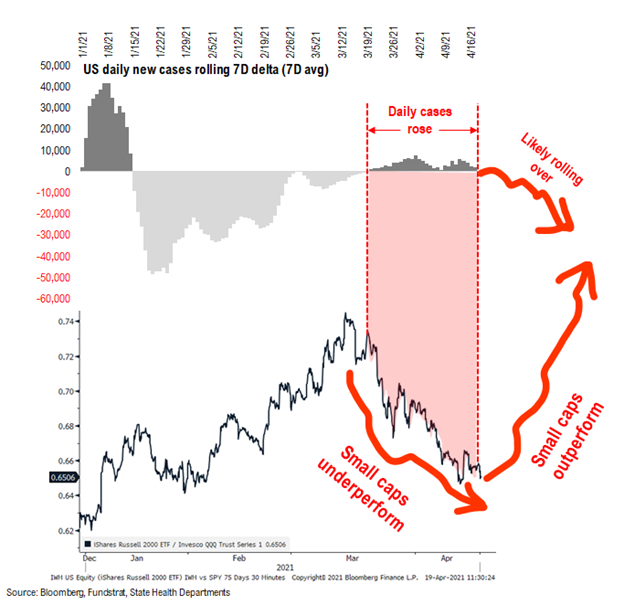
And the 7D delta of US COVID-19 cases is influential on the relative performance of small-cap stocks. As shown below, when the 7D delta turned positive in mid-March, this coincided with the plateauing of small-caps relative to S&P 500 (IWM vs SPY). But if daily cases are about to roll over, this could lead to a positive reversal for small-caps (outperforming SPY).
– in other words, if 7D cases rollover, this would bode well for Epicenter stocks
– best proxies for Epicenter are the Russell 2000 (IWM ETF) and even the S&P 500 High Beta Index (SPHB ETF)
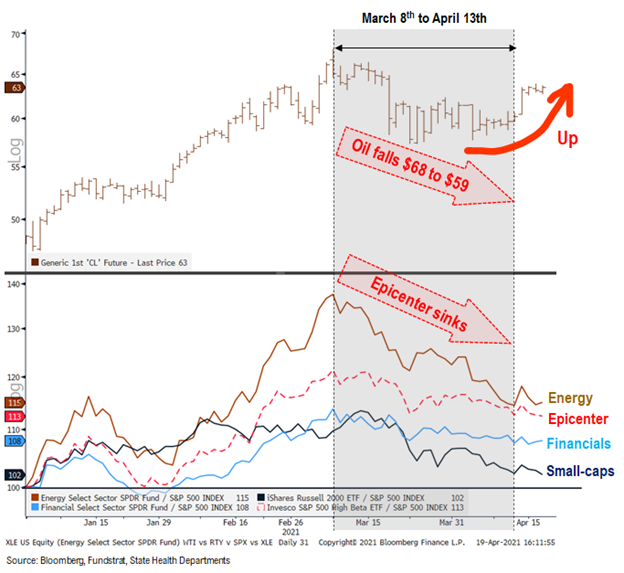
Oil has turned up and demand outlook remains positiveWe recently wrote about the upturn in oil prices and how it should lead to an improvement in the relative performance of cyclicals. As shown below, the downturn in oil prices from $69 to $59 has coincided with a downturn in Epicenter stocks.
– if oil prices rise, we expect Energy stocks to surge
– a rise in oil is a reflationary signal and would be a tailwind for cyclicals
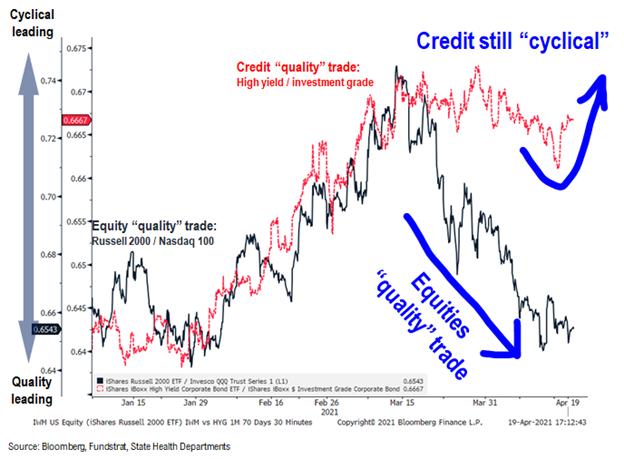
Credit markets continue to lean “cyclical” while equities have become Defensive
Similarly, notice the upturn in the relative performance of Cyclical credit (High-yield vs investment grade). This upturn is pronounced and continued even today.
– but in equities, small-caps continue to underperform S&P 500
– which tells us equity investors are relatively more skeptical of the cyclical recovery, compared to equity investors
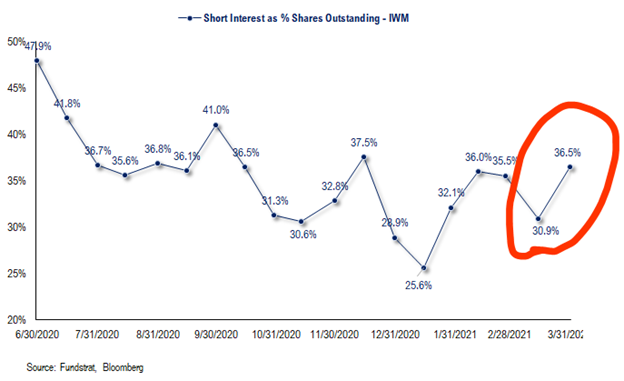
IWM, proxy for small-cap, is now the third most shorted ETF…
Short interest on the IWM (proxy for Russell 2000) surged in just the past two weeks from 30.9% of float to 36.5%. This is the highest since November 2020. And has been steadily rising.
– Credit markets still favor Cyclicals
– HF has been shorting cyclical equities
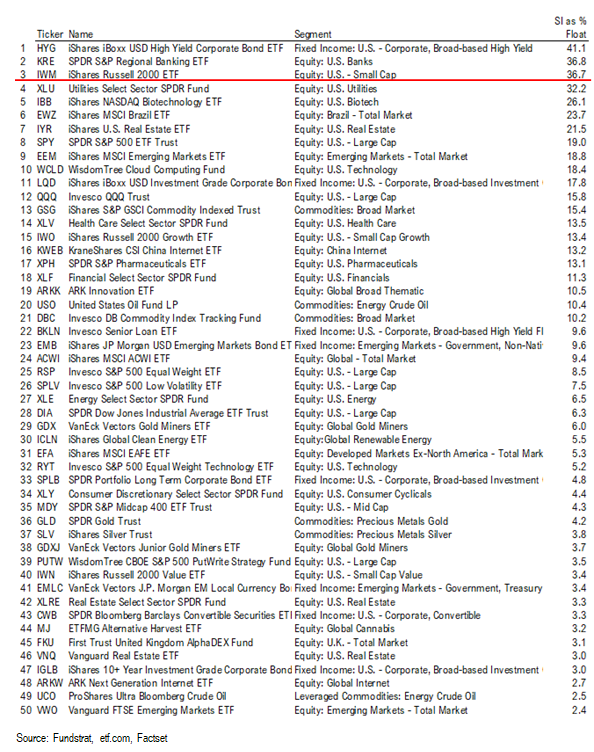
In fact, IWM is the third most shorted ETF.
The only ETFs with greater short interest are:
– HYG –> high-yield
– KRE –> US regional bank ETF
So you can see, equity investors are actually positioned bearishly regarding cyclical stocks.
This ties back to our variant views. And if COVID-19 cases are rolling over, and if oil prices are rising, these are pro-cyclical developments. Hence, we expect short covering of IWM to fuel the rally.
ADDENDUM: We are attaching the stock lists for our 3 portfolios:
We get several requests to give the updated list for our stock portfolios. We are including the links here:
– Granny Shots –> core stocks, based on 6 thematic/tactical portfolios
– Trifecta epicenter –> based on the convergence of Quant (tireless Ken), Rauscher (Global strategy), Technicals
– Violence in USA –> companies that are involved in some aspect of home or personal security. We are not “recommending” these stocks, but rather, bringing these stocks to your attention.
Granny Shots:
Full stock list here –> Click here
Tickers: GOOG, AMZN, EBAY, GRMN, TSLA, BF/B, MNST, MO, PG, PM, PSX, AXP, BIIB, GILD, REGN, AAPL, CSCO, MSFT, MU, MXIM, NVDA, PYPL, QCOM, QRVO, SWKS, XLNX, D, EIX
Trifecta Epicenter (*):
Full stock list here –> Click here
Tickers: AAP, AN, AZO, F, GM, HOG, BBY, GRMN, GPC, LEG, TPX, PHM, NWL, MAT, PII, RL, MGM, HLT, MAR, NCLH, RCL, WH, TNL, SIX, FL, GPS, KSS, LB, VFC, WTFC, ASB, FNB, PB, TFC, WBS, PACW, NYCB, MTG, EVR, IBKR, VIRT, BK, STT, BHF, AGCO, OC, ACM, WAB, GNRC, CSL, GE, GGG, IEX, PNR, CFX, DOV, MIDD, SNA, XYL, FLS, EAF, ITT, ALK, DAL, JBLU, LUV, MIC, KEX, JBHT, R, UBER, UHAL, MAN, XOM, HP, BKR, HAL, NOV, SLB, COP, EOG, FANG, HES, MRO, MUR, PXD, XEC, HFC, MPC, PSX, EXP, CF, NEU, NUE, RS, SON, IP, ARE, BXP, HIW, JBGS, ESS, UDR, KIM, NNN, O, WRI, PSA
Violence in USA:
Full stock list here –> Click here
(*) Please note that the stocks rated OW on this list meet the requirements of our investment theme as of the publication date. We do not monitor this list day by day. A stock taken off this list means it no longer meets our investment criteria, but not necessarily that it is neutral rated or should be sold. Please consult your financial advisor to discuss your risk tolerance and other factors that characterize your unique investment profile.
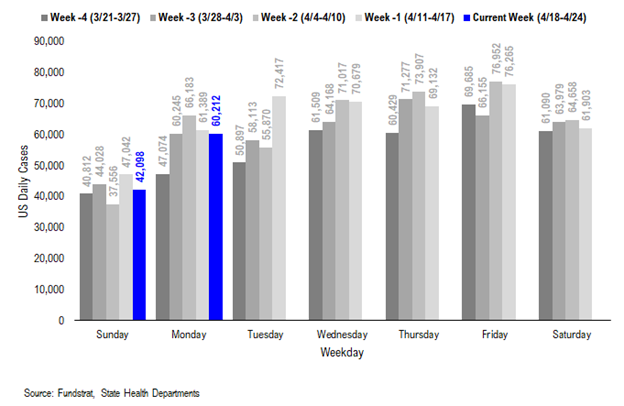
POINT 1: Daily COVID-19 cases 60,212, -1,177 vs 7D ago… 7D delta has been negative in the past six days…
_____________________________
Current Trends — COVID-19 cases:
– Daily cases 60,212 vs 61,389 7D ago, down -1,177
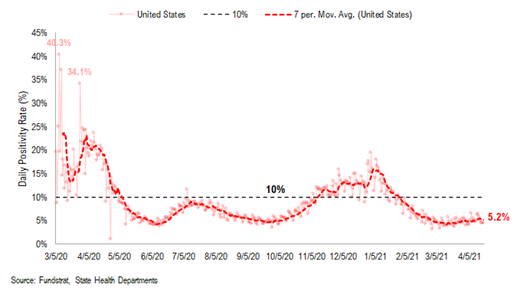
– 7D positivity rate 5.2% vs 5.2% 7D ago
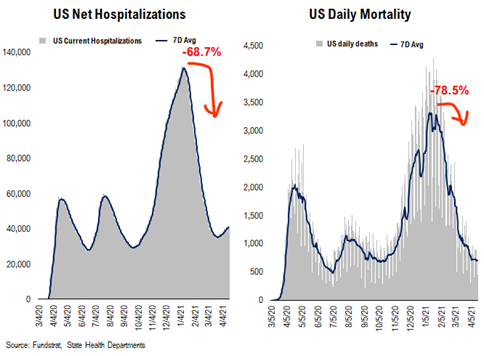
– Hospitalized patients 41,439 up +4.1% vs 7D ago
– Daily deaths 714, down -0.3% vs 7D ago
_____________________________
– The latest COVID-19 daily cases came in at 60,212, down -1,177 vs 7D ago.
– After surging to ~16k on last Tuesday, 7D delta in daily cases has turned negative in the past six days. This is a good sign and 7D delta in daily cases might soon make an even more drastic plunge.
– As we wrote before, at this stage of pandemic, as long as vaccinations work, eventually the rollout of the vaccines will lead to a decline in the pervasiveness of the COVID pandemic.
7D delta in daily cases has turned negative in the past six days…
After surging to ~16k on last Tuesday, 7D delta in daily cases has turned negative in the past six days. This is a good sign and 7D delta in daily cases might soon make an even more drastic plunge.
US hospitalization still rolling over … and even US deaths seem to be rolling over…
Below we show the aggregate patients who are currently hospitalized due to COVID. It has fallen significantly from the wave 3 peak.
POINT 2: VACCINE: 49 states near ~60% infected + vaccinated… 1 in 4 Americans have been fully vaccinated…
_____________________________
Current Trends — Vaccinations:
Vaccinations ramping steadily
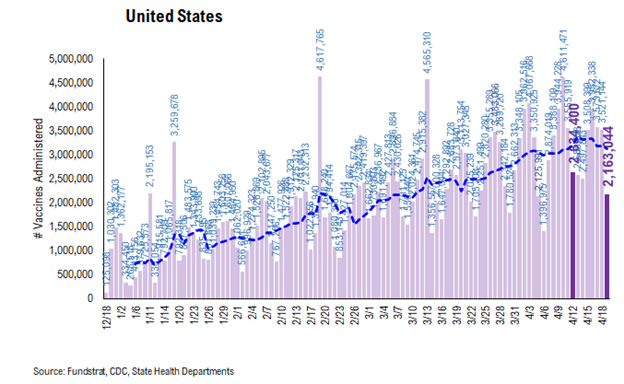
– avg 3.1 million this past week vs 3.2 million last week
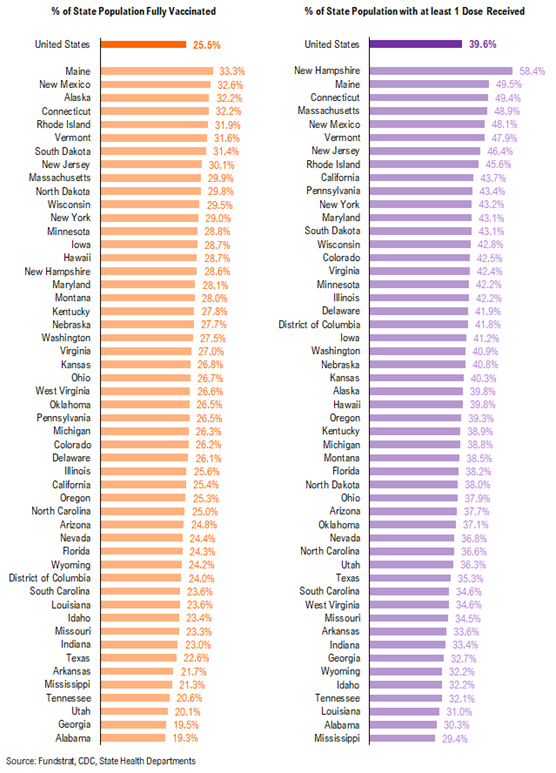
– overall, 25.5% fully vaccinated, 39.6% 1-dose+ received
_____________________________
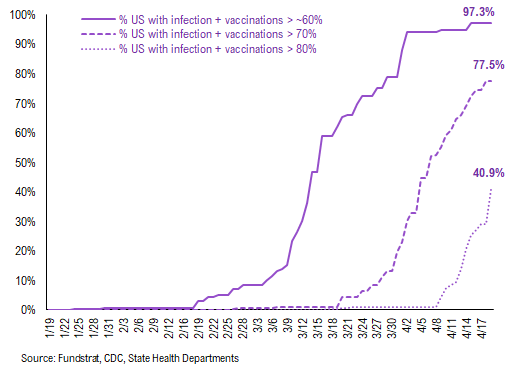
Vaccination frontier update –> almost all states now near or above 60% combined penetration (vaccines + infections)
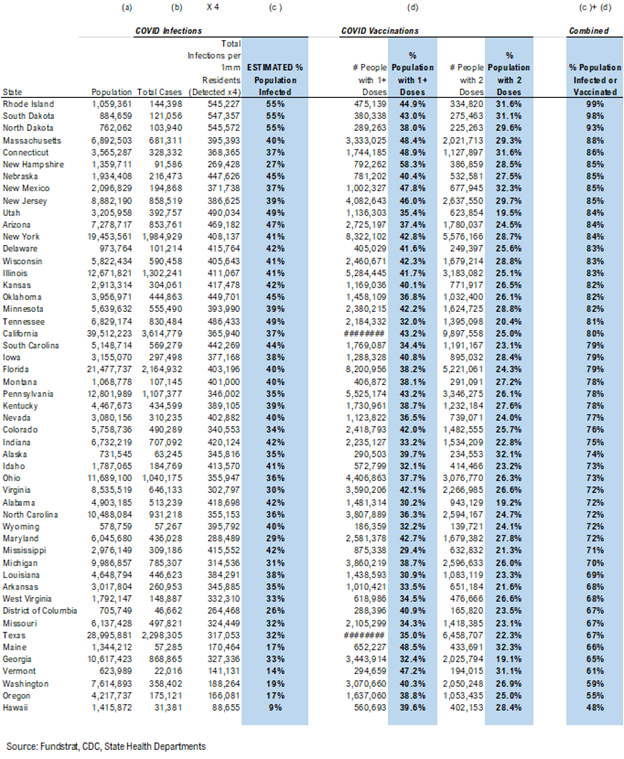
Below we sorted the states by the combined penetration (vaccinations + infections). As we commented in the past, the key figure is the combined value >60%, which is presumably near herd immunity. That is, the combined value of infections + vaccinations as % population > 60%.
– Currently, all states except OR and HI (see below) are basically all at this level
– SD, ND and RI are now above 90% combined penetration (vaccines + infections)
– So slowly, the US is getting to that threshold of presumable herd immunity
Collectively, these 49 states represent about 97.3% of the US population. In fact, 77.5% of US states (based on state population) have seen combined infection and vaccination >70% and 40.9% of US states have seen combined infection and vaccination >80%. As the chart below highlights, the US is seeing steady forward progress and this figure continues to rise steadily.
There were a total of 2,163,044 doses administered on Monday, down 18% from 7D ago. However, the overall pace is steadily rising, as evidenced by the 7D moving average (see blue line).
~82.4% of the US has seen 1-dose penetration >35%…
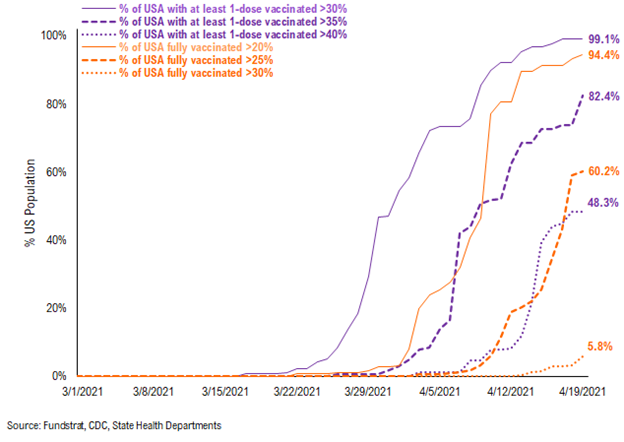
To better illustrate the actual footprint of the US vaccination effort, we have a time series showing the percent of the US with at least 20%/25%/30% of its residents fully vaccinated, displayed as the orange line on the chart. Currently, 94.4% of US states have seen 20% of their residents fully vaccinated. However, when looking at the percentage of the US with at least 25% of its residents fully vaccinated, this figure is 60.2%. And only 5.8% of US (by state population) have seen 30% of its residents fully vaccinated.
– While 99.1% of US states have seen vaccine penetration >30%, 82.4% of them have seen 1 dose penetration >35% and 60.2% of them have seen 1 dose penetration > 40%.
– 94.4% of the US has at least 20% of its residents fully vaccinated, However, only 60.2% of US has fully vaccinated >25%
– This is still a small figure but this figure is rising sharply now.
This is the state by state data below, showing information for states with one dose and for those with two doses.
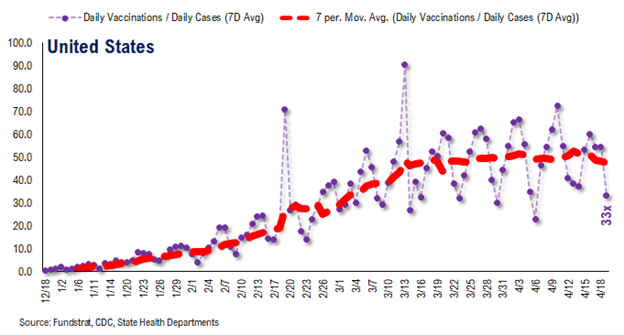
The ratio of vaccinations/ daily confirmed cases is generally trending higher (red line is 7D moving avg) and this is the most encouraging statistic.
– the 7D moving average is about ~50 for the past few days
– this means 50 vaccines dosed for every 1 confirmed case
This figure is rising nicely and likely surges in the coming weeks
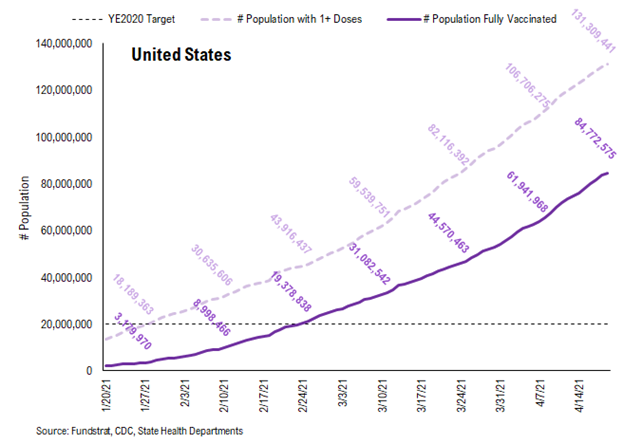
In total, about 131 million Americans have received at least 1 dose of a vaccine. This is a good pace and as we noted previously, implies 50% of the population by May.
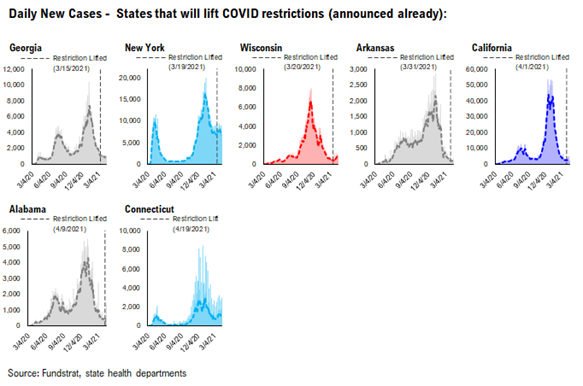
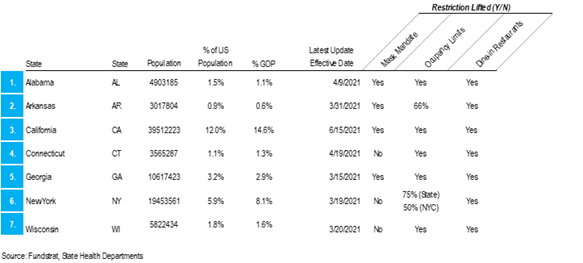
POINT 3: Tracking “un-restricted” and “restriction-lifted” states
We are changing Point #3 to focus primarily on tracking the lifting of restrictions, as states begin to ease various mandates. Keep in mind, easing/lifting restrictions can take multiple forms:
– easing indoor capacity
– opening theaters, gyms, salons, saloons
– eliminating capacity restrictions
– eliminating mask mandates
So there is a spectrum of approaches. Our team is listing 3 tiers of states and these are shown below.
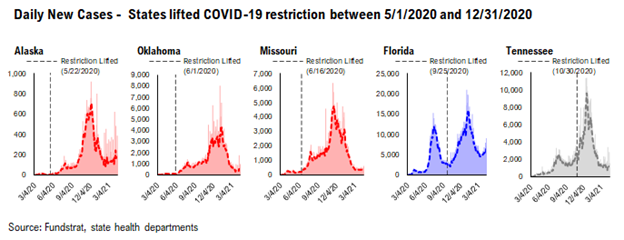
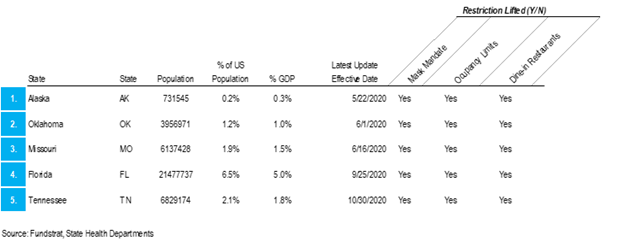
– states that eased in 2020: AK, OK, MO, FL, TN
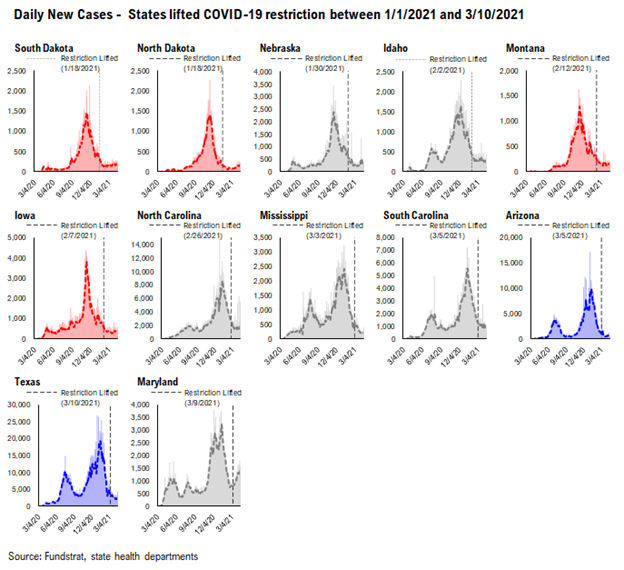
– states that eased start 2021 to now: SD, ND, NB, ID, MT, IA, NC, MS, SC, AZ, TX, MD
– states that announced future easing dates: GA, NY, WI, AR, CA, AL, CT
GROUP 1: States that eased restrictions in 2020…
The daily case trends in these states is impressive and it is difficult to say that lifting restrictions has actually caused a new wave of cases. Rather, the case trends in these states look like other states.
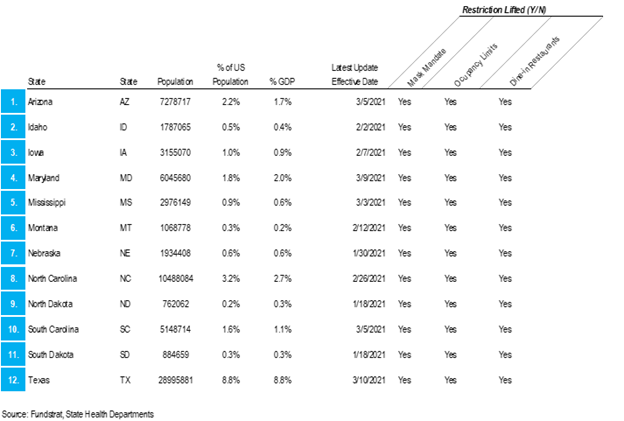
GROUP 2: States that eased restrictions in 2021 to now…
Similar to the list of states above, the daily case trends in these states are impressive and it is difficult to say that lifting restrictions has actually caused a new wave of cases.
– we have previously written about how ND and SD, in particular, have seen an utter obliteration of COVID-19 cases in those states
– that seems to be a function of vaccine penetration + infection penetration, leading to something akin to “herd immunity”
GROUP 3: States that announced plans ease restrictions in 2021…
These states have upcoming dates to ease restrictions. The dates are indicated on each chart. The cases trends in these states have been mostly positive, with perhaps the exception of NY state:
– NY state case levels seem awfully stubborn at these high levels
– weather is improving in NY area, so if weather has any effect on virus transmission, it should slow cases