


A new week is ahead of us. Americans have begun re-engaging, emerging from >3 months of quarantine restrictions. In the Northeast, I certainly saw a huge change everywhere I went. Shopping mall parking lots were packed, waits to enter retail stores, big waits for outdoor dining. It is as if this was a grand opening at a theme park — but this is just another Northeast city. Overshadowing this re-opening of America is the nationwide protests over the death of George Floyd, which by media reports, saw larger crowds this weekend compared to prior days. These nationwide protests are creating considerable uncertainty:
– massive protests = 10,000 super spreader events = second wave?
– growing movement = political changes
– ongoing protests = economic disruption
So there are multiple avenues of disruption/uncertainty created by these nationwide protests. Hence, these bear watching closely and are obviously as important as the timeline for COVID-19. Regarding this first point (super spreader), there is no evidence of renewed infection spread from these protests (mostly outdoors anyway) and that is encouraging, but we have penciled in June 11th as the real date to measure, because it would be 14 days since the first nationwide protests.
As we have commented many times, there is no ‘playbook’ for equity markets post-pandemic because everything happening since the first US COVID-19 cases is not normal:
– this is a disease which the world never faced and is very contagious
– this is not normal to see epicenter of COVID-19 as NY tristate, nursing homes and Hispanics
– this is not a normal economic shock
– this is not a normal business cycle
– this is not a normal fiscal response
– this is not a normal central bank environment
But what has really surprised us is how textbook the stock market behavior has been. Stocks gained 5% last week, building upon already impressive gains and now representing the 11th V-shaped recovery for stocks (total market recoveries after a >35% decline, see below). And because there is nothing ‘normal’ about 2020, our framework has relied on trying to explain the moves of the equity markets. The strong recovery in stocks since March, in our view, has signaled a much more vigorous economic and EPS recovery than most economists and consensus broadly have suggested.
The recent steepening of the 30Y-10Y yield curve is further evidence supporting a stronger economic recovery. Historically, steepening curves are often a leading barometer of stronger growth ahead. There are many explanations why, but essentially, longer rates rise reflecting either higher inflation risk or higher real growth.
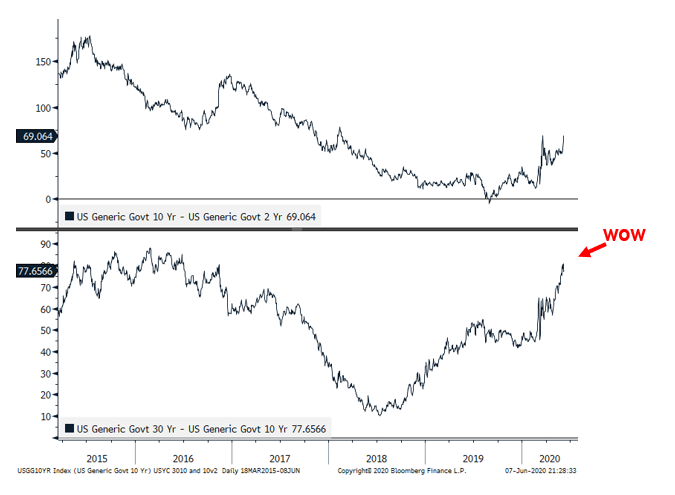
JPMorgan’s Fixed Income team also believes the curve has room to steepen further, which is bullish for equities (implied higher growth). They are “undeterred” by the steepening and recommend strategies around steepeners. Incidentally, stronger growth strengthens the cyclical outlook = good for “epicenter stocks” and thus, we continue to recommend “less barbell” and outright owning Cyclicals.
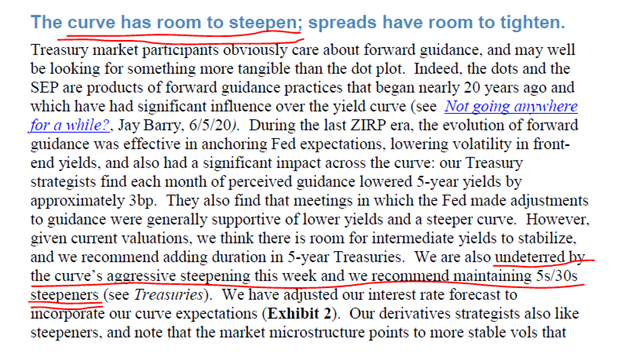
Source: JPMorgan US Fixed Income Weekly
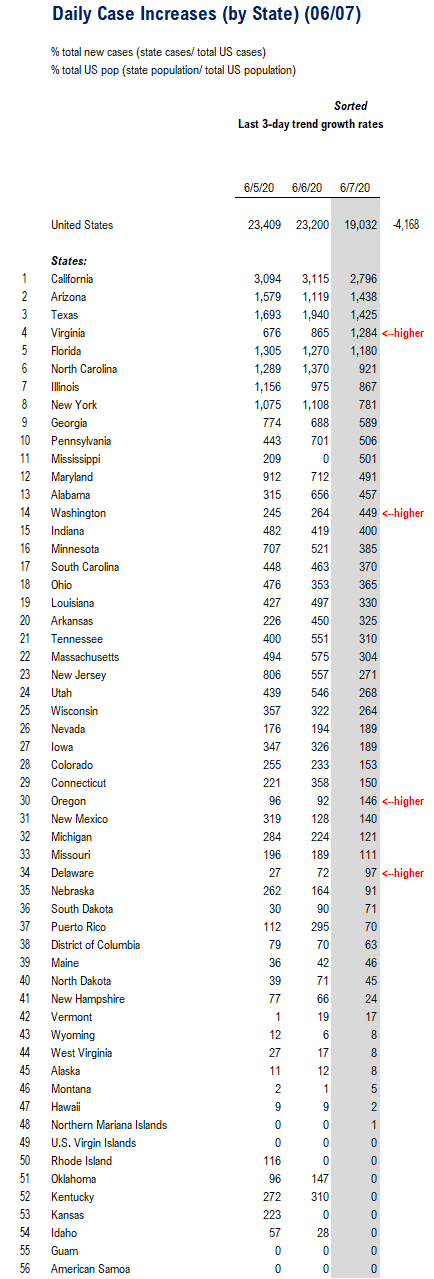
POINT #1: US daily cases steady at 19,000 (flat with most of last week) and testing reaching new highs
Total US COVID-19 cases came in at 19,032 which is about flat with last week and down from an elevated 23,000 cases reported on Friday and Saturday (6/5 and 6/6). Overall, cases are down 42% from their peak of 36,115 on 4/24/2020 and it has been 44 days. The good news is that no states are reporting any new surges and this remains an overall positive observation — with the increased along with protests, the risks are really elevated for a second wave or new transmission events.
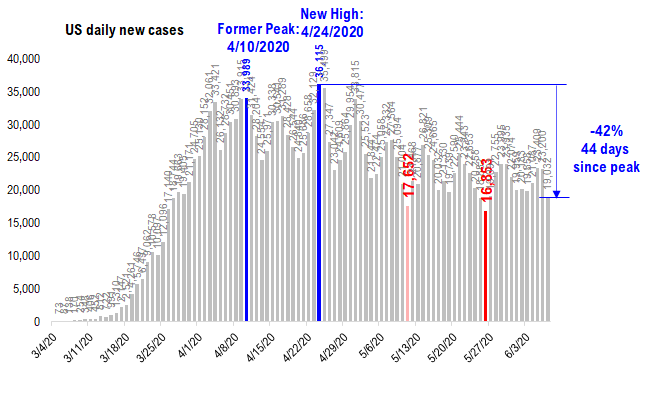
Source: COVID-19 Tracking Project
Because there remains quite a lot of weekend-related seasonality (offices closing, greater testing lags, people delaying treatment, etc), we think the 7D change is helpful. And as shown below, the 7D change has been down for each of the past 4 days. This is also suggestive of the fact that despite the heightened risk of new infections, they are in fact down.
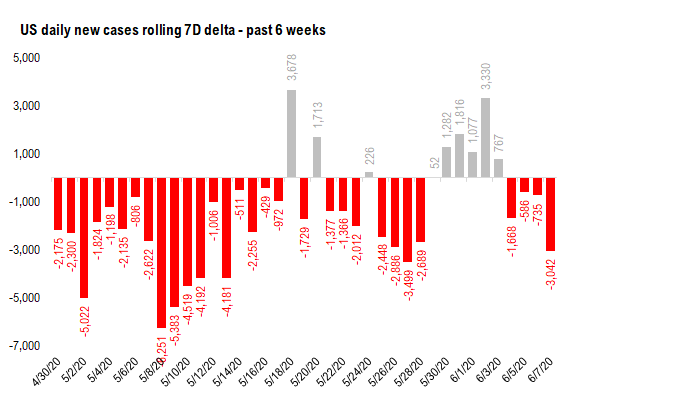
Source: COVID-19 Tracking Project
4 States report >100 increase vs 2D ago:
Virginia 1,284 vs 676 (Fri) +608
Mississippi 501 vs 209 +292
Washington 449 vs 245 +204
Alabama 457 vs 315 +142
Total 4 states +1,246
6 states report sizable declines:
New Jersey 271 vs 806 (Fri) -535
Maryland 491 vs 912 -421
North Carolina 921 vs 1,289 -368
Minnesota 385 vs 707 -322
California 2,796 vs 3,094 -298
New York 781 vs 1,075 -294
Total 6 states -2,238
Source: COVID-19 Tracking Project
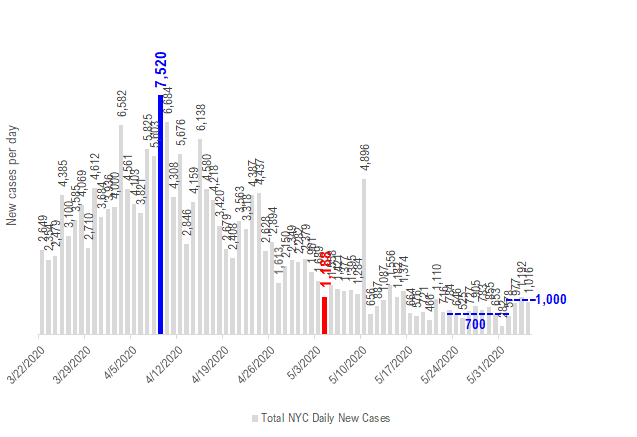
NYC finally enters Phase 1 Monday… a long wait but the city still reporting 1,000 cases per day, or 114 per 1mm residents.
New York City enters Phase 1 Monday. The daily reported cases have been steady at about 1,000 per day and are down from the peak of 7,520 in early April. Phase 1 is the opening of:
– NYC subway 95% capacity restored;
– curbside retail open;
– manufacturing, wholesale trade and agriculture (not sure much of that is in NYC);
But outdoor dining at restaurants and bars is not until Phase 2 which is tentatively 6/22 (2 weeks). Returning to the offices is not until Phase 2 as well. Interestingly, Hudson Valley NY will be Phase 2 on Tuesday. That means “outdoor dining” — big step.

Source: NYC Health Dept.
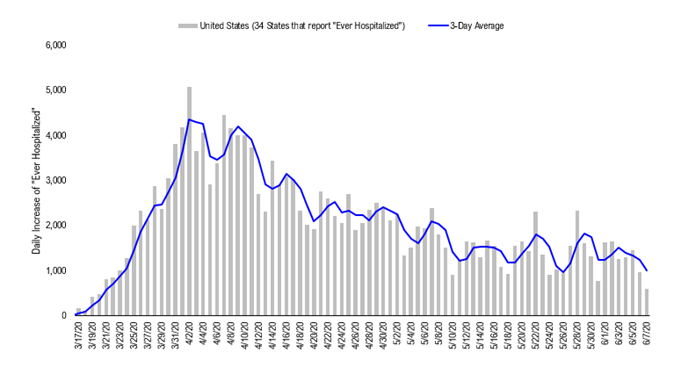
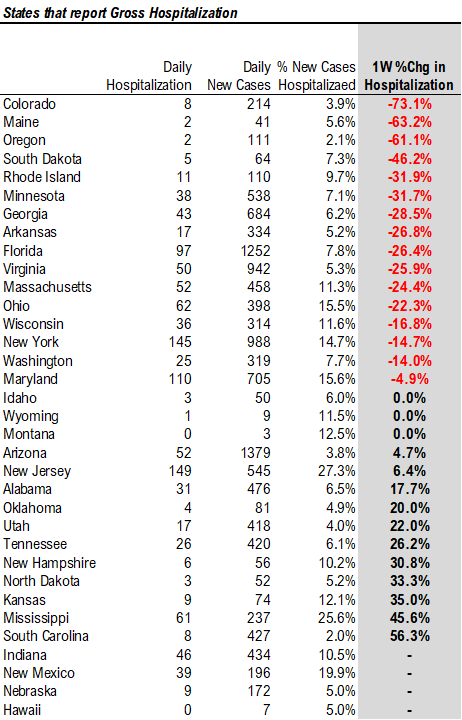
POINT #2: Hospitalizations have been steady, despite ongoing nationwide protests. 16 (of 34 with daily) see big declines.
Hospitalizations have been steady/declining even as protests have continued across the US…
The 34 states with “ever hospitalized” (gross hospitalizations, not net) have shown a steady trend in the past few weeks with daily hospitalizations running about 1,200-1,400 per day. This is will off the 5,000 figures seen in early April.
But these figures are also not necessarily plunging, plunging the way France and Spain and much of Europe has seen. So the US glidepath is somewhat of steady declines, but not the one seeming to trend to zero.
Source: COVID-19 Tracking Project
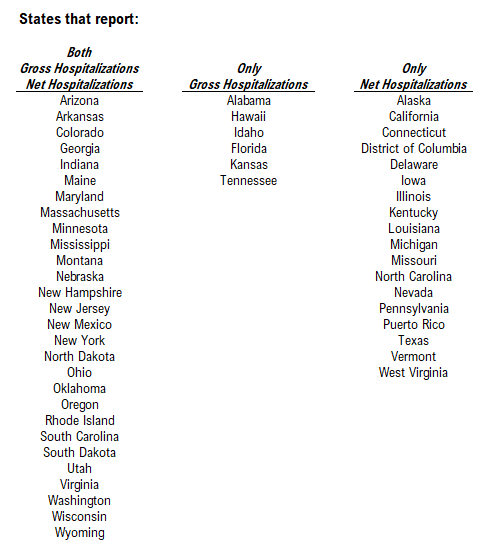
States are not entirely consistent with their reporting of hospitalization data. We have compiled how each state reports this data below. There are two ways to report the data:
– “gross” hospitalization (aka “ever hospitalized”) and
– “net hospitalizations” (which is net of “discharges”)
Of the 50 states:
– 28 report both “gross” and “net”
– 6 report “gross” only
– 18 report “net” only
This adds to >50 because Puerto Rico and D.C. are included. And neither is a US state.
Source: COVID-19 Tracking Project and Johns Hopkins and State Health websites
State-by-state, most hospitals reporting a “crash” in new hospitalizations…
The good news is that most states are reporting huge declines in new hospitalizations. The data for the 34 states that report “gross” are shown below.
– Colorado -73%
– Maine -62
– Oregon -61
These are big numbers. And for those states with large increases, the “base effect” is making the numbers seem large:
– South Carolina +56% rise to 8 hospitalizations (from 5)
– Mississippi +46% rise to 61 (from 42)
So the bottom line is the hospitalization trend is positive.
Source: COVID-19 Tracking Project and Johns Hopkins and State Health websites
POINT #3: If “epicenter” groups are turning, long-term charts suggest tons of runway — hence, stick with “less barbell”
“Less barbell” makes sense to us if economic momentum is improving…
We still like Growth stocks, particularly strong companies with defensible businesses, high capital return generation and well managed. But these stocks have also turned into bond proxies and hence, have already held up well during this pandemic.
But as the economy emerges from the nadir of the COVID-19 crisis, we believe investors should reduce their barbell and outright add to their cyclical exposure — exposure to sectors at the “epicenter” of the COVID-19 crisis. These stocks were sold off indiscriminately during Feb/March. And high levels of fear and uncertainty around COVID-19 kept investors on the sidelines on these names.

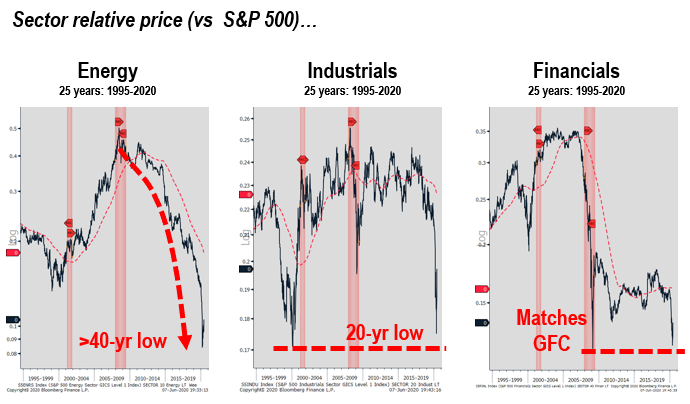
If the “epicenter” stocks are turning, long-term charts show there is a lot of runway for these to outperform…
Before COVID-19, these epicenter groups, Discretionary, Energy, Industrials and Financials, were already in multi-year and, in some cases, multi-decade periods of underperformance. Thus, if these groups have started to rally, there is plenty of runways.
Below are 25-year price charts of the sectors relative to the S&P 500 (sector/S&P 500):
– Energy underperformed >40 years (pre-1980s);
– Industrials underperformance brings prices to >20-year lows;
– Financials have seen price contracts matching the 2008 GFC
Thus, if these groups begin to outperform, and if it is sustained, it would be reversed decades of underperformance.
Valuations are distorted by depressed margins…
As for valuations, we still think P/S is a better proxy at the moment given the depressed net income margins. And as shown below, on a P/S basis, the “epicenter” groups have a relatively lower P/S compared to the S&P 500 overall. And this is with sales growth forecasted to be quite strong in 2021.
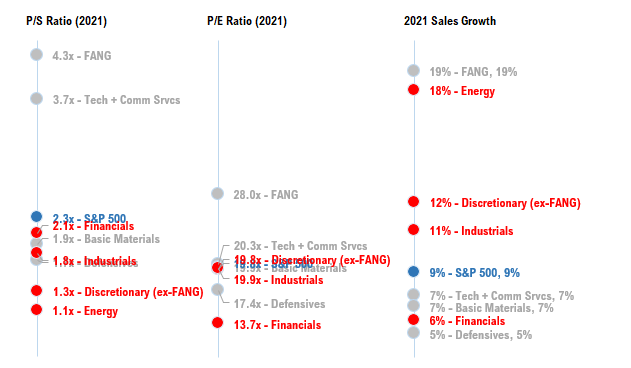
Source: Fundstrat
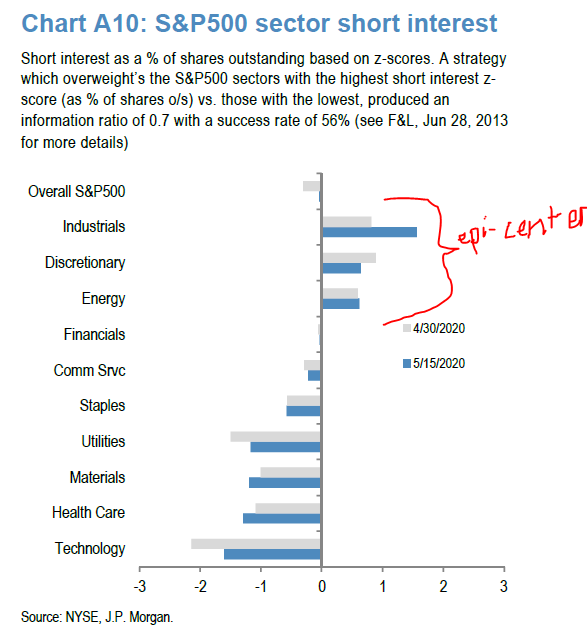
Short interest is elevated for the “epicenter” groups…
JPMorgan published updated its analysis of the short interest data for the S&P 500 sectors. They adjust the data to reflect the z-score, or the # standard deviations the current short interest vs the long-term average. 4 sectors show elevated short interest:
– Industrials 1.9X (above LT avg)
– Discretionary 0.8X
– Energy 0.8X
– Financials -0.0X
It is not entirely surprising to see that investors are still relatively short the “epicenter” groups because the earnings declines will be the strongest in these sectors. But this also works in the reverse. If the economic momentum strengthens, these stocks will benefit from short covering.
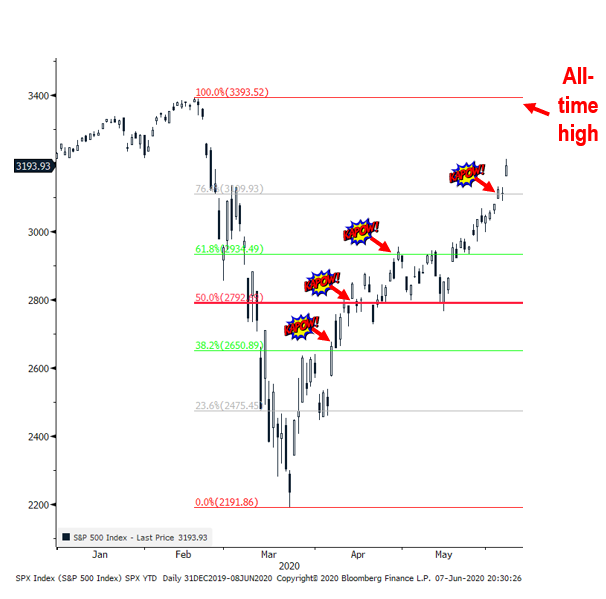
STRATEGY: The S&P 500 has cleared some key levels, most recently the 76% retracement, setting up for a move to all-time highs
The S&P 500 finished strongly last week, close well above 3,109.93, the 76% retracement level (see below). Since the 3/23/2020 lows, the S&P 500 has successfully exceeded some key levels below. And as we have commented, on an ongoing basis, each of these levels is a key level that has progressively ruled out a re-test of new lows (of which many expected).
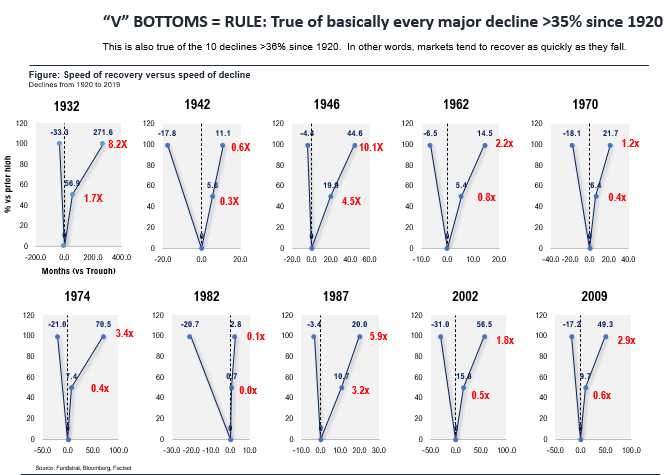
Since 1929, equity recoveries are symmetric to their initial decline, 10 of 10 declines >35% show this…
We wanted to revisit the analysis we originally published in late March, showing the surprising symmetry of market recoveries relative to market declines. In the 10 declines >35% since 1920, each of these equity recoveries shows that the speed of the decline governs the speed of the recovery:
– Each the 2 most recent bear markets (1999-2003 and 2007-2009) had the price recovery that took 1.8X and 2.9X, respectively.
– The median of all instances since 1920 is 2.5X and the average of the last 2 is 2.5X.
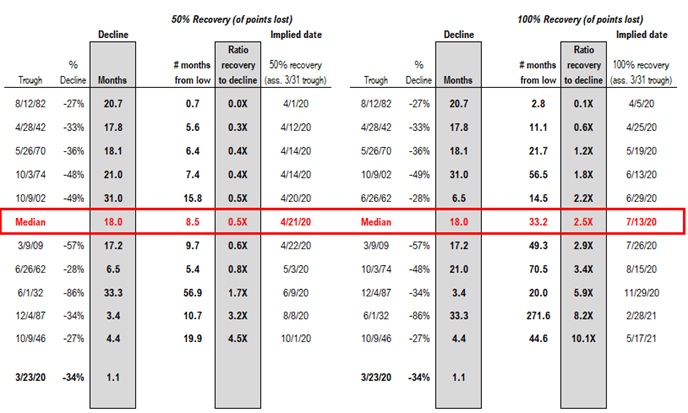
Applying precedent market recoveries, the median suggests market new highs by July 13, 2020, but 8 of 10 say before year-end…
We took the precedent market declines and using the ratio (recovery vs decline), calculated the implied date of a new high. In all these instances, we are treating 3/23/2020 as the final low. We cannot conclusively say 3/23/2020 is the market low, but as our past commentary highlighted, if the S&P 500 managed to recover 50% of its losses, in those 10 instances, we never saw a new low.
– the median 2.5X recovery implies new market highs by July 13, 2020
– 8 of the 10 see new highs before the end of 2020
Source: Fundstrat


