Click HERE to access the FSInsight COVID-19 Daily Chartbook.
We are shifting to a 4-day a week publication schedule:
Monday
Tuesday
Wednesday
SKIP THURSDAY
Friday
STRATEGY: Final days of August supportive of “everything rally”
We are in the “dog days of August” and the final week of August, pre-Labor Day weekend, tends to be quiet. There is no reason to believe 2021 will be any different.
A reminder, though, we are hosting a webinar with Anthony Scaramucci on Tuesday at 3pm for FSInsight clients. Please register by clicking on the link below. This will be a fireside chat and there is a myriad of topics we will be covering.
Click here to register –> REGISTER
…Second order effects of COVID-19 –> rise in childhood obesity in USA
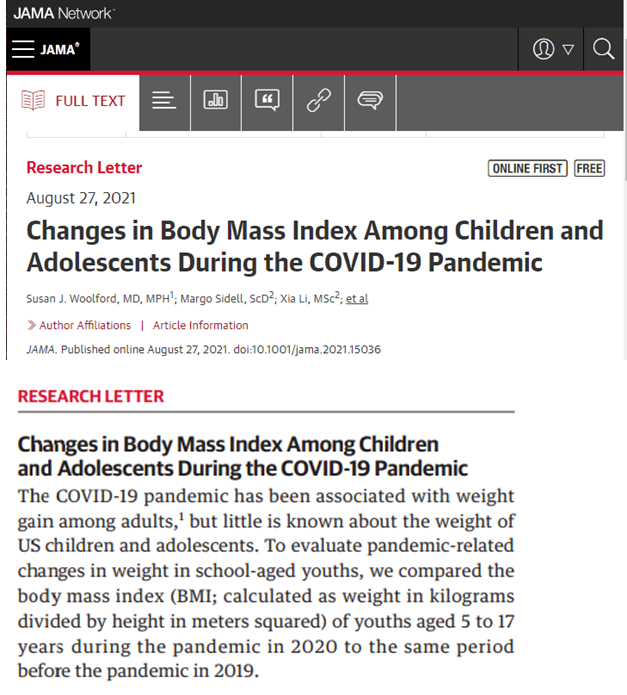
A new research paper on the JAMA Network (see below) highlights a second order tragedy of COVID-19. There has been a notable increase in childhood obesity during the pandemic.
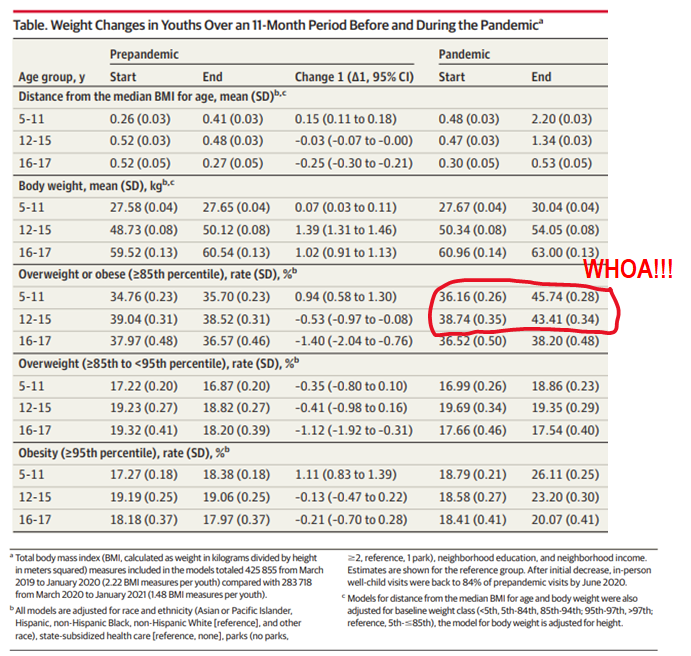
– researchers studied > 190,000 Americans
– overall weight has increased (no surprise)
– BMI increased mostly in the youth
– % kids age 5-11 overweight rose from 36% to 46% during pandemic
– % kids age 12-15 overweight from from 39% to 43% during pandemic
This is a staggering rise and took place in just the past 18 months. There must be several factors involved but this study did not discuss the contributing factors. Rather, the focus is on the long term implications of this surge in weight gain.
More than anything, this simply tells us “slimming of America” might actually become another investment theme for the next 5-10 years.
– after all, it is harder to lose 5 lbs than it is to gain 5 lbs
– I know this all too well
…COVID-19 is similar to a rattlesnake bite, per SUNY researchers
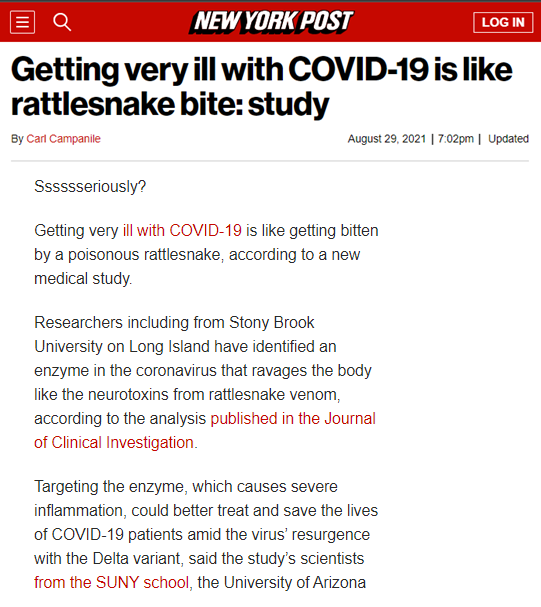
Here is another headline that caught my eye today. Some researchers at SUNY Stony Brook (Long Island, NY) have found an enzyme in COVID-19 that ravages the body, similar to the neurotoxins from rattlesnake venom.
– wow, that is a lot to process
– this study was published in the Journal of Clinical Investigation
– the enzyme is sPLA2-II and it’s similar to venom
– in high concentrations, this “shreds” the membranes of vital organs
The positive of this study is that sPLA2-IIA inhibitors exist and this could lead to a new pathway for COVID-19 therapeutics. It is interesting and something we will follow.
STRATEGY: History shows strong equities strong in September when markets see strong 1H.
Investors are wary of September in 2021. At least that is the feedback we get from speaking with our clients. Several factors are cited:
– in 2020, equities fell sharply
– markets are ‘overbought’ and due for a pullback
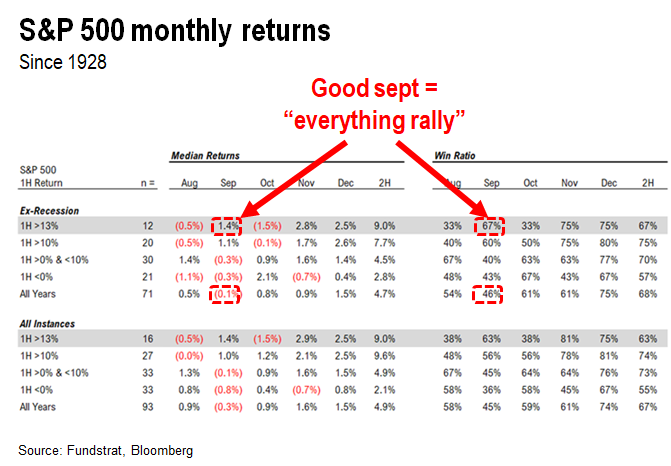
– since 1928, Sept returns (all years) are down -0.1% and win-ratio only 46%
– however, seasonals differ if 1H gains are strong
– 1H2021 was up > 13%, the 10th best since 1928
– median Sept gains are +1.4%
– win-ratio is 67%
So Sept returns are likely to be stronger than consensus. Thus, we believe the “everything rally” is intact and we expect markets to see strong gains over the next 4 weeks.
SECTORS: Financials, REITs and Basic Materials are the strongest groups…
The Epicenter trade remains our favorite strategy into YE.
Sure, we are OW FANG/Technology and our focus there is the “catch-up” trade. After all, does it make sense for S&P 500 to finish the year > +25% and AMZN 1.78% is flat YTD or AAPL 3.61% is barely up +10%? Or even NFLX 2.01% holding flat? You get the picture.
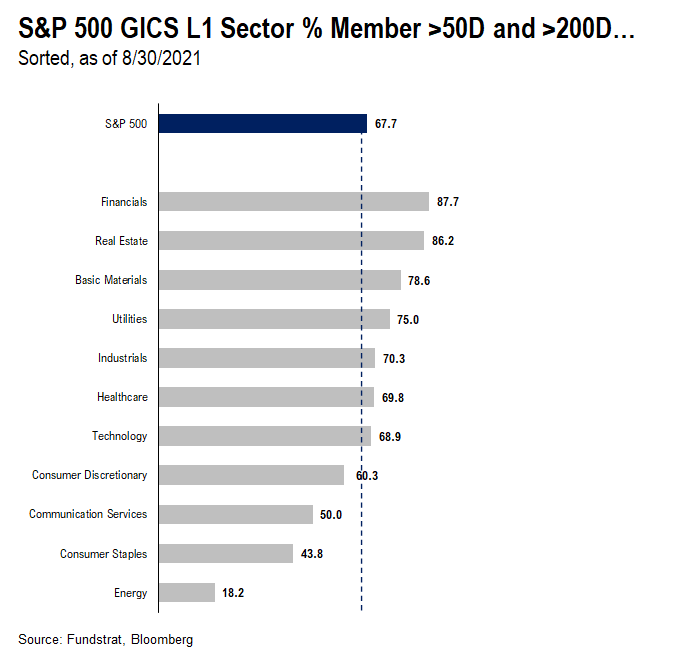
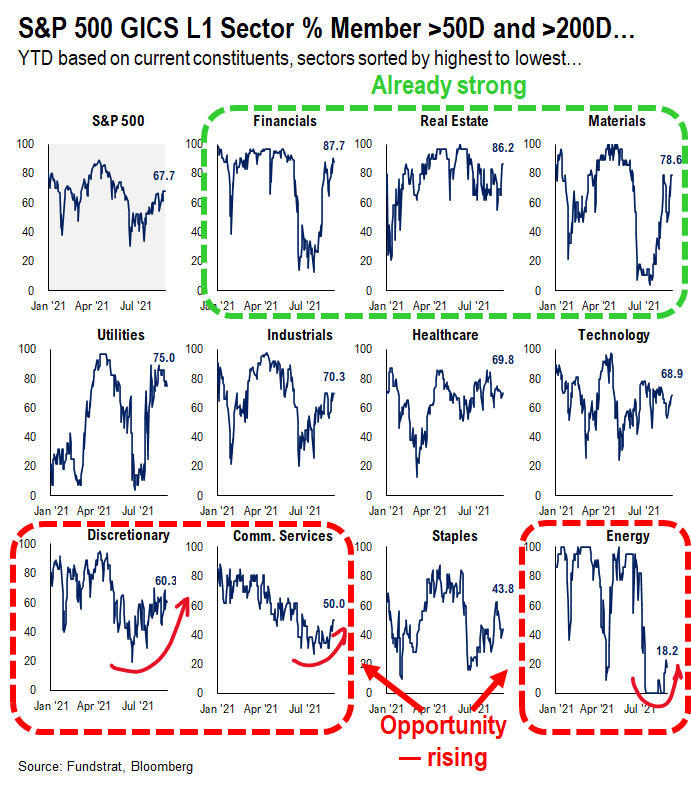
The chart below looks at the strength of the major GICS1 sectors of the S&P 500. We determine this by calculating what % of stocks in each sector are above both the 50D and 200D moving average. This is generally a stock in an uptrend both short-term (50D) and long-term (200D).
– thus, a stock above both 50D and 200D
– is strong, because it is uptrend over ST and LT
The strongest groups, as noted above, are Financials, REITs and Basic Materials. In other words, Epicenter groups (REITs obviously less so). Most might be surprised that Basic Materials are so strong.
…But look at the groups showing considerable improvement –> Energy, Discretionary and Communications Services
The “level” of strength is not the only way to look at sector strength. The “rate of change” is key. After all, great investment opportunities arise during inflections. Thus, identifying groups gaining strength, particularly when fundamental factors also support this, generally means good risk/reward:
– Discretionary, Energy and Communication Services are seeing many stocks strengthen
– thus, a recent surge in their constituents above both 50D + 200D mavg
This is also a sign that market strength is broadening. And consistent with our “everything rallies” view.
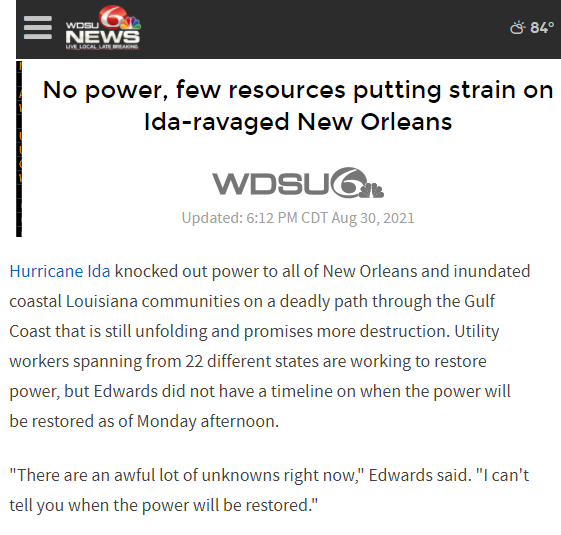
Hurricane Ida devastates Louisiana, harkening memories of Hurricane Katrina in 2005
Hurricane Ida clobbered LA yesterday as a category 4 hurricane. This is the strongest storm since Hurricane Katrina in 2005. Katrina was a shock, leading to tragedy as the levies in New Orleans flooded and failed. Fortunately, this did not happen in 2021, despite massive flooding and winds exceeding 150 mph.
In 2005, post-Katrina, oil fell but Energy equities
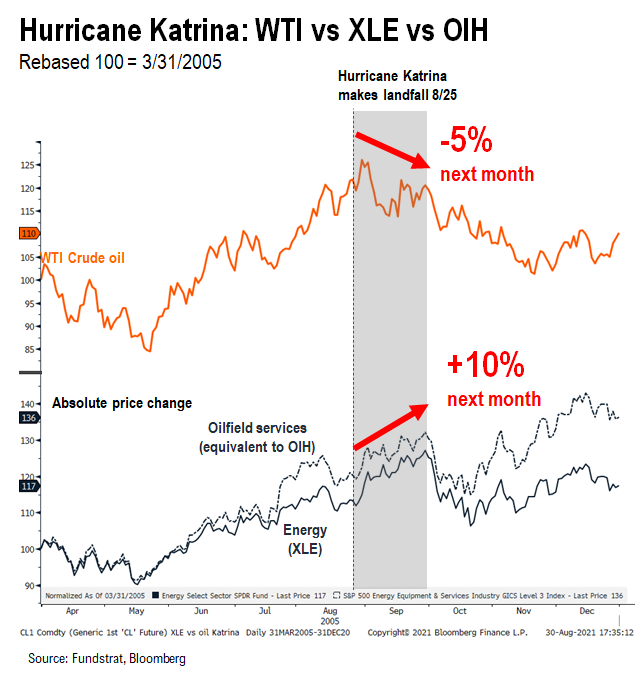
WTI oil prices rose yesterday, continuing the strength of last week. And we thought it would be helpful to see how oil and Energy equities performed after Hurricane Katrina. Hurricane Katrina made landfall on 8/25/2005 (below).
– oil post-landfall, fell -5% over the next month
– Energy equities (ETF XLE 1.02% ) rose +10% in that timeframe
– Oilfield services, while impacted by closures and demand hit, also gained +10% (ETF proxy today OIH 2.54% )
The takeaway is that Energy stocks essentially looked past the shorter term impacts of the hurricane. In fact, in 2005, the shock and disruption from Katrina also disrupted the US economy. Recall, consumer confidence collapsed post-Katrina and we even saw a rise in jobless claims. So the shock to the US was sizable.
– even in the face of that, Energy equities strengthened into YE
– this even as oil continued to fall
The takeaway is that hurricane impact today will create short-term shocks, but we do not see this changing the investment strategy into YE.
__________________________
26 Granny Shot Ideas:
26 Granny Shot Ideas: We performed our quarterly rebalance on 07/30. Full stock list here –> Click here
___________________________
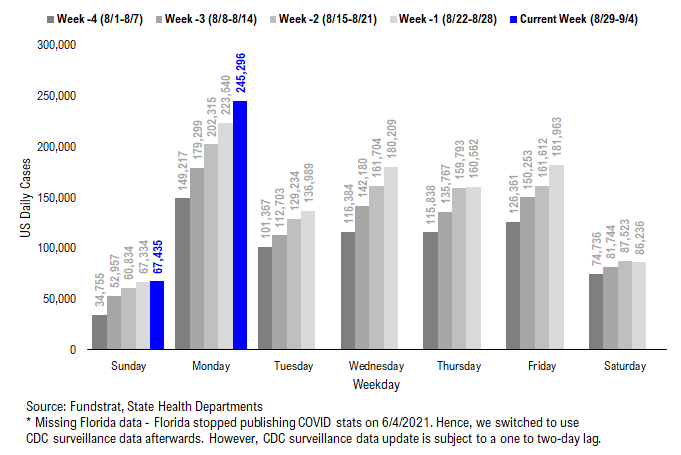
POINT 1: Daily COVID-19 cases 245,296, up 21,756 vs 7D ago…
_____________________________
Current Trends — COVID-19 cases:
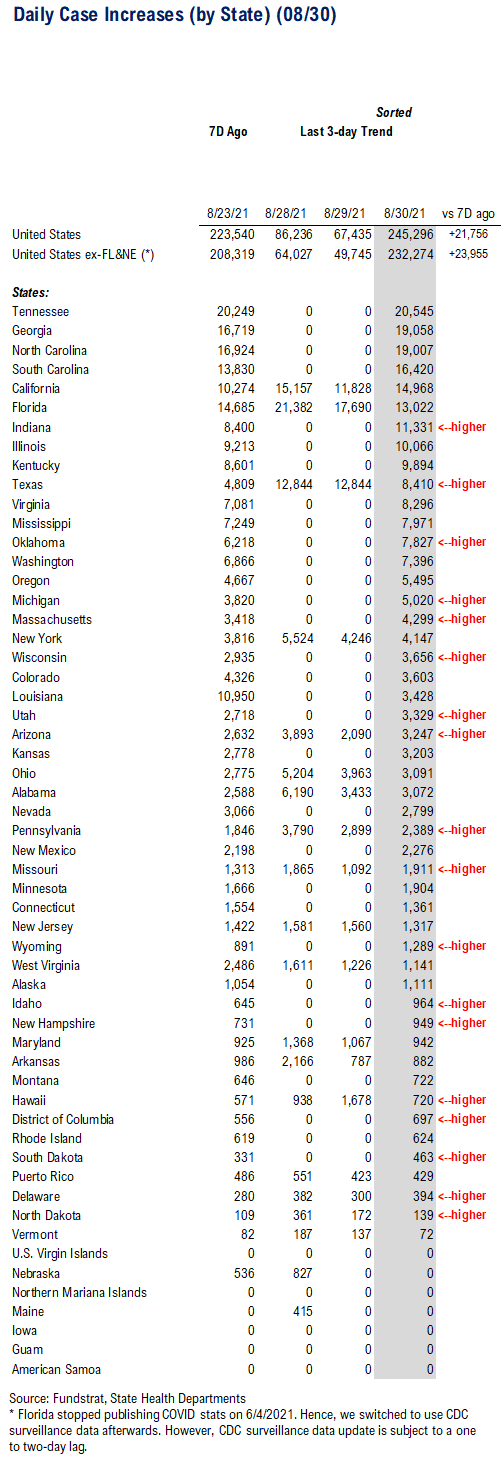
– Daily cases 245,296 vs 223,540 7D ago, up 21,756
– Daily cases ex-FL&NE 232,274 vs 208,319 7D ago, up 23,955
– 7D positivity rate 8.7% vs 9.0% 7D ago
– Hospitalized patients 95,685, up +4.0% vs 7D ago
– Daily deaths 1,307, up +20.5% vs 7D ago
___________________________
*** Florida and Nebraska stopped publishing daily COVID stats updates on 6/4 and 6/30, respectively. We switched to use CDC surveillance data as the substitute. However, since CDC surveillance data is subject to a one-to-two day lag, we added a “US ex-FL&NE” in our daily cases and 7D delta sections in order to demonstrate a more comparable COVID development.
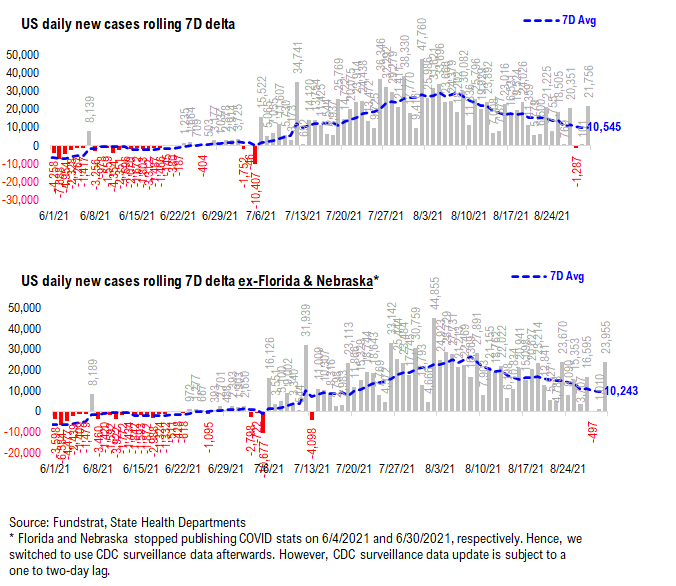
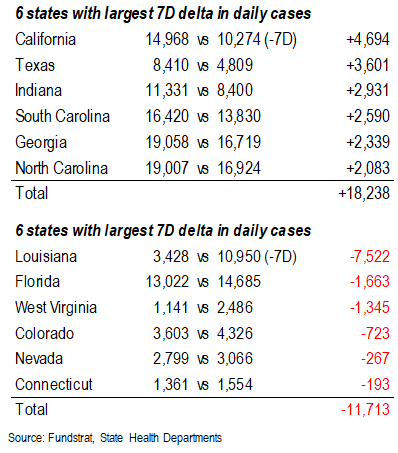
The latest COVID daily cases came in at 245,296, up 21,756 vs. 7D ago. Despite this Saturday’s negative 7D deltas, the 7D delta became positive once again on Monday. A negative 7D delta indicates a case rollover, so hopefully today proves an anomaly and this past weekend’s trend remains. If it does, the rolling 7D delta will soon become negative as well which would further emphasize a case rollover.
Currently, we are at the critical stage of case rollover for many states. As noted recently, many states have already peaked while the daily cases in some other states are about to peak. Despite Monday’s data, the view on case trends is still in favor of a case roll over. Hopefully this past weekend’s trend remains steady and we continue to see daily cases fall in “apexing” states. Anyhow, as long as the 7D delta continues to fall, the case rollover is just a matter of time.
7D delta in daily cases fell to ~10,000 now…
As shown in the chart below, the 7D delta in daily cases has been on a downtrend – down 60% from the peak of ~26,000 three weeks ago to a current level of ~10,000. Despite today’s uptick in 7D delta, we expect the decline to persist. If this past weekend’s trend remains steady and the 7D once again turns negative, the rolling 7D delta will soon become negative as well which would further emphasize a case rollover.
Low vaccinated states seem to have a larger increase in daily cases compared to their recent low…
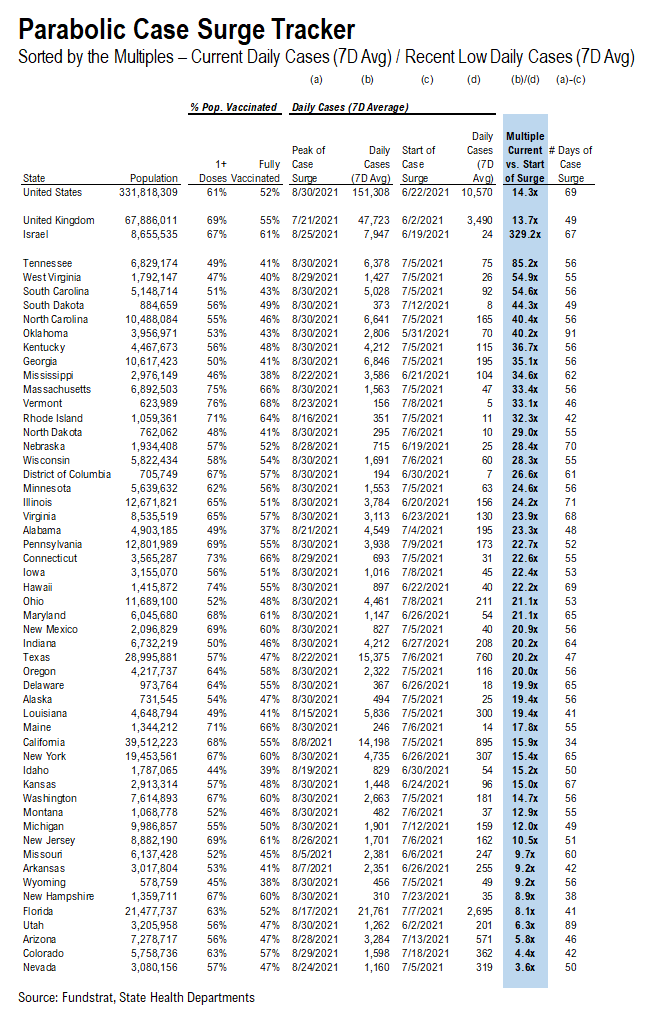
Below, we added a new section called “Parabolic Case Surge Tracker” to monitor the possible parabolic surge in daily case figures. In the table, we included both the vaccine penetration and the recent case trend for 50 US states + DC. The table is sorted by the multiple of their recent peak daily cases divided by the daily cases when their case surges started.
– The states with higher ranks are the states that have seen a more significant rise in daily cases
– We also calculated the number of days during the recent case surge; a state with a high multiple but low number of days since its low means the state is facing a relatively rapid surge in daily cases
– The US as a whole, UK, and Israel are also shown at the top as a reference
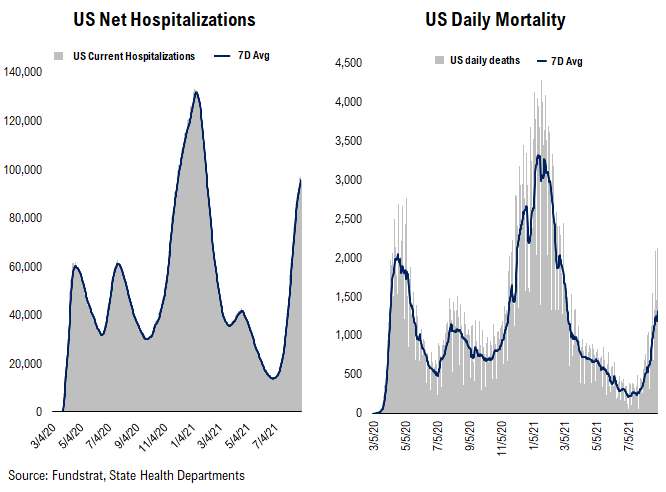
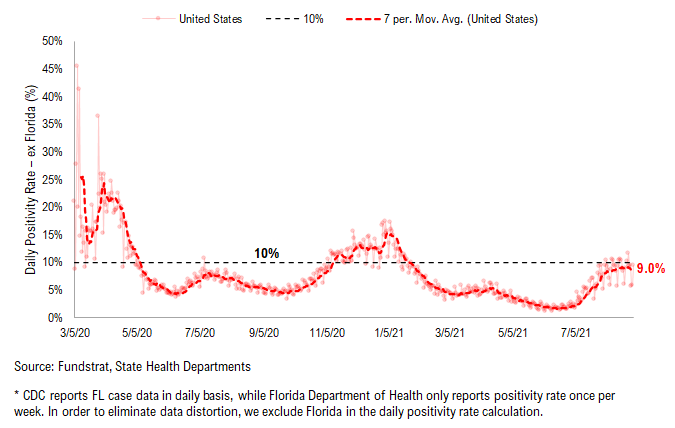
Hospitalization continues rising, while positivity rate has plateaued… Daily deaths also start to surge now…
Below we show the aggregate number of patients hospitalized due to COVID, daily mortality associated with COVID, and the daily positivity rate for COVID.
– Hospitalization has exceeded the peak level we’ve seen in Wave 1 and 2 in 2020 and continues surging.
– With the increasing number of daily tests, positivity rate has plateaued over the past week. As daily cases have already start to roll over in some states, the positivity rate could roll over soon.
– Daily deaths have been surging recently, but less “dramatic” than the cases or hospitalization trends. Currently, daily death has surpassed the peak we have seen in Wave 2.
POINT 2: VACCINE: vaccination pace has been steadily rising…
_____________________________
Current Trends — Vaccinations:
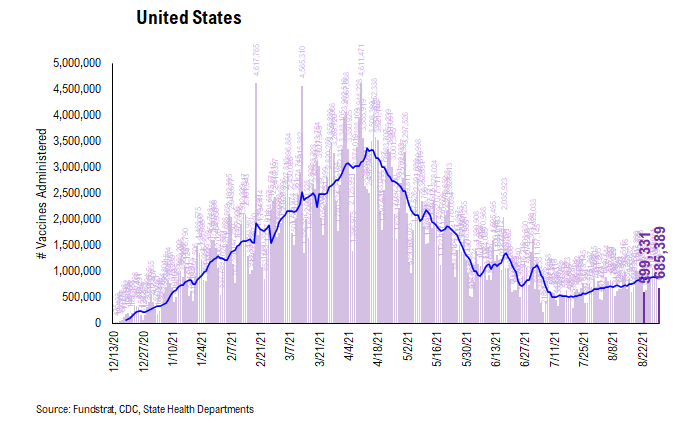
– avg 0.9 million this past week vs 0.8 million last week
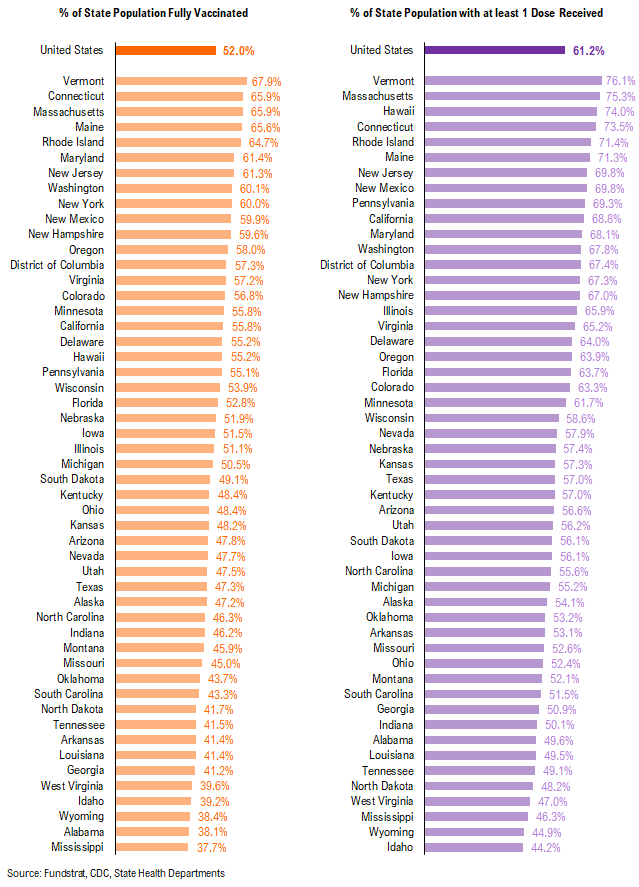
– overall, 52.0% fully vaccinated, 61.2% 1-dose+ received
_____________________________
Vaccination frontier update –> all states now near or above 90% combined penetration (vaccines + infections)
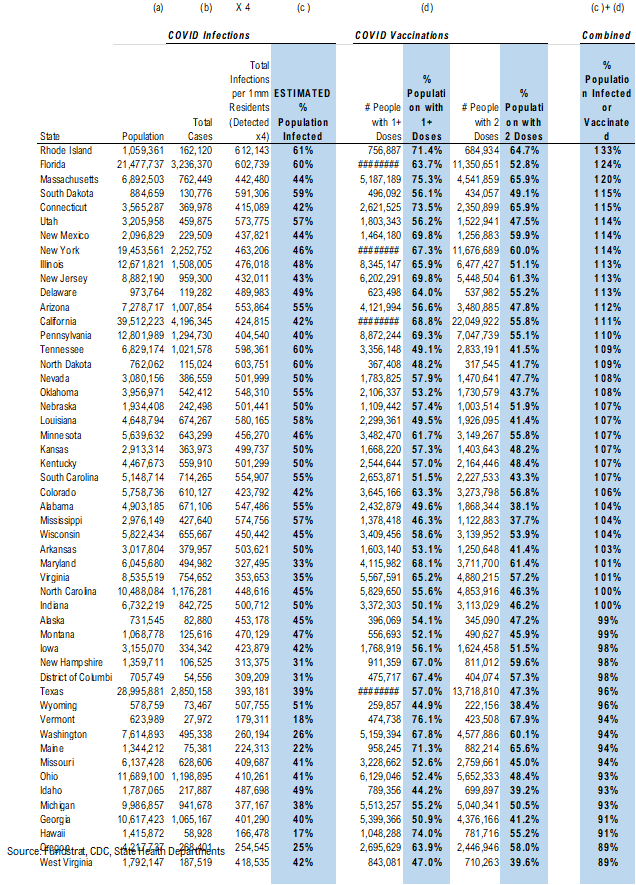
Below we sorted the states by the combined penetration (vaccinations + infections). The assumption is that a state with higher combined penetration is likely to be closer to herd immunity, and therefore, less likely to see a parabolic surge in daily cases and deaths. Please note that this “combined penetration” metric can be over 100%, as infected people could also be vaccinated (actually recommended by CDC).
– Currently, all states are near or above 80% combined penetration
– RI, MA, FL, CT, SD, NJ, IL, NY, DE, NM, UT, PA, ND, NV, CO, KS, TN, OK, WI, SC, AZ, MN, CA, and NE are now above 100% combined penetration (vaccines + infections). Again, this metric can be over 100%, as infected people could also be vaccinated. But 100% combined penetration does not mean that the entire population within each state is either infected or vaccinated.
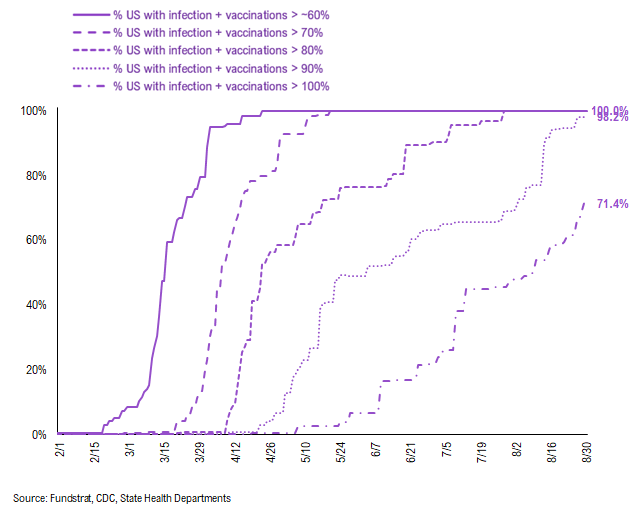
Below is a diffusion chart that shows the % of US states (based on state population) that have reached the combined penetration > 60%/70%/80%/90%/100%. As you can see, all states have reached 80% combined vaccination + infection. 98.2% of US states (based on state population) have seen combined infection & vaccination > 90% and 71.4% of US states have seen combined infection & vaccination > 100% (Reminder: this metric can be over 100%, as infected people could also be vaccinated. But 100% combined penetration does not mean that the entire population within the state is either infected or vaccinated).
There were a total of 685,389 doses administered reported on Monday, down 4% vs. 7D ago. Nonetheless, the overall vaccination trend has been steadily increasing recently. We believe many catalysts could push the vaccination pace even higher.
– Proof of vaccination required by many US cities and venues
– Booster shots
– Full FDA approval of Pfizer COVID vaccines (hopefully it could help overcome vaccine hesitancy)
The daily number of vaccines administered remains the most important metric to track this progress and we will be closely watching the relevant data.
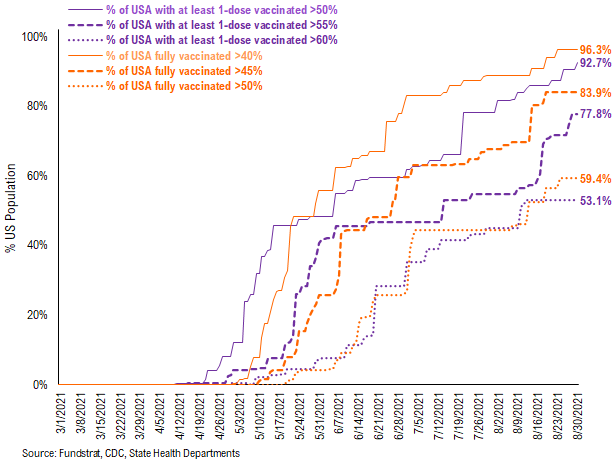
53.1% of the US has seen 1-dose penetration > 60%…
To better illustrate the actual footprint of the US vaccination effort, we have a time series showing the percent of the US with at least 45%/45%/50% of its residents fully vaccinated, displayed as the orange line on the chart. Currently, 96.3% of US states have seen 40% of their residents fully vaccinated. However, when looking at the percentage of the US with at least 45% of its residents fully vaccinated, this figure is 83.9%. And only 59.4% of US (by state population) have seen 50% of its residents fully vaccinated.
– While 92.7% of US states have seen 1 dose penetration > 50%, 77.8% of them have seen 1 dose penetration > 55% and 53.1% of them have seen 1 dose penetration > 60%.
– 96.3% of the US has at least 40% of its residents fully vaccinated, However, only 83.9% of US has fully vaccinated > 45% and 59.4% of US has fully vaccinated > 50%.
This is the state by state data below, showing information for individuals with one dose and two doses.
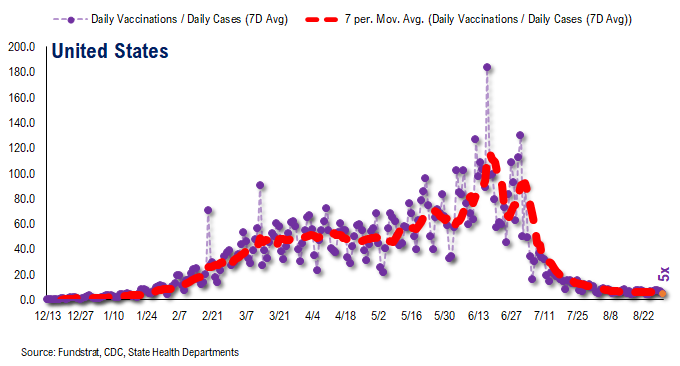
The ratio of vaccinations/ daily confirmed cases has been falling significantly (red line is 7D moving avg). Both the surge in daily cases and decrease in daily vaccines administered contributed to this.
– the 7D moving average is about ~5 for the past few days
– this means 6 vaccines dosed for every 1 confirmed case
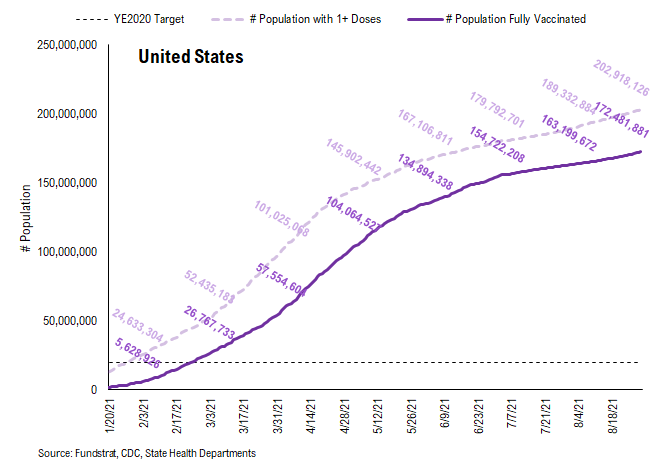
In total, 375 million vaccine doses have been administered across the country. Specifically, 203 million Americans (63% of US population) have received at least 1 dose of the vaccine. And 172 million Americans (52% of US population) are fully vaccinated.
POINT 3: Tracking the seasonality of COVID-19
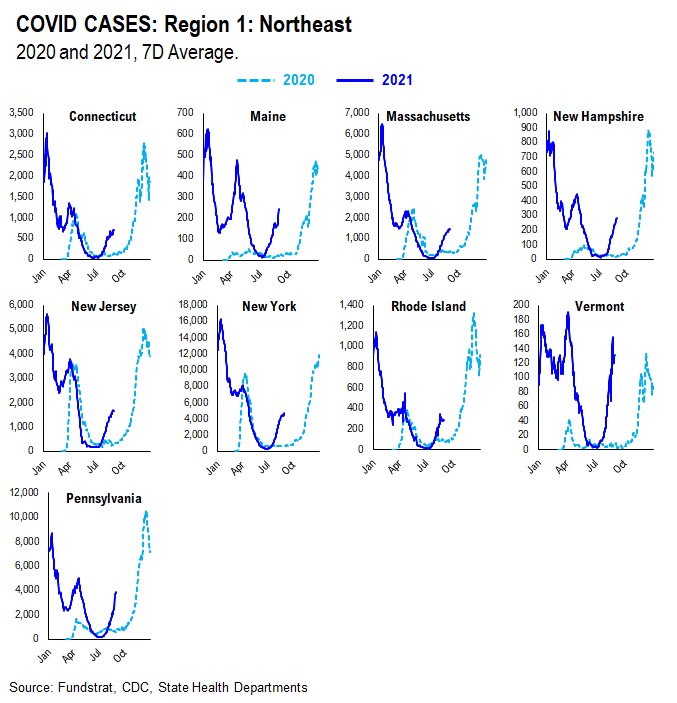
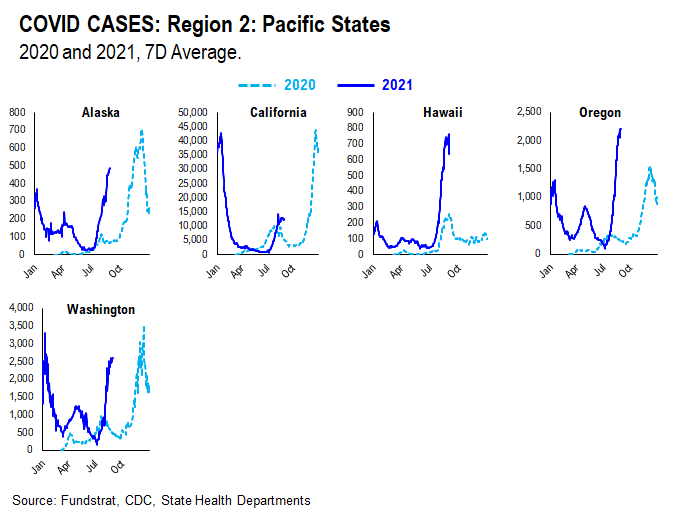
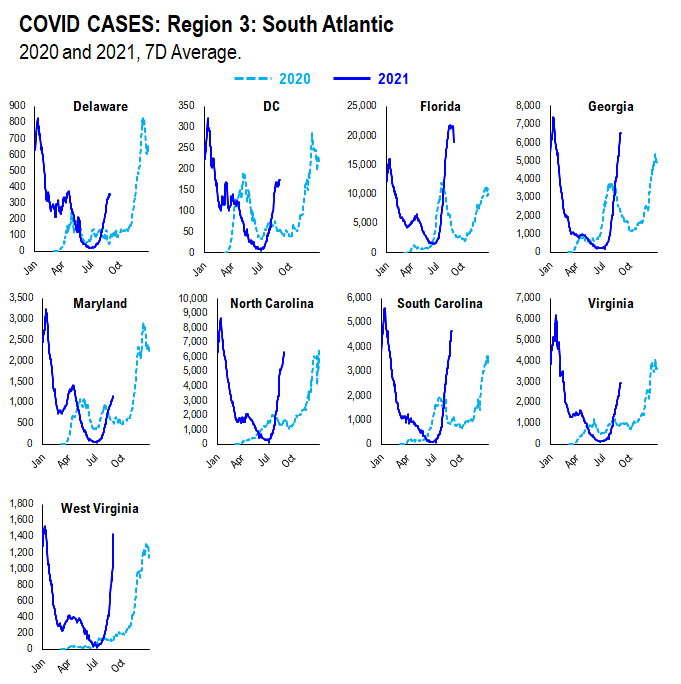
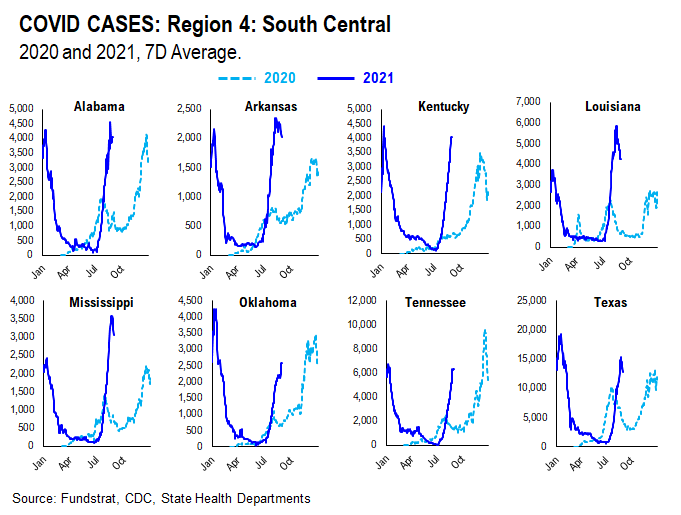
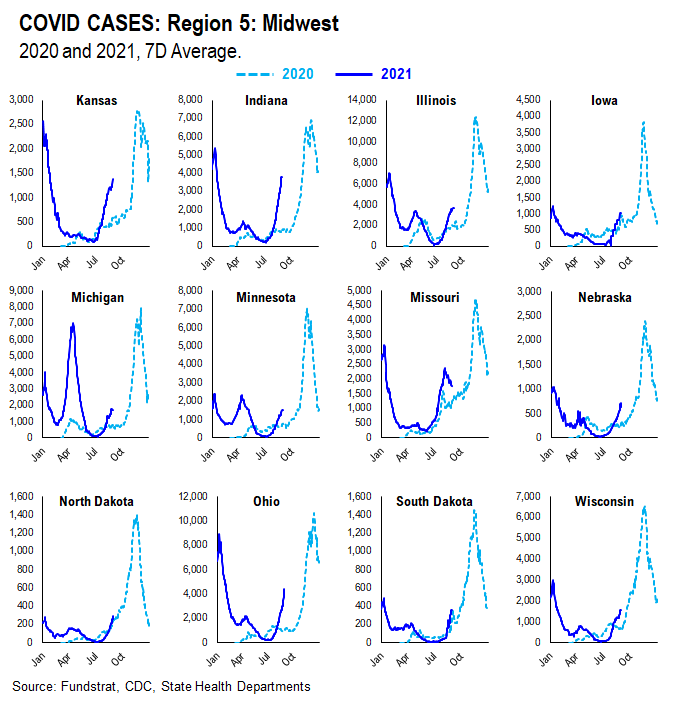
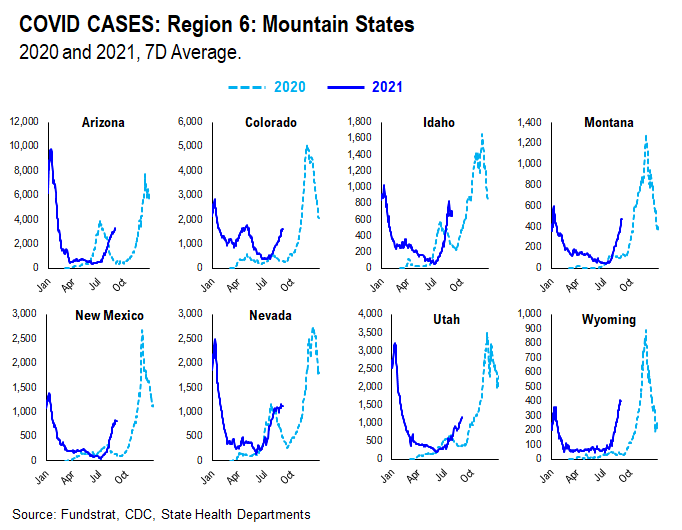
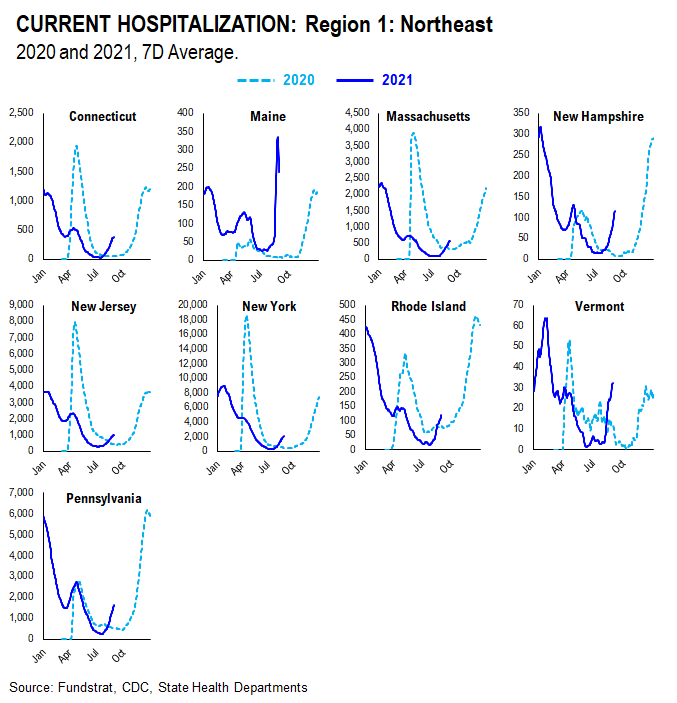
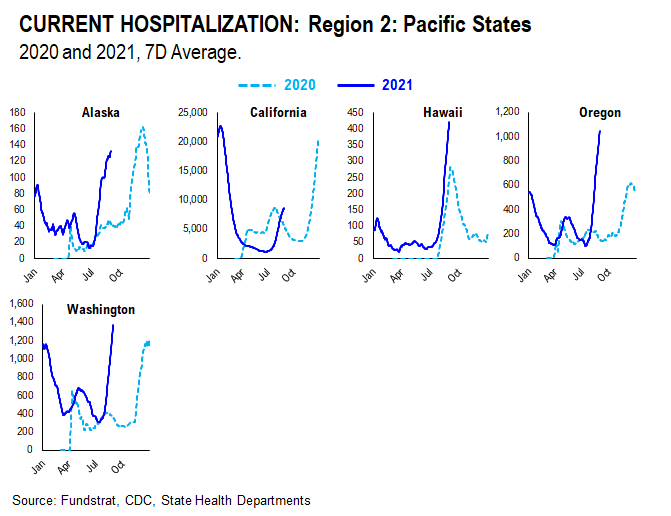
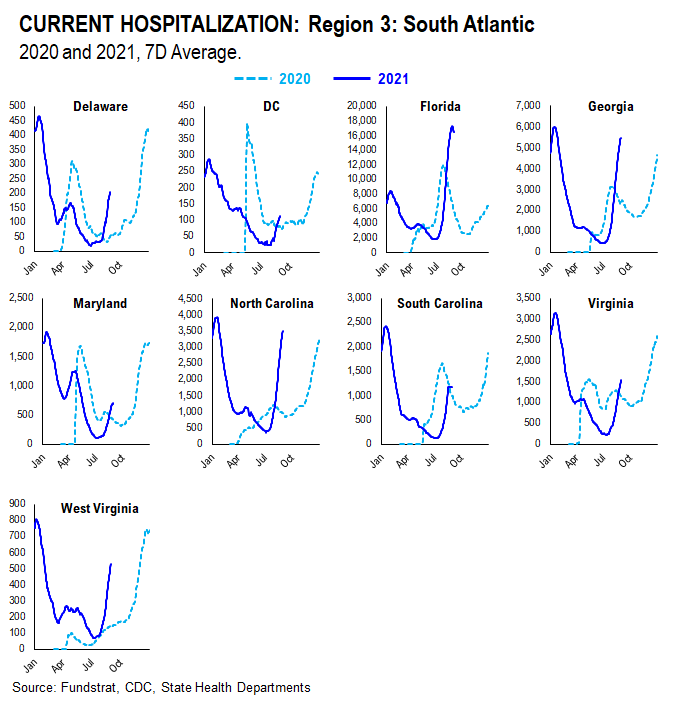
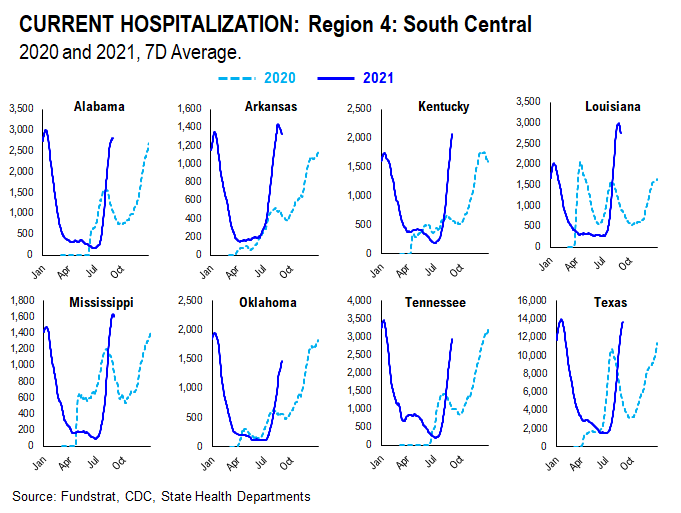
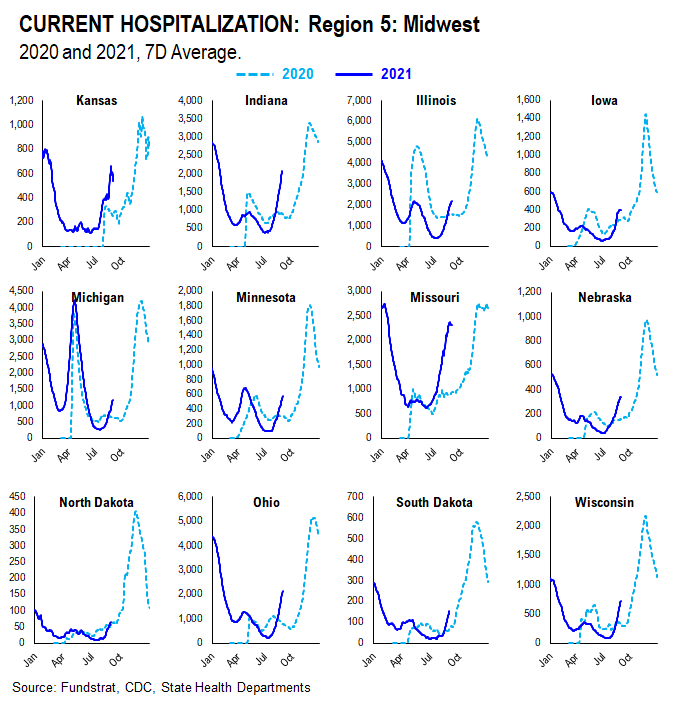
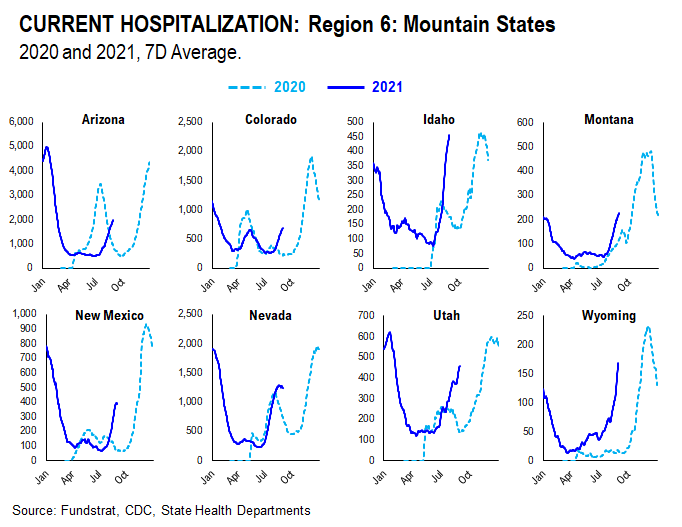
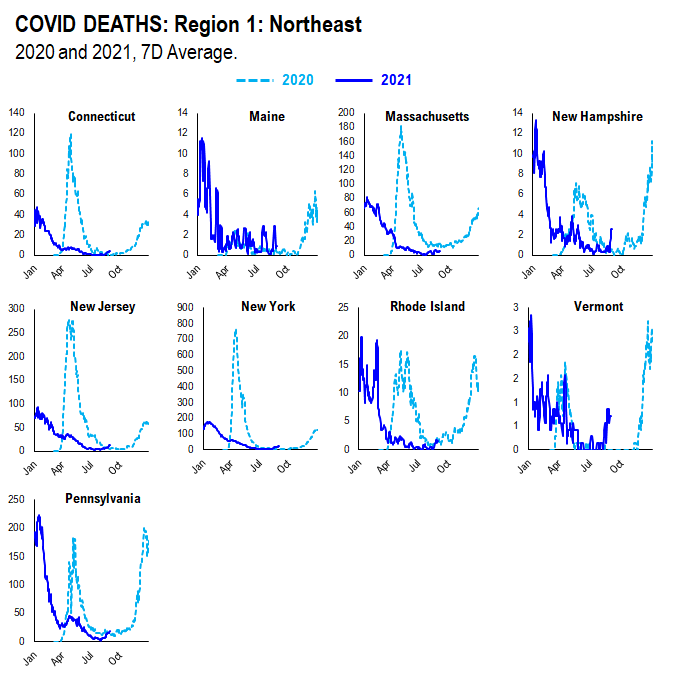
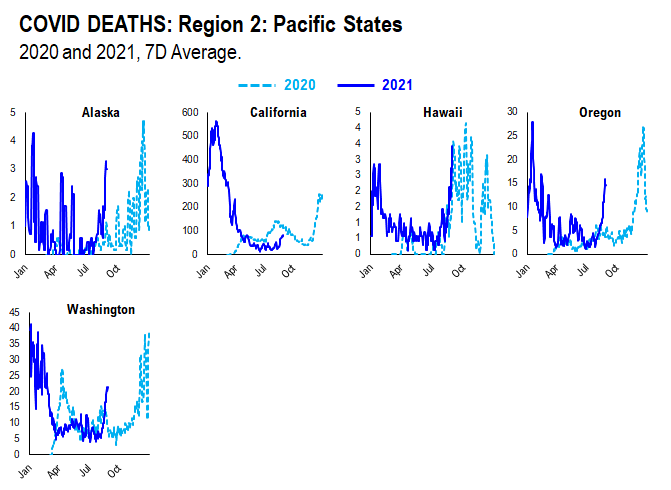
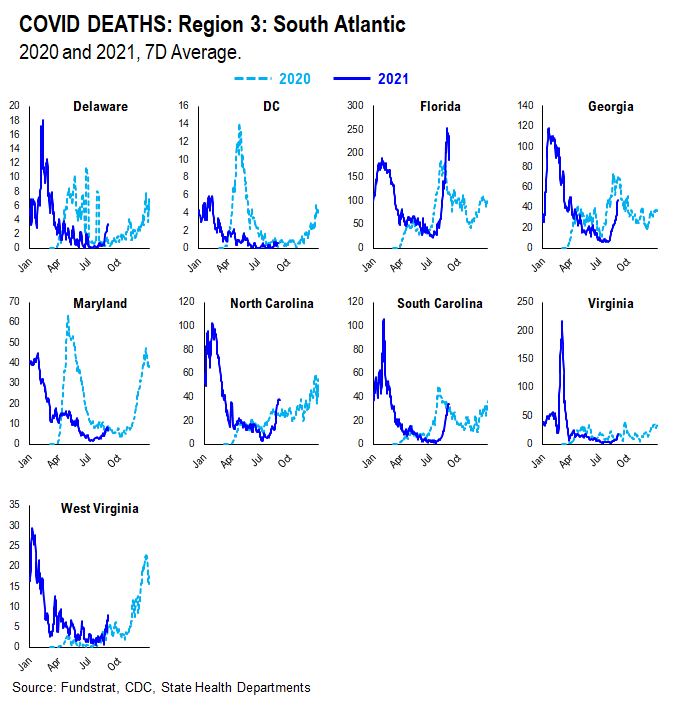
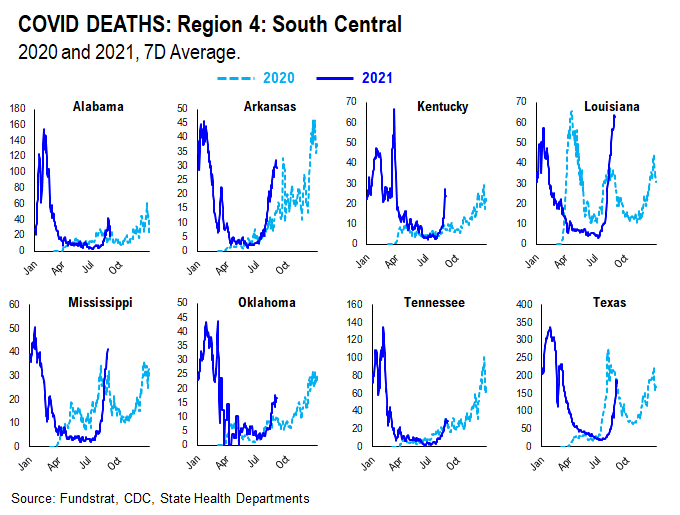
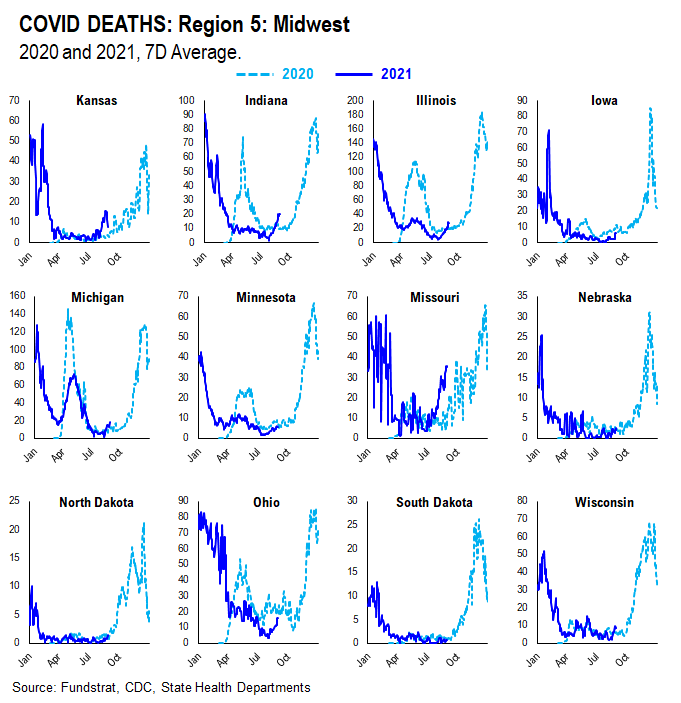
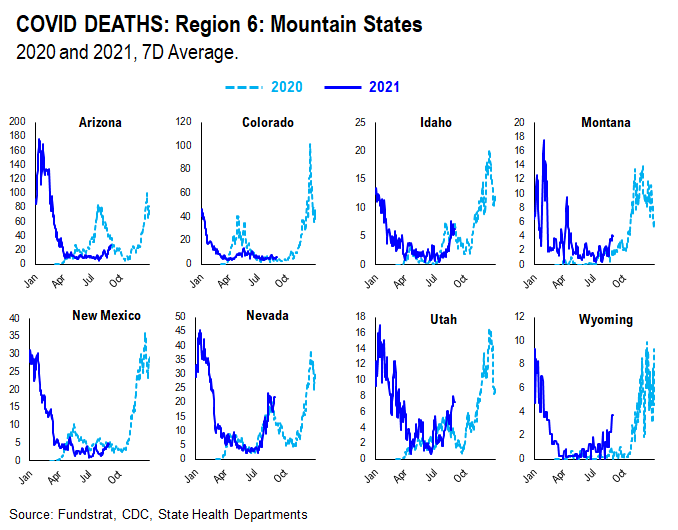
In July, we noted that many states experienced similar case surges in 2021 to the ones they experienced in 2020. As such, along with the introduction of the more transmissible Delta variant, seasonality also appears to play an important role in the recent surge in daily cases, hospitalization, and deaths. Therefore, we think there might be a strong argument that COVID-19 is poised to become a seasonal virus. The possible explanations for the seasonality we observed are:
– Outdoor Temperature: increasing indoor activities in the South vs increasing outdoor activities in the northeast during the Summer
– “Air Conditioning” Season: similar to “outdoor temperature”, more “AC” usage might facilitate the spread of the virus indoors
If this holds true, seasonal analysis suggests that the Delta spike could roll over by following a similar pattern to 2020.
We created this new section within our COVID update which tracks and compare the case, hospitalization, and death trends in both 2020 and 2021 at the state level. We grouped states geographically as they tend to trend similarly.
CASES
It seems as if the main factor contributing to current case trends right now is outdoor temperature. During the Summer, outdoor activities are generally increased in the northern states as the weather becomes nicer. In southern states, on the other hand, it becomes too hot and indoor activities are increased. As such, northern state cases didn’t spike much during Summer 2020 while southern state cases did. Currently, northern state cases are showing a slight spike, especially when compared to Summer 2020. This could be attributed to the introduction of the more transmissible Delta variant and the lifting of restrictions combined with pent up demand for indoor activities.
HOSPITALIZATION
Current hospitalizations appear to be similar or less than Summer 2020 rates in most states. This is likely due to increased vaccination rates and the vaccine’s ability to reduce the severity of the virus.
DEATHS
Current death rates appear to be scattered compared to 2020 rates. This is likely due to varying vaccination rates in each state. States with higher vaccination rates seem to have lower death rates given the vaccine’s ability to reduce the severity of the virus; states with lower vaccination rates seem to have higher death rates.


