-
Research
-
Latest Research
-
Latest VideosFSI Pro FSI Macro FSI Crypto
- Tom Lee, CFA AC
-
First WordFSI Pro FSI Macro
-
Intraday WordFSI Pro FSI Macro
-
Macro Minute VideoFSI Pro FSI Macro
-
OutlooksFSI Pro FSI Macro
- Mark L. Newton, CMT AC
-
Daily Technical StrategyFSI Pro FSI Macro
-
Live Technical Stock AnalysisFSI Pro FSI Macro
-
OutlooksFSI Pro FSI Macro
- L . Thomas Block
-
US PolicyFSI Pro FSI Macro
- Market Intelligence
-
Your Weekly RoadmapFSI Pro FSI Macro FSI Weekly
-
First to MarketFSI Pro FSI Macro
-
Signal From Noise
-
Earnings DailyFSI Pro FSI Macro FSI Weekly
-
Fed WatchFSI Pro FSI Macro
- Crypto Research
-
StrategyFSI Pro FSI Crypto
-
CommentsFSI Pro FSI Crypto
-
Funding FridaysFSI Pro FSI Crypto
-
Liquid VenturesFSI Pro FSI Crypto
-
Deep ResearchFSI Pro FSI Crypto
-
-
Webinars & More
- Webinars
-
Latest WebinarsFSI Pro FSI Macro FSI Crypto
-
Market OutlookFSI Pro FSI Macro FSI Crypto
-
Granny ShotsFSI Pro FSI Macro FSI Crypto
-
Technical StrategyFSI Pro FSI Macro FSI Crypto
-
CryptoFSI Pro FSI Macro FSI Crypto
-
Special GuestFSI Pro FSI Macro FSI Crypto
- Media Appearances
-
Latest Appearances
-
Tom Lee, CFA AC
-
Mark L. Newton, CMT AC
-
Sean Farrell AC
-
L . Thomas Block
-
⚡FlashInsights
-
Stock Lists
-
Latest Stock Lists
- Super and Sleeper Grannies
-
Stock ListFSI Pro FSI Macro
-
CommentaryFSI Pro FSI Macro
-
HistoricalFSI Pro FSI Macro
- SMID Granny Shots
-
Stock ListFSI Pro FSI Macro
-
PerformanceFSI Pro FSI Macro
-
CommentaryFSI Pro FSI Macro
-
HistoricalFSI Pro FSI Macro
- Upticks
-
IntroFSI Pro FSI Macro
-
Stock ListFSI Pro FSI Macro
-
PerformanceFSI Pro FSI Macro
-
CommentaryFSI Pro FSI Macro
-
FAQFSI Pro FSI Macro
- Sector Allocation
-
IntroFSI Pro FSI Macro
-
Current OutlookFSI Pro FSI Macro
-
Prior OutlooksFSI Pro FSI Macro
-
PerformanceFSI Pro FSI Macro
-
SectorFSI Pro FSI Macro
-
ToolsFSI Pro FSI Macro
-
FAQFSI Pro FSI Macro
-
-
Crypto Picks
-
Latest Crypto Picks
- Crypto Core Strategy
-
IntroFSI Pro FSI Crypto
-
StrategyFSI Pro FSI Crypto
-
PerformanceFSI Pro FSI Crypto
-
ReportsFSI Pro FSI Crypto
-
Historical ChangesFSI Pro FSI Crypto
-
ToolsFSI Pro FSI Crypto
- Crypto Liquid Ventures
-
IntroFSI Pro FSI Crypto
-
StrategyFSI Pro FSI Crypto
-
PerformanceFSI Pro FSI Crypto
-
ReportsFSI Pro FSI Crypto
-
-
Tools
-
FSI Community
-
FSI Snapshot
-
Market Insights
-
FSI Academy
-
Book Recommedations
- Community Activities
-
Intro
-
Community Questions
-
Community Contests
-
In an effort to expand the range of evidence-based research and investment tools available to Fundstrat clients, Fundstrat Capital LLC has launched the Fundstrat Granny Shots U.S. Large Cap ETF.
Granny Shots FAQ
What are Granny Shots?
Wilt Chamberlain is widely considered one of the greatest professional basketball players in history. He is also a cautionary tale for ‘macho-ness’ gone awry, and we are not even talking about his infamous womanizing. Chamberlain, already a great basketball player, likely would have been significantly better if he could have bitten his pride and used the under-handed, but also widely disparaged, ‘Granny Shot’—so named because it is likely how your Grandma would choose to shoot.
In fact, Chamberlain was a terrible free-throw shooter, so bad that he switched to the indecorous 'Granny Shot' for a season. Which season did he switch? Well, of course, the one in which he scored his famous hundred-point game (’61-’62), a performance that wouldn’t have been possible without this unsung free-throw method. Chamberlain normally shot about 50%, but when he switched to the underhanded shot, he made more free-throws in a single game than any player ever has; 28/32 for a success rate of nearly 90%.

Despite this success for the ages, Chamberlain would not permanently switch because he did not like the look of the shot. Shaq, a notoriously bad free-throw shooter, told former basketball and Granny Shot ambassador Rick Barry that he would rather shoot zero percent than look uncool. Barry, who has been trying to advocate for wider use of the shot for years describes his thoughts on the subject by saying “I really truly can’t comprehend the aversion that people have to try something that could be very effective for them. After all, the ultimate goal is to make the highest percentage you can!” We couldn’t agree more with Mr. Barry.
Unfortunately, we see many individual investors making a similar mistake of trying to be macho and not asking for help and having their returns suffer accordingly. Not asking for directions costs you a lot more in investing than it does in driving or basketball. Investing is far too serious to let it be adversely affected by the illogical attitude that leads to NBA players avoiding a shot that could result in more victories for their teams. This is the general idea behind our ‘ Granny Shots’ product.
Divorce Emotion In Your Investing Process, Take a Granny Shot
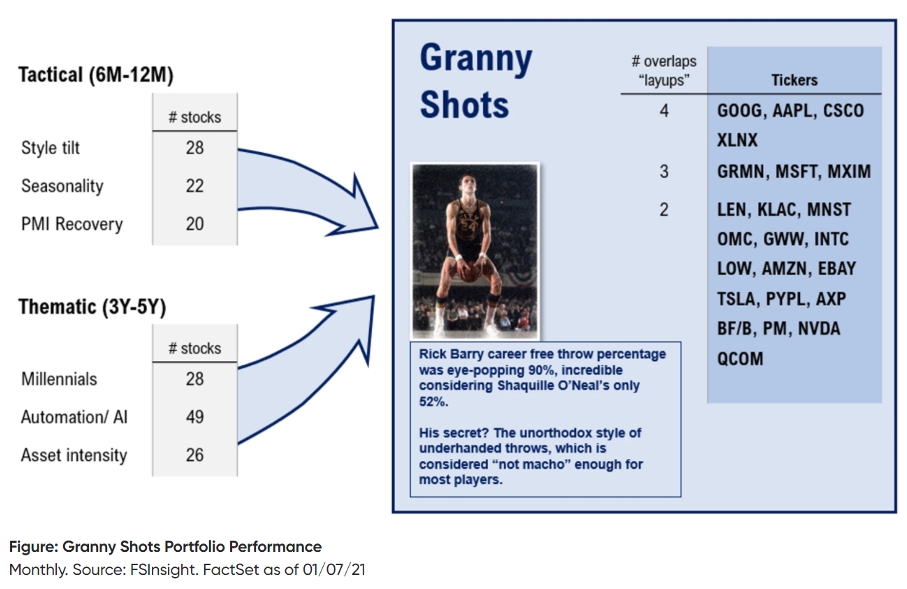
At FS Insight, we like to take diverse approaches to analysis and investing to maximize our returns. At any time, multiple forces will result in above-par growth for individual companies. Accordingly, we have three tactical portfolios and three strategic/thematic portfolios to take advantage of various economic tail-winds and changes that we think will significantly affect asset prices. We mix ample use of historical relationships with technical analysis and proprietary quantitative tools to try to identify these currents in the economy that we believe will positively affect certain stocks.
These allocations are just for example purposes. To view the most recent tickers please visit Granny Shots Stock List.
Our tactical portfolios have an investment horizon of six to twelve months. They are taking advantage of observed shorter-term trends in the economy. We also have our strategic portfolios that we think will benefit from more secular changes in the economy. When a stock is selected by more than one of these six methodologies, we add it to our list of "Granny Shots".
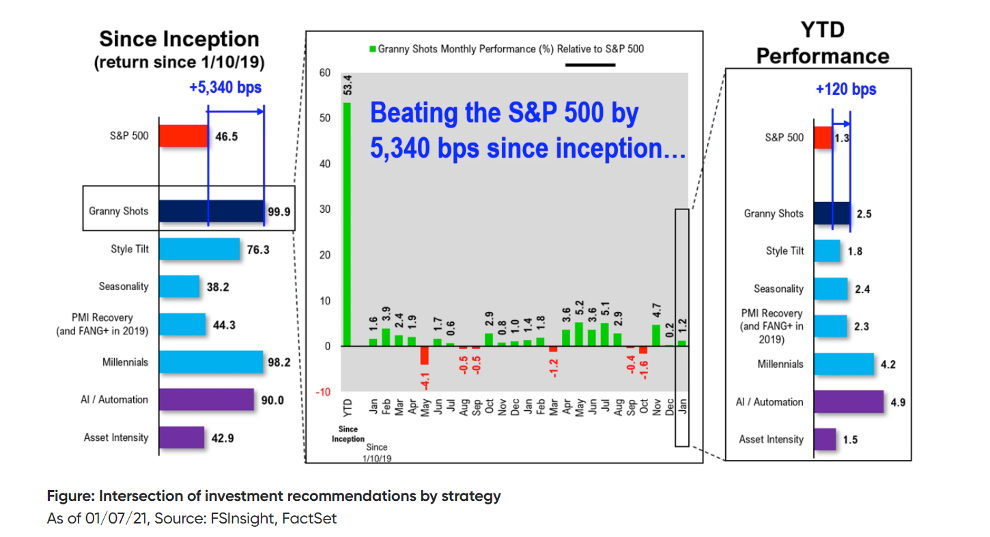
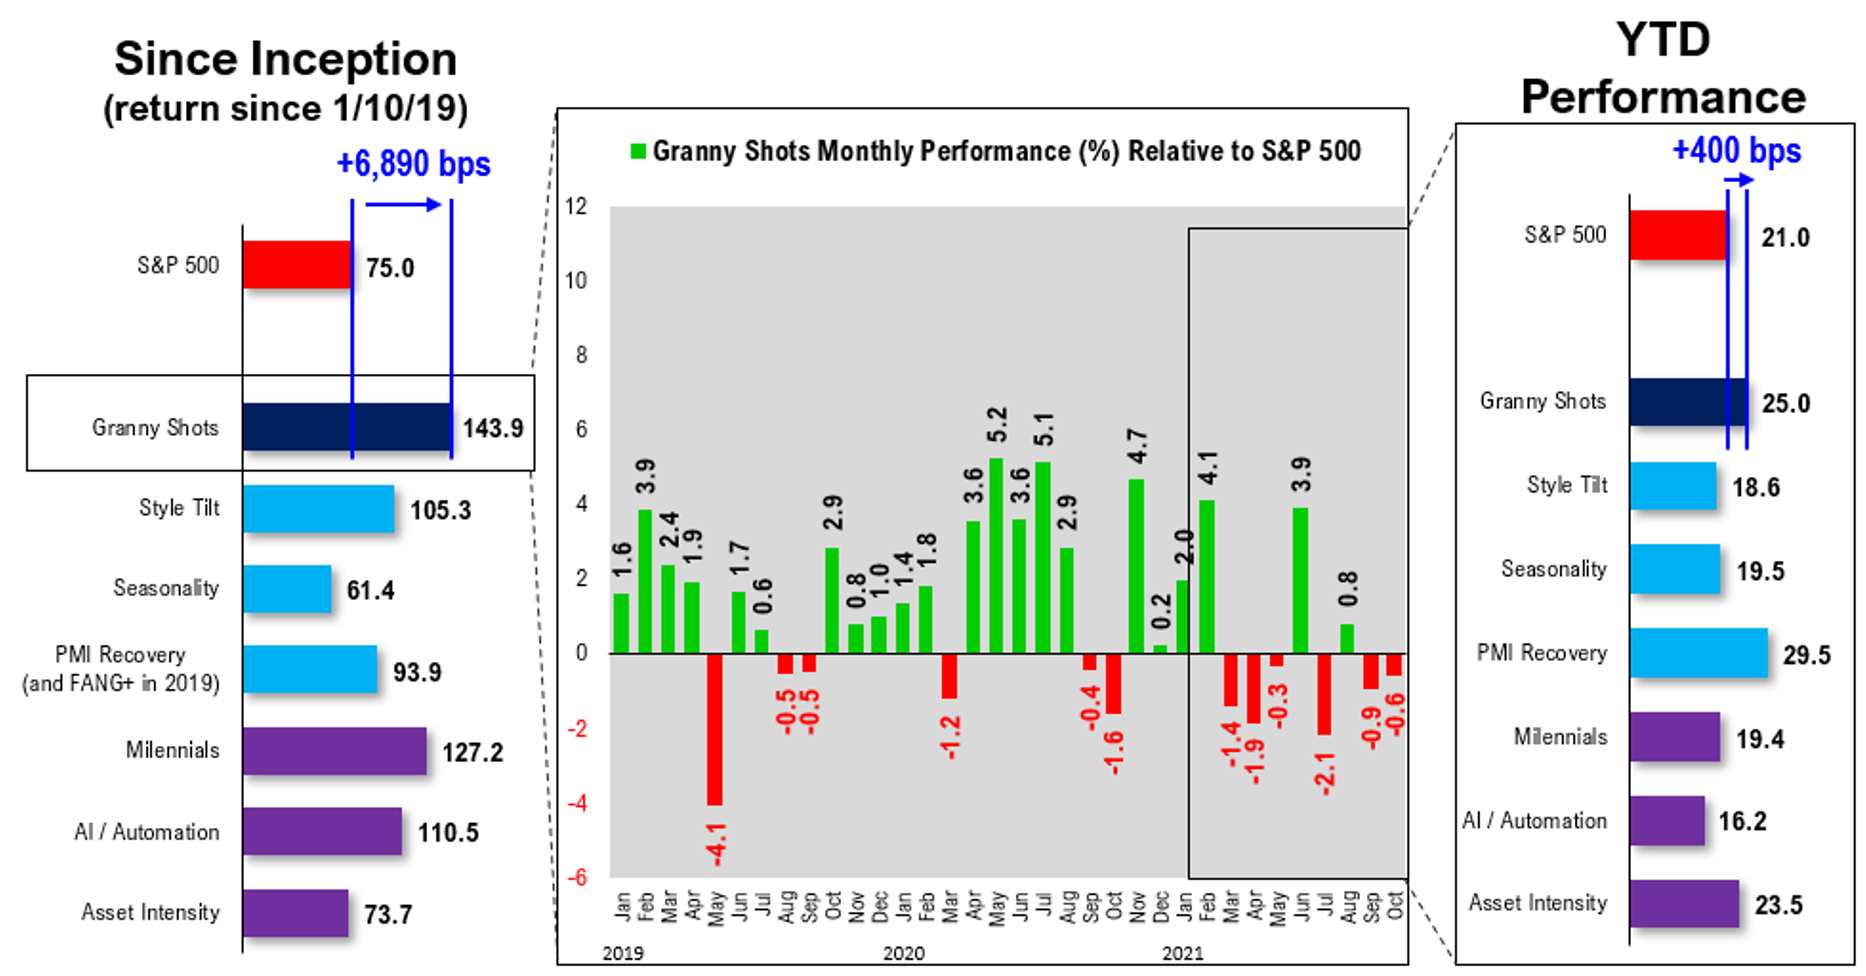
Figure: Granny Shots Portfolio Performance
Monthly. Source: FS Insight. FactSet as of 12/17/21
The logic behind this process is that stocks benefitting from multiple tactical and strategic macro-economic tailwinds should be poised to perform better than their peers. You don't have to take our word for it; check out the performance of our 'Granny Shots' compared to the S&P 500 since its inception (shown above). Stocks that meet more than two categories are generally even better bets. The Granny Shots methodology has identified some of the best-performing stocks of the last decade, including AAPL, GOOG, TSLA, and more.
What themes are involved in choosing Granny Shots stocks?
As noted, the Granny Shots portfolio contains stocks that appear in at least 2 of these 6 investment strategies, 3 tactical and 3 longer term. The tactical approaches are expected to capture exposure to the investment themes we favor for the next 6 to 12 months, while the longer term strategies are designed to capture the exposure for three to 5 years.
Tactical Strategies
Style Tilt
One of our tactical portfolios is our 'style-tilt.' While this is based on the main distinction in investment styles between Value and Growth stocks, it also has two more dimensions; defensive vs. cyclical and quality vs. non-quality.
Currently, we believe that that market will be led by Value stocks in cyclical sectors.
We have done much work on shifting leadership between value and growth investing strategies and generally find that macro-economic conditions favor stocks with reasonable valuations that typically benefit during periods of economic expansion. The 'New Seasonality,' our next tactical theme, is a major reason.
Seasonality
Seasonality usually refers to the natural changes that accompany the calendar-year. For example, certain goods' consumption tends to be higher around the holidays.
These factors are somewhat more predictable than many unforeseen, or exogenous, developments in markets.
Our Seasonality portfolio is somewhat like our style-tilt but drills down to the granular industry and sub-industry level to ascertain which of these should benefit from the current seasonal forces. We use multiple analytical approaches to detecting which industries have the highest likelihood of outperforming given seasonal currents in the economy.
PMI Recovery
The Purchasing Managers Index isn’t as complicated as it sounds. Basically, it surveys those in businesses responsible for purchasing working capital on their optimism for the future compared to the recent period.
If the PMI goes above 50, more managers feel optimistic about future prospects. We have looked throughout history and analyzed the PMI Index and economic activity.
Clearly, when PMI begins trading above 50, companies that benefit from expansive economic cycles tend to do better.
The PMI readings have recently indicated that many businesses are expecting a coming boom and economic normalization. Thus, we tilt heavily toward pure-cyclicals for this tactical portfolio.
Thematic Strategies
The Millennial Strategy
We will start with the secular trends that guide our strategic and thematic portfolios. We believe that many people often miss a key driving factor of markets, who exactly they are comprised of.
Millennials are the largest generation on Earth.
Their peak spending, borrowing, and earning years will soon be upon us. In addition to this, they will also be inheriting a massive amount of money, in the trillions, from the aging baby-boomers
As this massive boon in demand occurs in the economy, we think certain companies are particularly poised to achieve superior growth.
Global Labor Shortage and Rise Of AI/Automation
One of the main catalysts for global economic integration over the past decades was cheap and plentiful labor available to first-world firms in third-world countries.
This revolutionized supply-chains and lowered the costs of many products; it also may have contributed to staving off high inflation levels
However, this influential trend has recently been reversed. We estimate that by 2028 the global economy will be short nearly 80 million workers.
Does this mean AI/Automation will replace workers fully? Of course not; however, the labor shortage likely means that companies who have invested in the technology and software to act as a significant force-multiplier to their human capital will have better performance than those who have not. Companies supplying the new solutions in automation and artificial intelligence are also included in this thematic portfolio.
Asset Intensity
Last week, the 10-year Treasury went above 1% for the first time since COVID-19 roiled markets in February and March. There are many emerging inflationary forces and accommodation to them from the Fed. There are few more serious threats to investment returns than inflation. You will likely want to have some protection against what will likely be some of the highest inflation rates that we have seen in recent history. Many investors will have to ‘dust-off’ their inflation manuals since it hasn’t really been an issue for investors since the 1980s.
Thus, this strategy's thrust is going overweight stocks that are 'asset-heavy' instead of 'labor-intensive'. Due to FIFO Accounting, the appreciation of assets on balance sheets tends to make stocks benefitting from a lot of assets to outperform. Companies with many assets will benefit from them acting as a natural hedge against the devaluation of currency. Rising labor costs accompany rising inflation, which disproportionately hits companies that have a good portion of costs tied up in paying for labor. This economic current is the foundation of our third strategic thematic portfolio.
Events
Featured Research
Washed Out Stocks


Download our app to access all our research reports on your mobile device
This feature will send the report or video directly to your phone for easy viewing


Get invaluable analysis of the market and stocks. Cancel at any time. Start Free Trial
Create New Account
Complete the following information to create your account