VIDEO: NVDA set to report after the close Wed. Surprisingly, in the past 2 years, the broader market has not moved with NVDA. And small-caps actually did better post-results (duration 4:27).

This week, the equity market has played a waiting game for NVDA EPS (fiscal 2Q) results, which are released after the close Wed (8/28). There are many pundits who say the entire market direction hinges on how investors react to NVDA -1.30% results. While intuitively this makes sense (NVDA is the center of the AI thesis), some may be surprised to learn this has not been the actual case for the past 2 years.
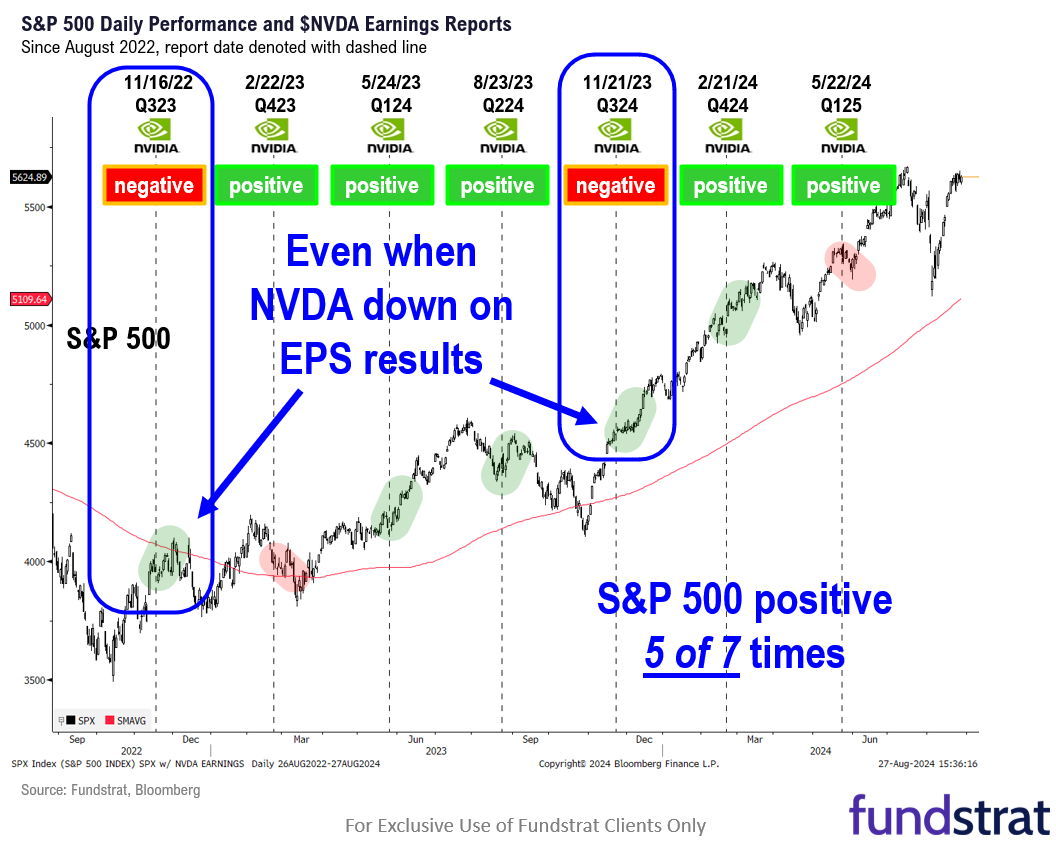
- Since the start of 2022, NVDA has seen its stock gain on 5 of the last 7 EPS reports. This is a good track record:
– 11/16/22 -1.46%
– 2/22/23 +14.02%
– 5/24/23 +24.37%
– 8/23/23 +0.10%
– 11/21/23 -2.46%
– 2/21/24 +16.40%
– 5/22/24 +9.32% - The S&P 500 has moved in the same direction as NVDA results only 3 of 7 times. That is less than “half” the time:
– the S&P 500 has gained in the 2 weeks post-EPS, 5 of the 7 times
– the two times NVDA fell (above), the S&P 500 actually gained
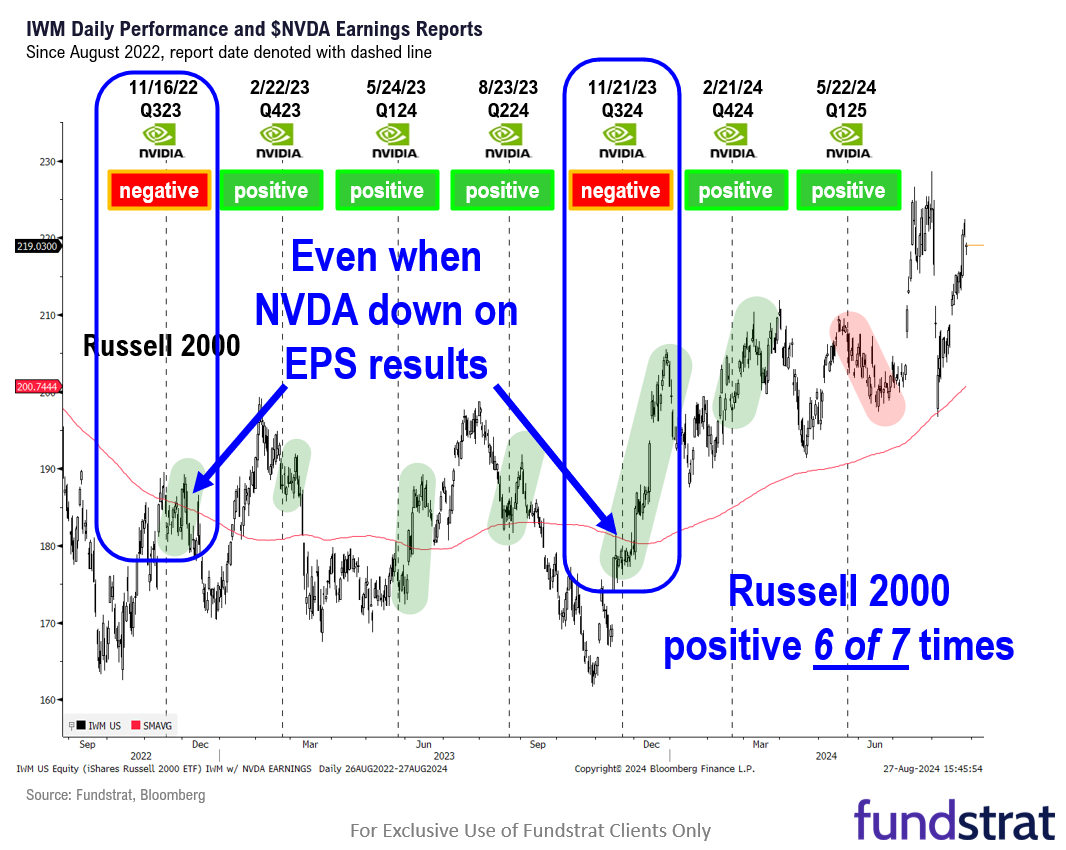
– in short, not as directionally dependent on NVDA - In this same timeframe, the Russell 2000:
– Russell 2000 gained 6 of 7 times
– both times NVDA fell (above), Russell 2000 gained
– Russell 2000 had sizable gains even when NVDA fell
– only this past May 2024 did Russell 2000 fall (NVDA gained +9%) - This is past performance so the future might be different, but we have two takeaways:
– broader market not as directionally sensitive to NVDA results
– Russell 2000 has been the better bet past 2 years - Both of the above points are not what many expect. In fact, I suspect most investors would have the exact opposite viewpoints. But we will see what happens when NVDA reports.
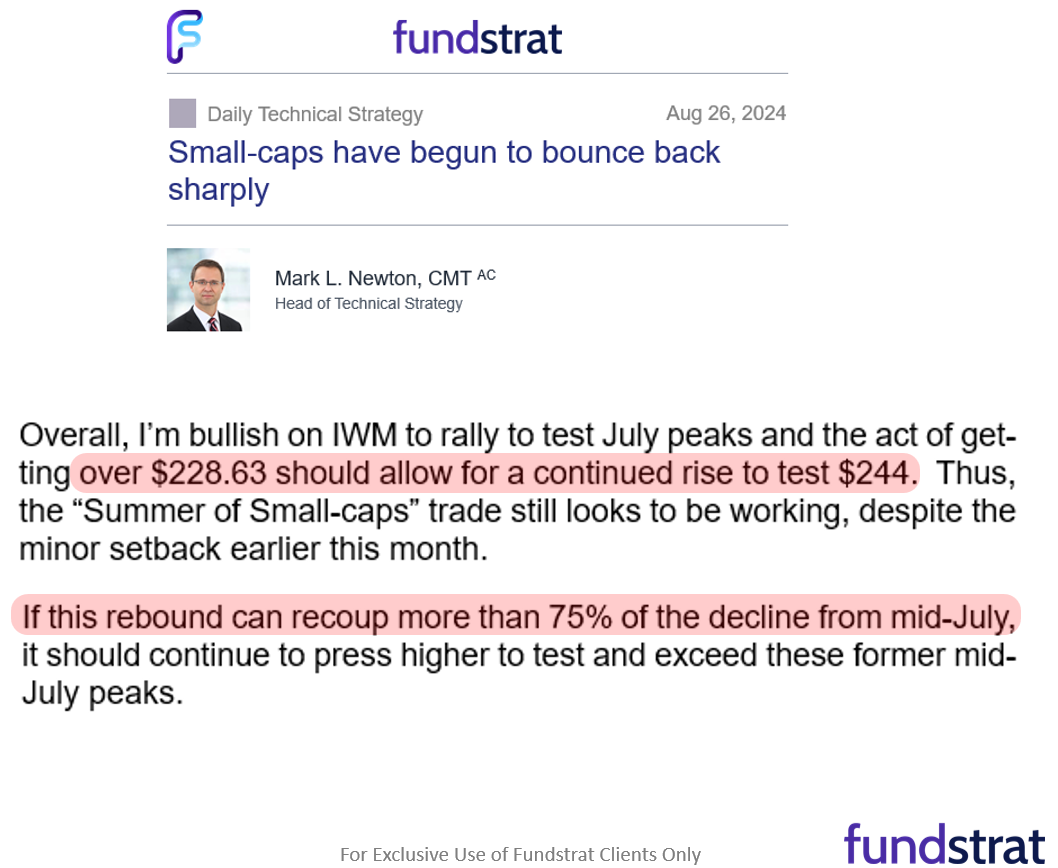
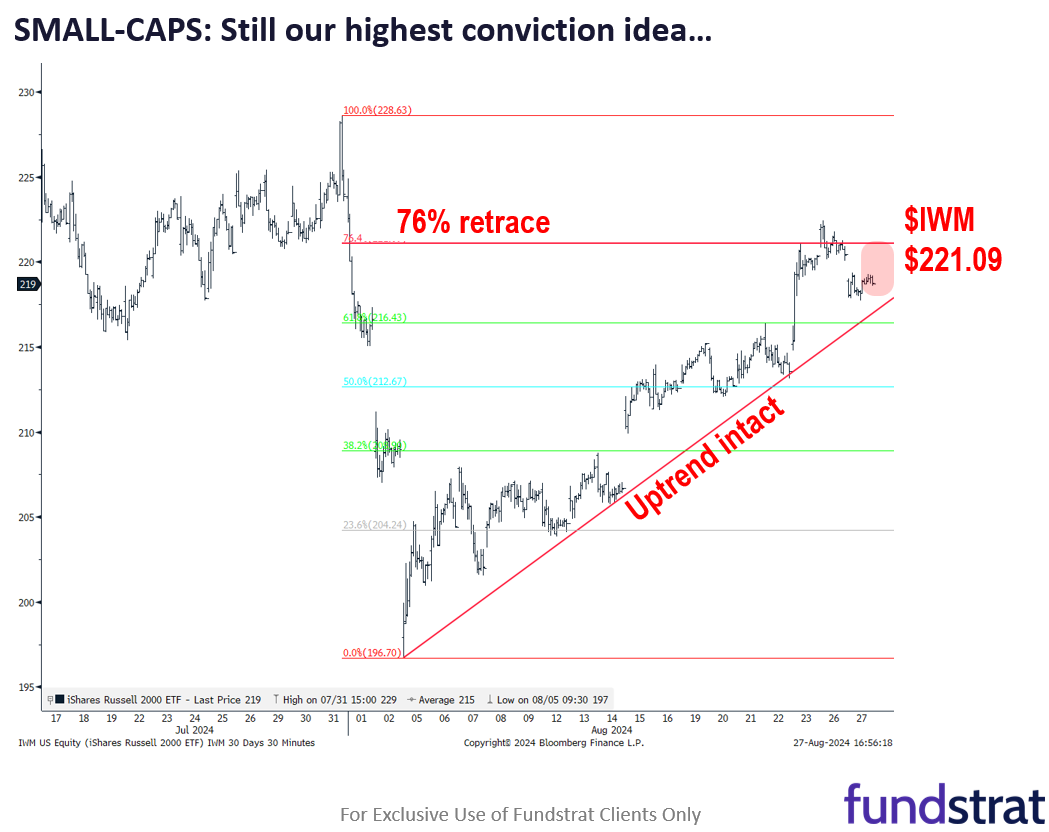
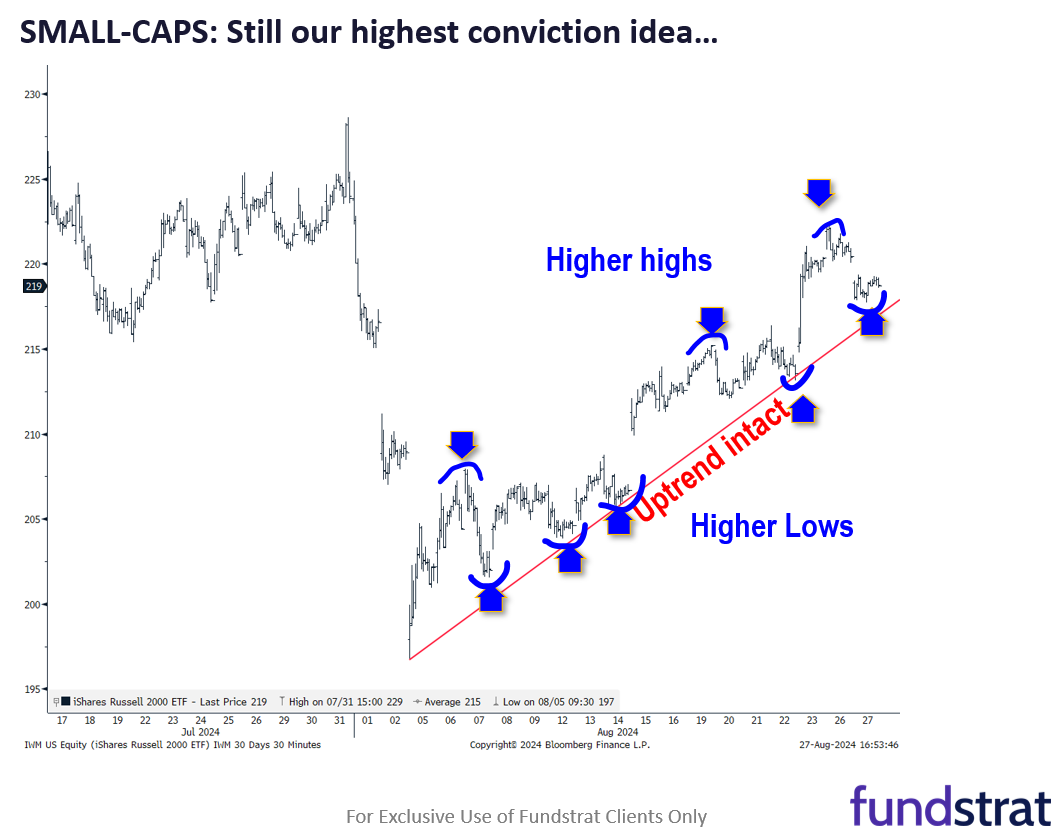
- Per Mark Newton, technically, small-caps remain attractive and the level he is watching is closing above $221 for IWM -0.33% . That would be a 76% retracement of the decline from late July.
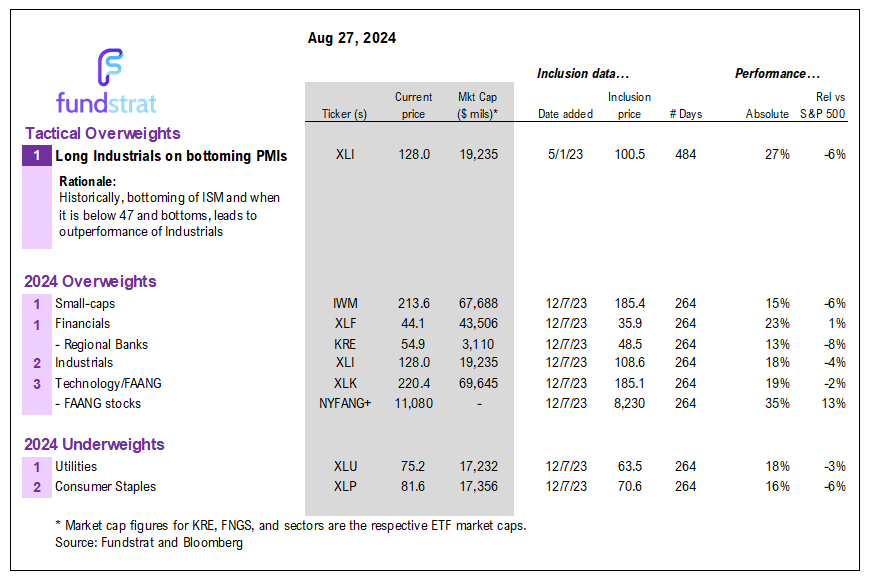
- In our view, the Fed has implicitly reinstated the “put” on asset markets as the Fed wants to keep labor markets strong. This is most supportive of cyclical stocks XLI 0.11% and XLF -0.22% and small-caps and regional banks KRE -0.53% . And we see the most upside with small-cap stocks. Hence, the reason small-caps remain one of our top ideas for the next 2 years. And we still continue to like them, even as they have been choppy. And we get a lot of pushback.
- As for the macro data this week, it has been mostly positive vs consensus:
– 8/26 Mon 8:30 AM ET: Jul P Durable Goods Orders 9.9% vs 4.9%e
– 8/26 Mon 10:30 AM ET: Aug Dallas Fed Manuf. Activity Survey -9.7 vs -16e
– 8/27 Tue 9:00 AM ET: Jun CS 20-City home price MoM 0.42% vs 0.30%e
– 8/27 Tue 10:00 AM ET: Aug Conference Board Consumer Confidence 103 vs 101e
– 8/28 Wed 4:20 PM ET: NVDA Reports Q2 ‘25 Earnings
– 8/29 Thu 8:30 AM ET: 2Q S 2024 GDP QoQ 2.8%e
– 8/30 Fri 8:30 AM ET: Jul Core PCE 0.17%e
– 8/30 Fri 10:00 AM ET: Aug F U. Mich. 1yr Inf Exp - This Friday is the most important data which is July PCE.
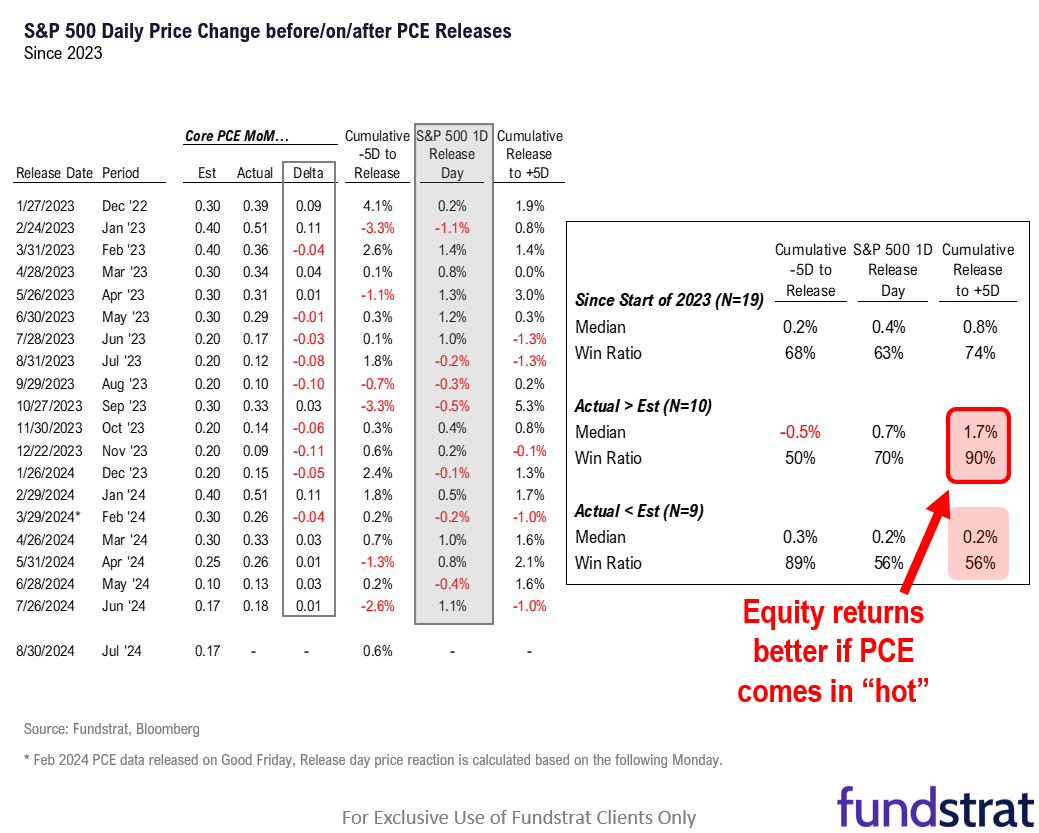
- We will discuss this further as we get closer to Friday, but it may surprise investors that equities traded better when Core PCE is “hot” vs expectations. Meaning, stocks do better when there is more inflation in the month:
– 5D return post-PCE release
– when actual > estimate (“hot”): +1.7%, 90% win-ratio
– when actual < estimate (“cool”): +0.2%, 56% win-ratio - The stats show a counterintuitive outcome. But this is how markets work. And as noted earlier, the S&P 500 is not really moving directionally with NVDA results. And small-caps do better post-NVDA (also counterintuitive).
BOTTOM LINE: Evidence growing that equities made their summer lows on 8/5.
Generally, August to October is a tough period for markets. One important client, ES of NY, has repeatedly mentioned to me “I never make money in August.” And that is consistent with the view of Mark Newton, Head of Technical Strategy, that Aug to Oct is window where stocks’ risk/reward is less attractive than the period post-election.
- Since 1928, however, of that period between August to October, the S&P 500 has bottomed most commonly during August.
– August, Sept and Oct low %: 44%, 17%, 40%
– meaning, markets most likely bottom in August (for that period) - Guess what is the most common week for the bottom?
– the first week of August
– 15 of the 96 years - Lastly, we need to be mindful that Iran could launch an attack this week, in response to several high profile assassinations. The Olympics ended August 11. So, markets are naturally wary of the headline risk from this. But we know the adage:
– “sell the build-up, buy the invasion” - The only thing is that at the start of the Russia-Ukraine war, markets had a short relief rally. But that war has since become a larger and most costly conflict. So, problems percolating in the Middle East are not to be taken lightly.
- But just because markets might have some headwinds near term does not change the probabilities of a strong second half. As we noted previously:
– Since 1950, when S&P 500 is up >10% in the first half
– 23 instances
– 2H (second half) gains +9.8%, 83% win-ratio
– the 4 negative 2H instances were 1975, 1983, 1986, 1987
– essentially, all the negative 2H were during Volcker era
Bottom line, markets are certainly showing strong signs of gaining their footing. And we also view this panic as ultimately being a growth scare (coupled with a carry trade unwind).
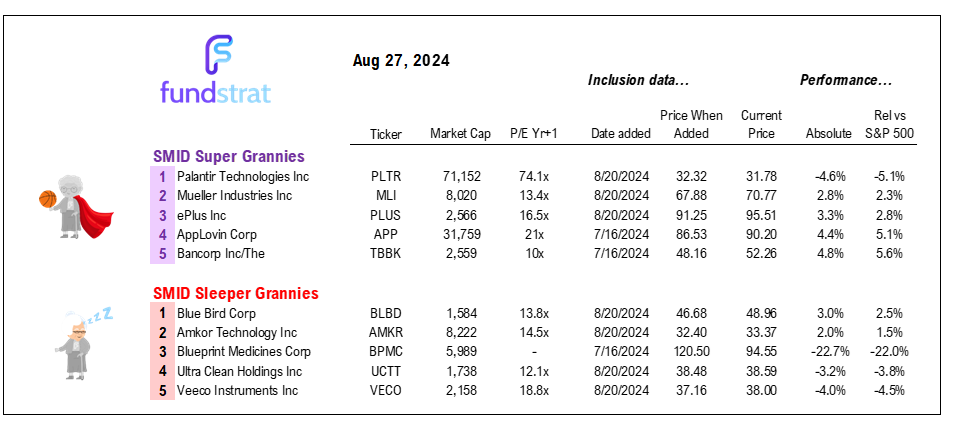
42 SMID GRANNY SHOTS: Updated list is below
SMID grannies are small and mid-cap stocks that appear in at least 2 of our 7 investment strategies.
- We believe the SMID granny shots could benefit from the multiple themes and secular tailwinds.
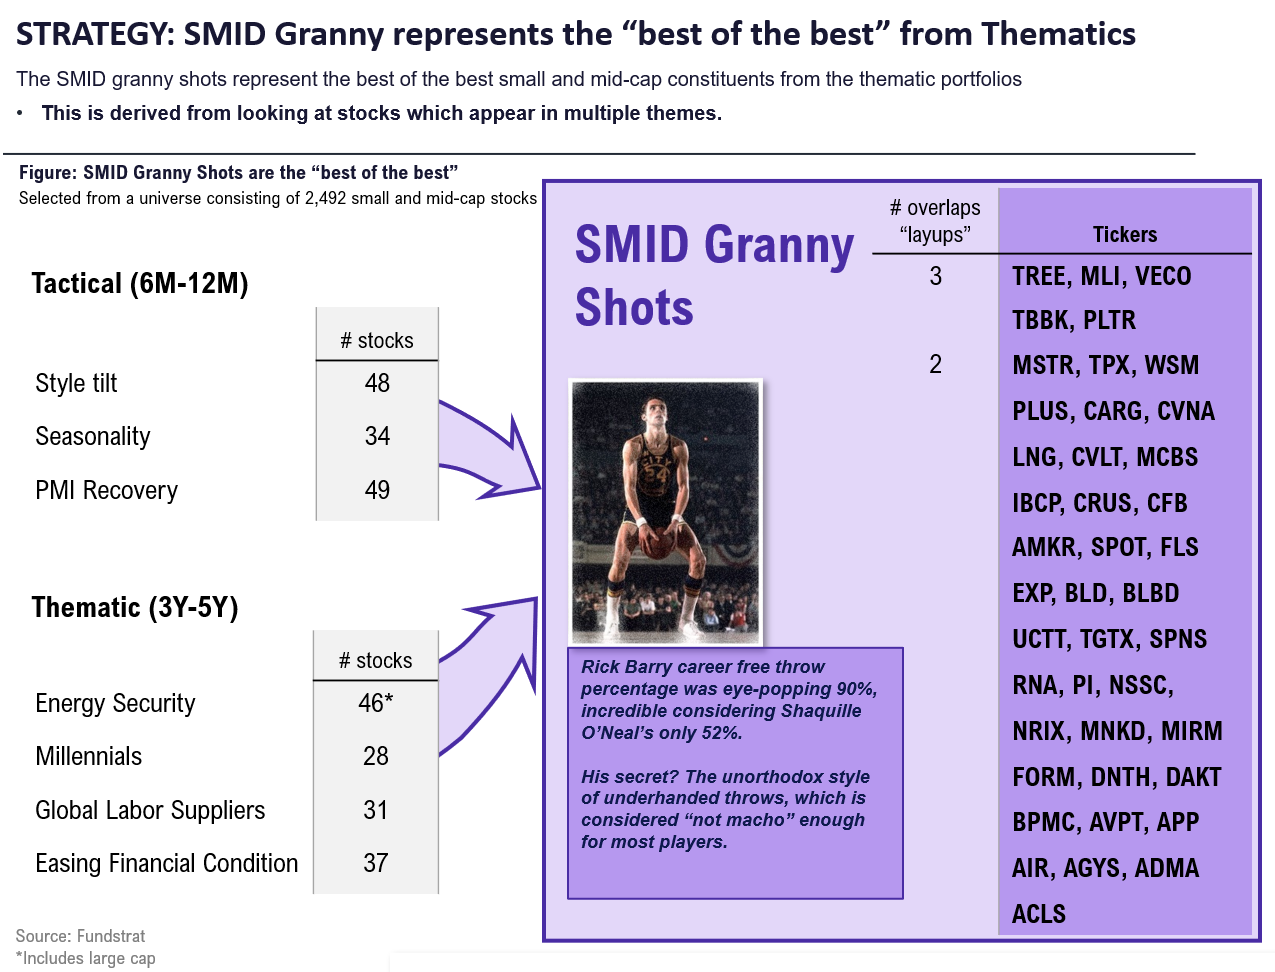
The Current Portfolio as of 7/16 is as follows (new additions in Bold):
Consumer Discretionary: BLD, CVNA, TPX, WSM
Industrials: ACLS, AIR, BLBD, FLS, MLI
Information Technology: AGYS, AMKR, APP, AVPT, CRUS, CVLT, DAKT, FORM, MSTR, NSSC, PI, PLTR, PLUS, SPNS, UCTT, VECO
Communication Services: CARG, SPOT
Materials: EXP
Energy: LNG
Financials: CFB, IBCP, MCBS, TBBK, TREE
Healthcare: ADMA, BPMC, DNTH, MIRM, MNKD, NRIX, RNA, TGTX

_____________________________
42 SMID Granny Shot Ideas: We performed our quarterly rebalance on 7/16. Full stock list here -> Click here
______________________________
PS: if you are enjoying our service and its evidence-based approach, please leave us a positive 5-star review on Google reviews —> Click here.
___________________________
Key incoming data August 2024:
8/1 8:30 AM ET: 2Q P Nonfarm ProductivityTame8/1 8:30 AM ET: 2Q P Unit Labor CostsTame8/1 9:45 AM ET: Jul F S&P Global Manufacturing PMITame8/1 10:00 AM ET: Jul ISM Manufacturing PMITame8/2 8:30 AM ET: Jul Jobs ReportTame8/2 10:00 AM ET: Jun F Durable Goods OrdersTame8/5 9:45 AM ET: Jul F S&P Global Services PMITame8/5 10:00 AM ET: Jul ISM Services PMITame8/6 8:30 AM ET: Jun Trade BalanceTame8/7 9:00 AM ET: Jul F Manheim Used vehicle IndexMixed8/12 11:00 AM ET: Jul NY Fed 1yr Inf ExpTame8/13 6:00 AM ET: Jul Small Business Optimism SurveyTame8/13 8:30 AM ET: Jul PPITame8/14 8:30 AM ET: Jul CPITame8/15 8:30 AM ET: Jul Retail Sales DataTame8/15 8:30 AM ET: Aug Empire Manufacturing SurveyTame8/15 8:30 AM ET: Aug Philly Fed Business OutlookTame8/15 10:00 AM ET: Aug NAHB Housing Market IndexTame8/15 4:00 PM ET: Jun Net TIC FlowsTame8/16 10:00 AM ET: Aug P U. Mich. Sentiment and Inflation ExpectationTame8/19 9:00 AM ET: Aug M Manheim Used vehicle indexTame8/21 2:00 PM ET: Jul FOMC Meeting MinutesDovish8/22 8:30 AM ET: Jul Chicago Fed Nat Activity IndexTame8/22 9:45 AM ET: Aug P S&P Global Manufacturing PMITame8/22 9:45 AM ET: Aug P S&P Global Services PMITame8/22 10:00 AM ET: Jul Existing Home SalesTame8/23 10:00 AM ET: Jul New Home SalesTame8/26 10:00 AM ET: Jul P Durable Goods OrdersMixed8/26 10:30 AM ET: Aug Dallas Fed Manuf. Activity SurveyTame8/27 9:00 AM ET: Jun S&P CoreLogic CS home priceTame- 8/27 10:00 AM ET: Aug Conference Board Consumer Confidence
- 8/29 8:30 AM ET: 2Q S 2024 GDP
- 8/30 8:30 AM ET: Jul PCE Deflator
- 8/30 10:00 AM ET: Aug F U. Mich. Sentiment and Inflation Expectation
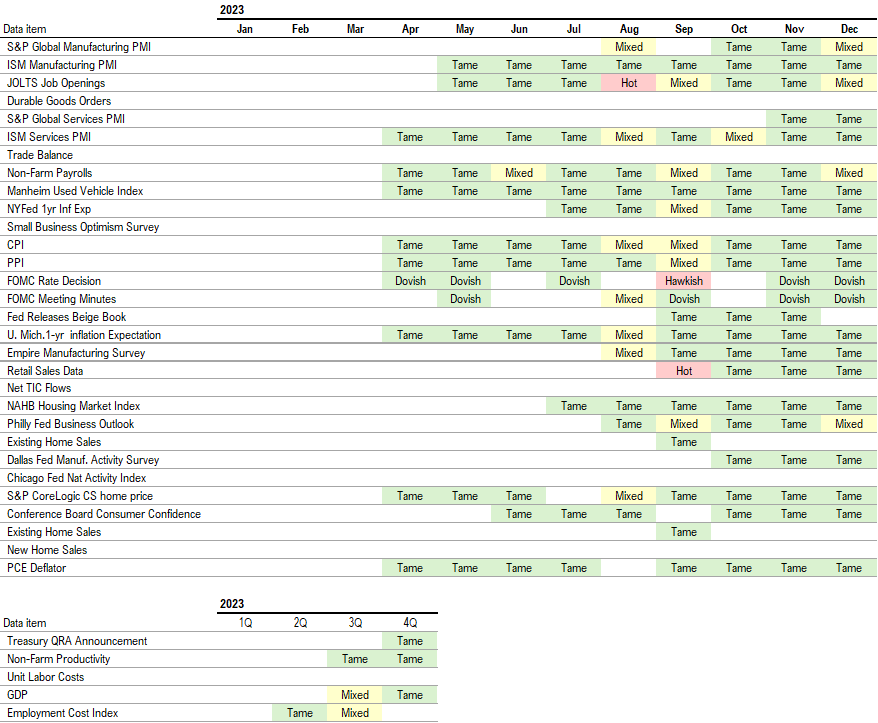
Economic Data Performance Tracker 2024:
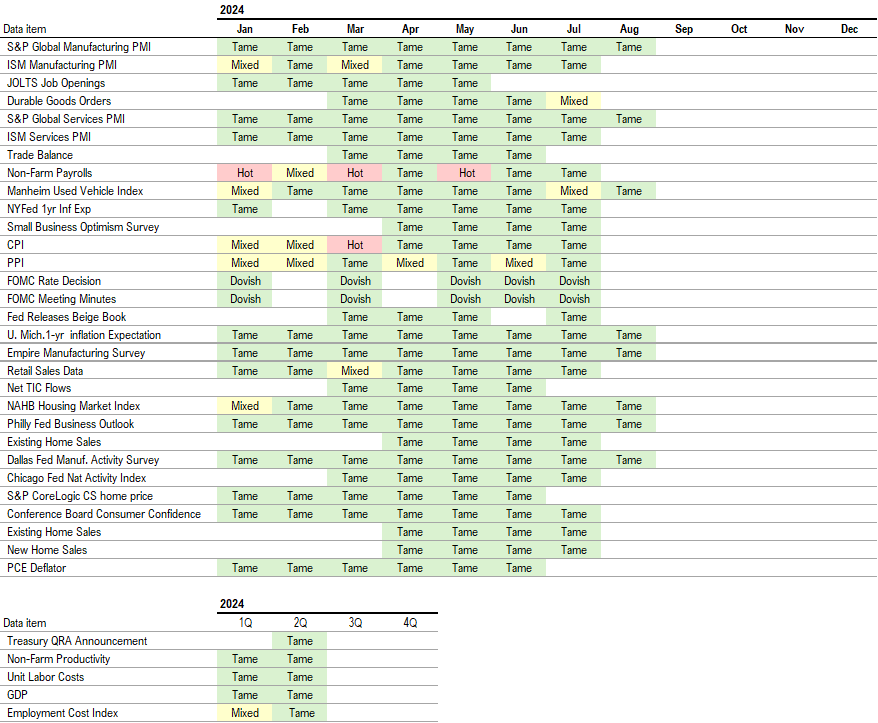
Economic Data Performance Tracker 2023: