


The S&P 500 momentarily broke 5,000 for the first time on Thursday (5,000.40, to be precise) before breaching that level more assertively on Friday to close above the 5,000 threshold for the first time. In the near term, Fundstrat Head of Research Tom Lee is more interested in “how equities behave after reaching 5,000 in the near term,” he told us. In the longer view, however, he said, “This is only a round number, and it does not bear true significance,” he said.
Aside from the S&P 500, Nasdaq and the Russell 3000 are also in new all-time high territories, as Head of Technical Strategy Mark Newton pointed out in our weekly huddle. “A lot of people like to make excuses as to markets having thin breadth, which is true – this rally has largely been carried by only a few stocks. But it’s still very, very difficult to fade markets when they are at new highs,” he said.
Adding to Newton’s brightening view of the market, “There are now other sectors starting to reignite and hit new highs.” One example? “Healthcare is the second largest sector within the S&P, and it is now back into all-time high territory after almost a two-year period of sideways chop, so this certainly is a bullish sign and one reason why I went to Overweight on Healthcare, joining Tom – at least for now.” In fact, Newton suggested, “if you’re looking to diversify outside of Technology, Healthcare and Industrials would be my picks – both sectors look phenomenal.”
We passed the midpoint of earnings season this week, and thus far, Lee sees it as being “stronger than it looks.” In fact, he describes it as being “very strong.” He acknowledges that the increase in earnings estimates is more modest than it has been over the past 15 years (S&P 500 4Q23 EPS is tracking towards $54.00, up +0.70% from the beginning of 2023). However, this figure was blunted by the impact on large banks’ earnings after they were assessed a one-time $23 billion fee by the Federal Deposit Insurance Corporation (FDIC) to cover the costs of the 2023 regional bank bailout. Excluding Financials, EPS is tracking 3.6% higher than it was at the beginning of the year, Lee’s team found – above the 3.2% long-term average.

Chart of the Week
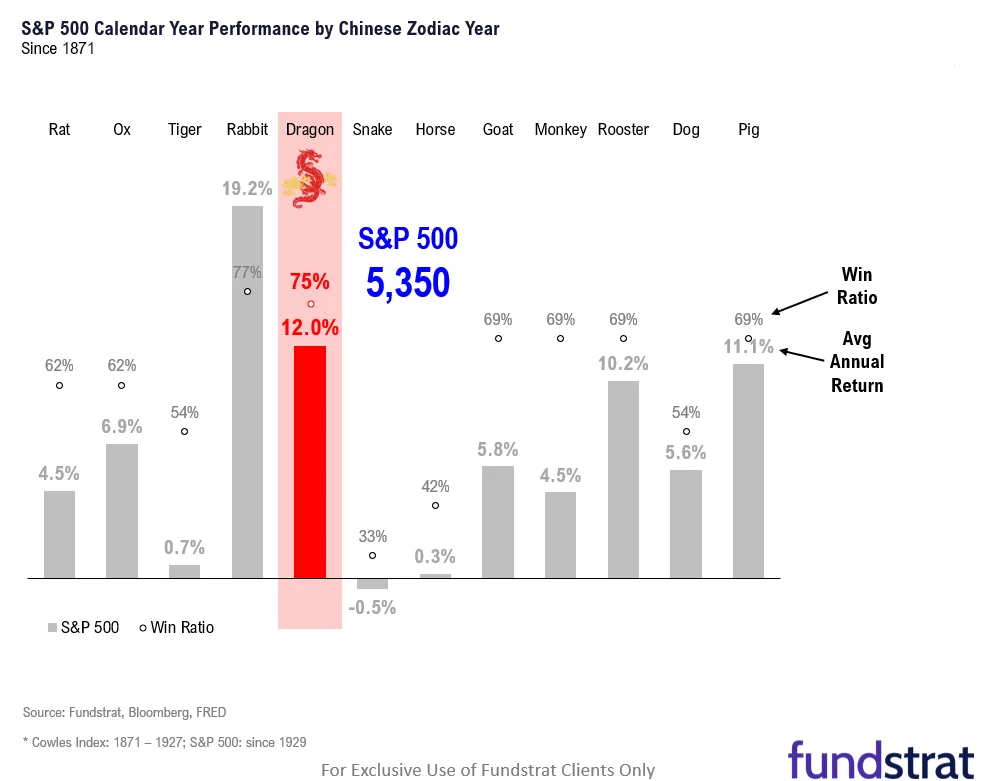
Lunar New Year was Saturday, as the Year of the Dragon commenced. Historically, the Year of the Dragon has been the second-strongest of the years on the 12-animal cycle for the S&P 500, with an average return of 12.0%, a median of 12.7%, and a win ratio of 75%. Only the Year of the Rabbit, which we just exited, has a stronger history for the S&P 500. As Lee pointed out, a median 12.7% in Dragon years implies that the S&P 500 could reach 5,350-5,400 by the end of the year, an upside to his 5,200 base case. 恭喜發財 — Gung Xi Fa Cai!
Recent ⚡ FlashInsights
[fsi-flash-insights]
FSI Video: Weekly Highlight

Key incoming data
2/05 9:45am ET S&P Global Services & Composite PMI January FinalTame2/05 10am ET January ISM ServicesTame2/07 9am ET Manheim Used Vehicle Index January FinalTame2/09 CPI RevisionsTame- 2/13 8:30am ET January CPI
- 2/14 PPI Revisions
- 2/15 8:30am ET February Empire Manufacturing Survey
- 2/15 8:30am ET February Philly Fed Business Outlook Survey
- 2/15 8:30am ET January Retail Sales Data
- 2/15 10am EST February NAHB Housing Market Index
- 2/16 8:30am ET January PPI
- 2/16 8:30am ET February New York Fed Business Activity Survey
- 2/16 10am ET U. Mich. Sentiment and Inflation Expectation February Prelim

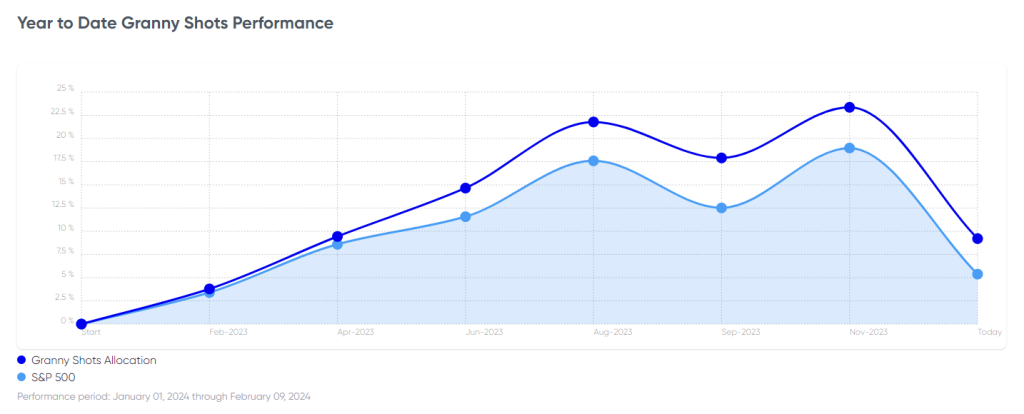
Stock List Performance
In the News
[fsi-in-the-news]


