
“Magnificent 7” was a term invented by BofA analysts to describe some of the largest percentage weightings among large-cap Technology stocks that make up SPX and QQQ, largely found in Technology and Consumer Discretionary. These seven are: MSFT, GOOGL, AMZN, AAPL, META, NVDA, and TSLA. This week, five of the seven are due to report earnings, which represents a significant week potentially for SPX.
SPX and QQQ at new all-time high territory has not yet been followed by similar movement from Russell 3k, Value Line Average, and DJ Transportation Avg, and this divergence will be important to concentrate on in the weeks ahead. Technology remains an outperformer after its recent breakout while Financials are starting to play “Catch-up”. Meanwhile, defensive sectors like Utilities, Staples are all starting to show evidence of hitting support, and likely are close to turning higher. Breadth has been waning in recent weeks while US Dollar and Treasury yields have begun to press higher which likely could bring about an upcoming consolidation for US Equities. At present, trends are bullish and trend reversals require a close back under 1/12/24 peaks to have even short-term concern. (SPX-4802.40). Upside resistance could materialize in the short run at 4937-4995 this week.
This week’s earnings from some of the market behemoths coupled with the Quarterly Treasury Refunding along with the FOMC meeting make this a very important week to pay attention to.
Technically speaking, I have discussed some of the issues of this recent rally having been dominated by Large-cap performance, and specifically by NVDA 0.53% , MSFT -0.02% gains thus far in 2024.
Specifically, the divergence between Large-cap and Small-cap performance is a bit troubling on this recent move back to new all-time highs for SPX and QQQ. Furthermore, breadth data has largely been waning since mid-December, and has not dramatically improved over the past week. Additionally, cycles, which had indicated a possible turn lower into February thus far, have not acted as planned, despite some definite evidence of a few sectors having stalled out, namely Industrials, Consumer Discretionary, and Healthcare. As had been discussed, this period leading into end of January has some time-based relationships to prior lows made in late October as well as former peaks from late July 2023, and this window has not really passed. Finally, Treasury yields and the US Dollar have been trending higher since late December, and the correlation between Treasuries and SPX has shown some minor decoupling in recent weeks.
Financials, to their credit, have been improving nicely in recent weeks and this sector along with Technology represent an important ~40% of SPX, which certainly is not insignificant.
However, a broad-based rally will be necessary to have more conviction that an uninterrupted rally can happen and barring an immediate snapback higher in some of the recent lagging sectors, at least a minor peak looks like a possibility this week as SPX moves up towards 5000, with key levels for this week targeting SPX-4937, 4966, or 4995. Each of those levels is generated based on my electronic Square of Nine chart which was invented initially by W.D. Gann.
Unfortunately for the bears, I don’t suspect much will come of any correction at present, and any pullback likely does not undercut former early January highs near 4802, which is an important level from a wave perspective.
FactSet data projects NVDA, AMZN, META, and GOOGL could also lead S&P 500 earnings growth for the first quarter of 2024, with estimated Year-over-year earnings growth of 79.9%. In comparison, the other 496 companies of S&P 500 are projected to report a +0.3% rise for the same period.
I’ll discuss a few of the shorter-term charts which have some relevance with regards to SPX for this week.
S&P 500 Futures shown below on hourly charts, do not show any evidence of why a peak would happen into earnings for Tuesday. This recent base from mid-January has not been exceeded as of today. However, from a counter-trend perspective, one can make the argument of upcoming exhaustion by 60-minute and 120-minute charts this week while daily SPX might record its first 9-13-9” pattern since late October 2023. (TD Sell Setup followed by a TD 13-Countdown, followed by another TD Sell Setup.)
Overall, I suspect that short-term upside likely proves minimal. However, this won’t represent a big shorting opportunity, but likely just a minor “backing and filling.”
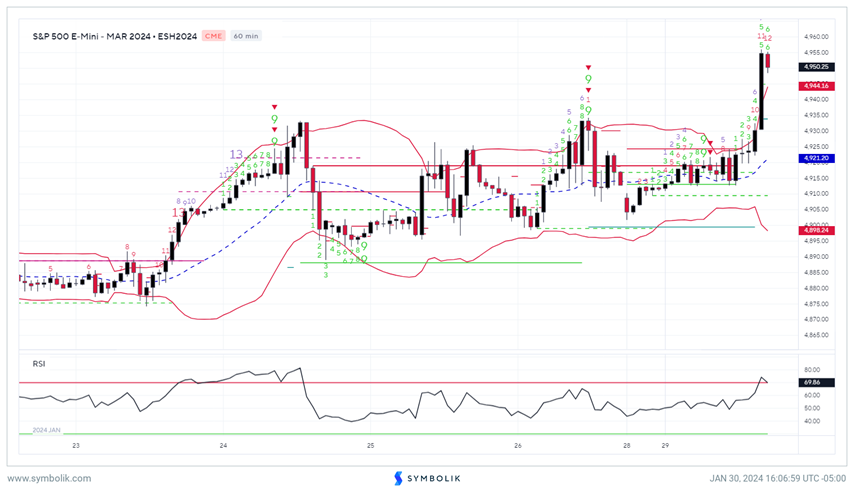
SPX wave structure might allow for a minor peak this week, but it likely does not undercut 4802
From an Elliott-wave perspective, there is the potential that this current push higher could find a temporary peak, which might also align with DeMark-based exhaustion and/or time-based reasons for importance over the next few days.
As to whether one would pay attention to this largely depends on one’s timeframe and risk tolerance. Attempting to sell into gains back to new all-time highs for SPX and QQQ is extraordinarily difficult and any pullback at this point likely still could prove short-lived.
Bottom line, while the lack of participation in nearly half the SPX sectors is a concern, there’s no guarantee that this means the entire market is due for a correction. This very well could be followed by upcoming breakouts in Healthcare and Industrials to join the recent surge in Financials, and I suspect this is more likely at the present.

Alphabet earnings miss might translate into an attractive risk/reward opportunity near $141.
Overall, GOOGL -1.99% ’s post earnings reaction likely could find support heading into Wednesday.
(Post-market close, GOOGL -1.99% is trading down to $142 from its 1/30/24 close of $151.46.) I won’t address this in any meaningful fashion, outside to say GOOGL has not yet broken out meaningfully enough (it’s move to new highs lasted approximately four trading days) to suggest this was a meaningful breakout.
Normally, I prefer to wait for consecutive weekly closes on any move above a former high of more than one-year in duration (personal preference).
At present, GOOGL is attractive on pullbacks, and one should look at $141 as being important into Wednesday’s trading (1/31/24), which lies up near October 2023 and December 2023 peaks.
This level also represents a 38.2% Fibonacci retracement level. Finally, this level is right near the uptrend from late October lows. Thus, all of these suggest this “potential” decline for tomorrow should find firm support near $141 and likely turn back higher.
The red arrow shown on the right-hand side of the chart shows the level that GOOGL has been actively trading at 5:30 pm EST on Tuesday. A pullback to this level approximates a good risk/reward for GOOGL.

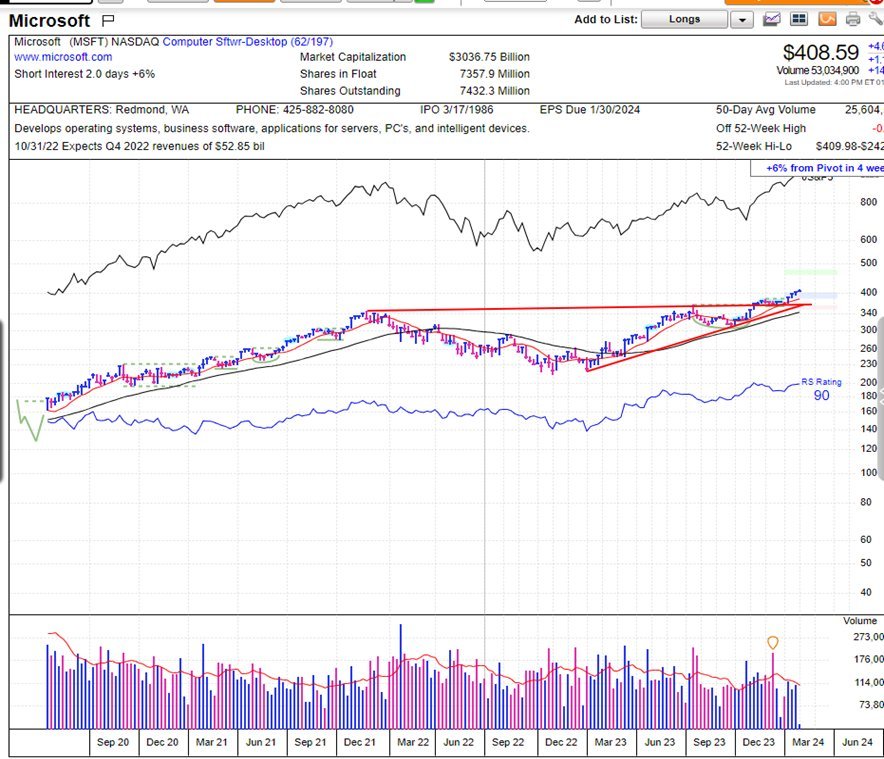
MSFT looks far stronger than GOOGL; Any early weakness on Wednesday likely should near support quickly
MSFT -0.02% has proven far stronger than GOOGL -1.99% and its shares have already pushed back to new all-time highs.
Post close, similarly to GOOGL -1.99% , MSFT looks to be weakening slightly, albeit to a lesser extent.
As of 5:30 pm EST, MSFT is trading $402.50, down from its Tuesday (1/30/24) close of $408.59.
While momentum has gotten overbought based on traditional technical metrics such as Relative strength index (RSI) this ordinarily is a poor gauge (in my opinion) for attempting to time buys or sells.
Structurally, MSFT is in excellent shape technically having exceeded the pivot level of a Cup and Handle pattern during the final week of October 2023.
In my view, MSFT is more attractive than any other of the Magnificent 7 stocks outside of NVDA, based on the degree of recent price strength in having meaningfully exceeded former all-time highs.
Pullbacks down to $384 represent its first key area of support, while any Spring 2024 weakness should not undercut $350, near its late 2021.
On the upside, I expect pullbacks to prove short-lived and then turn back higher to technical targets near $457.
The extent of MSFT’s constructive breakout above 2021 highs (which cannot be yet said with META 0.58% , GOOGL -1.99% , TSLA -3.59% or AAPL -0.44% ) is a very good technical sign, and MSFT and NVDA 0.53% are two leaders which look appealing on any weakness.