SPX and QQQ at new all-time high territory has not yet been followed by similar movement from Russell 3k, Value Line Average, and DJ Transportation Avg, and this divergence will be important to concentrate on in the weeks ahead. Technology remains an outperformer after its recent breakout. Meanwhile some minor evidence of defensive outperformance began on Tuesday, and this also should be watched carefully. Breadth has been waning in recent weeks while US Dollar and Treasury yields have begun to press higher which likely could bring about an upcoming consolidation for US Equities. At present, trends are bullish and no evidence of trend reversal has occurred.
Defensive groups like Consumer Staples and Telecom have begun to show some near-term outperformance on Tuesday, but this doesn’t appear like an isolated event. Evidence of Equal-weighted Discretionary peaking out vs. Equal-weighted Staples began in mid-December and has persisted over the last month.
Meanwhile, Technology managed to roar back in trading on Tuesday after early losses to close higher by +0.40% (XLK 0.58% ). Thus, despite a lackluster day for market breadth where more NYSE issues were lower than higher, US Equities managed to finish with mildly positive performance yet again.
As this daily SPX chart shows below, one cannot rule out a move to SPX-4950, but I feel like 5000 should be truly difficult to exceed in the next month without consolidation. SPX lies outside the upper Bollinger band on daily charts, while Russell 3k remains below all-time highs from November 2021.
The first real area of downside support lies near 1/12/24 intra-day peaks of 4802.40. Until/unless this is violated, it’s going to be difficult to be too negative on US indices. The next 2-3 days still look positive given a lack of intra-day DeMark-based signals from indicators like TD Sequential and/or TD Combo.
Furthermore, the key timeframe in question at this point lies near 1/27-29. This aligns with a 3-month anniversary of the October 2023 lows along with a 6-month anniversary of last July’s (2023) peaks. I expect that by the end of this week, US Equities will have arrived at the next important window. At present, SPX being stretched does not equate with an immediate opportunity to pare back longs.
S&P 500

Treasury Yields and the US Dollar have continued to push higher in recent weeks
I’m skeptical based on last year’s correlation trends that Treasury yields and US Stock indices will continue to move in a straight line higher in unison over the next 2-3 months.
The correlation has been coming unwound a bit this past week as yields started pushing higher in late December, but this has had little to no effect on US Equity indices.
TNX’s October 2023-December 2023 decline looks complete as of a few weeks ago and yields have recently begun to lift back higher given the discrepancy between recent Federal Reserve governor comments vs. the actual Dot-plot projection.
As the chart below shows this rally has now neared a prominent level of Ichimoku cloud-based resistance. However, a move over 4.20% in TNX would allow for a push up to 4.34% up to 4.51% which might represent the end of “Wave A” of an ABC corrective pattern.
Following this push up into February for Yields, a minor pullback might commence before another turn higher for yields into March/April.
It’s expected that this might be a time of falling US Equity prices, not rising. Thereafter, however, once a completed three-wave advance has been completed for TNX, a move back to new monthly lows for yields should commence.
This could directly line up with a period of sharply rising US Equity prices from April/May period into August. Overall, it’s worth paying attention to 4.20% for TNX and any move over that level would be thought to result in Stock indices likely weakening in the short run.

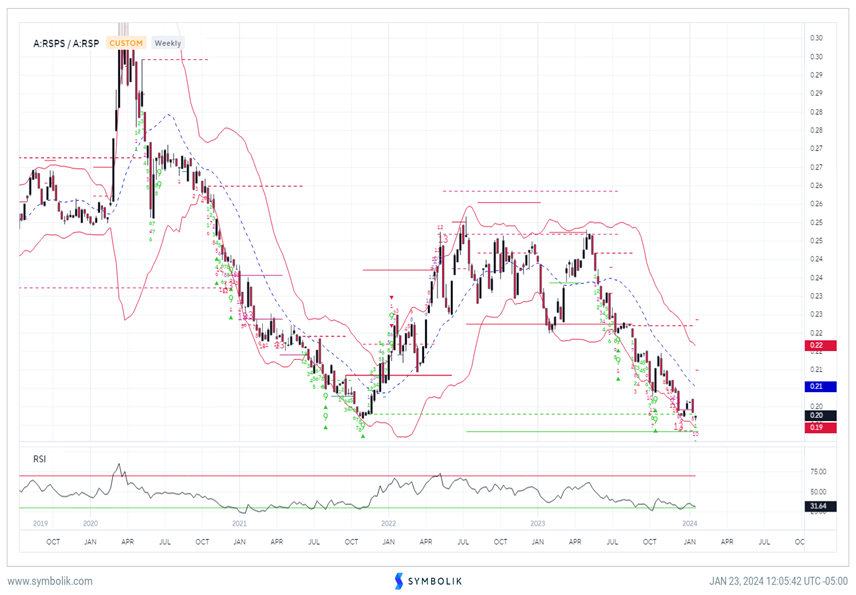
Consumer Staples looks to be nearing a low in its relationship vs. S&P 500 in Equal-weighted terms
This weekly ratio chart between RHS -0.21% (iShares Consumer Staples Equal-weighted ETF) vs. RSP -0.31% (Invesco’s Equal-weighted S&P 500 ETF) shows this nearing a prominent former low which I expect might offer support in the weeks ahead.
While not shown below, the ratio chart of Consumer Discretionary vs. Consumer Staples already has begun to turn back lower over the last month and I suspect that a bounce in Staples in relative terms to the S&P 500 could happen between February and May.
Tuesday’s outperformance by Consumer Staples was largely led by PG -0.20% , whereas other stocks like MCK -0.49% , CPB 0.19% , GIS -0.27% , CAG N/A% , EL -1.94% , KMB -0.50% , and HSY 0.60% were all up more than 2% in trading.
Overall, I don’t suspect that Staples will outperform S&P 500 for the year and this looks like just a short-term inflection point where the sector might turn back higher.
This would directly line up with what XLU 0.14% charts also are showing after recent deterioration based on the near confluence in DeMark indicators that might be complete on XLU by end of week to match a similar TD Buy Setup for XLP and RSPS.
Overall, my favorite Consumer Staples stocks to favor, technically speaking, are:
COST -0.23% , SFM -0.16% , CASY 0.29% , WMT -0.15% , MNST 0.32% , MDLZ -0.19% , LW -1.42% , WDFC 0.08% , PG -0.20% , and CHD -0.99% .
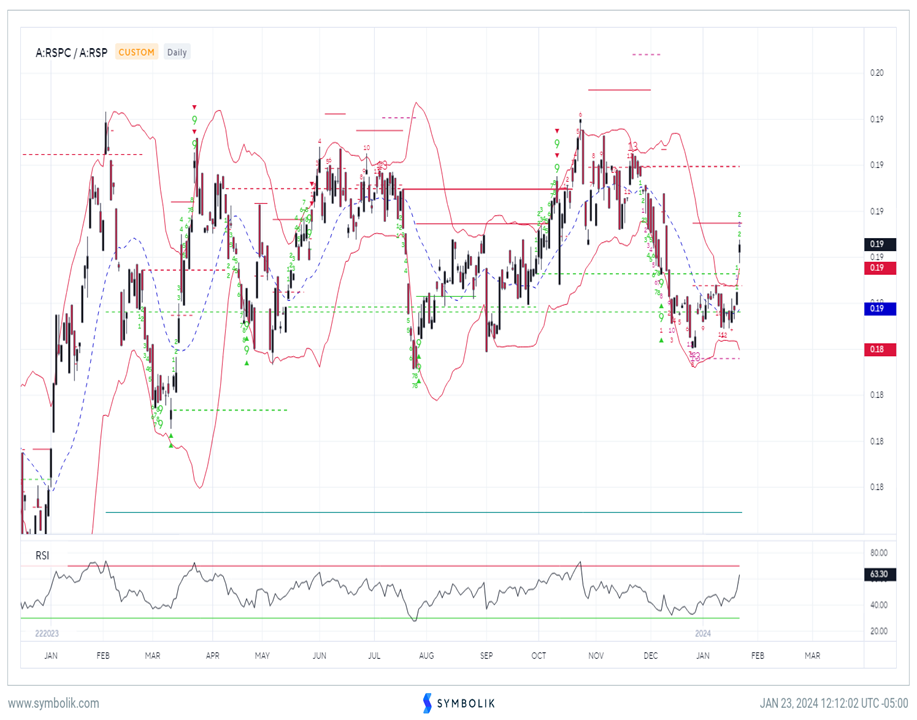
Communication Services also turned up sharply on Tuesday vs. S&P 500 which is largely due to Telecom outperformance
Communication Services looks to be short-term bullish, but likely should not break its larger intermediate-term neutral sideways pattern vs. the S&P.
This relative chart below of Invesco’s Equal-weighted Communication Services ETF (RSPC -0.26% ) vs. RSP -0.31% turned up sharply in the last few days to the highest levels since early December (This chart was taken ahead of NFLX’s earnings results).
Overall, Telecomm Services has been one of the biggest areas of outperformance within the Communication Services sector this year along with outperformmance from META -0.07% , FOXA -0.92% , and GOOGL -0.87% . In the short run, this Telecomm outperforamnce is bullish and VZ and T both look to continue a bit higher in the weeks ahead before hitting resistance.