Near-term trend for US Equities is bullish, but getting extended as part of negative momentum conditions on weekly and monthly charts. Treasury yields and US Dollar might weaken into US Thanksgiving holiday but larger breakdowns look premature. An Equity rally looks likely into 11/24 or 11/27-28 before consolidating into early to mid-December.
Similar to most days recently, today’s mildly positive finish failed to tell the whole story, as eight major S&P sectors (out of 11) finished negative on the session, with above-average weakness out of Small-caps, Discretionary and Energy stocks.
Healthcare managed to show some above-average upside follow-through, and Medical Devices stocks in particular successfully turned in good performance. ( I discussed IHI 0.71% possibly extending gains, and this still looks likely given the recent decline in Yields.)
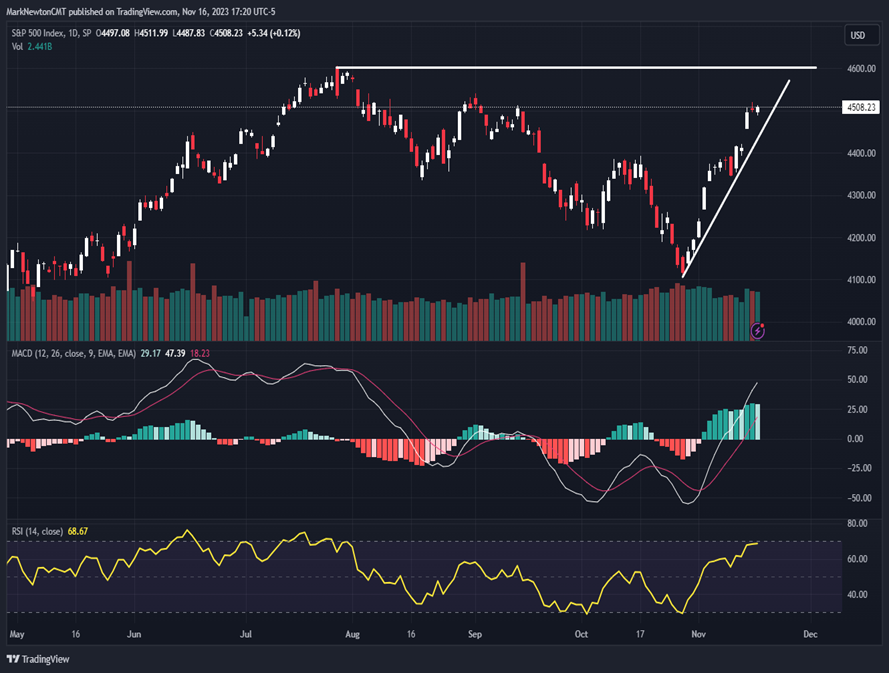
While many might expect that this initial “market rip” might be something to sell into, technically speaking, my indicators look early based on price and time principles by roughly a week in this regard. SPX likely has another 50-75 points up into next week in all likelihood, and I expect that QQQ might also reach 392-393.
I’ll certainly respect any break of the uptrend line from late October for SPX or other US benchmark indices, or indications that TNX might be starting to turn higher a bit more quickly. At present, I’m still expecting that gains are likely for equities and Treasuries (yields have a bit more to go lower) but that both likely near significant levels into next week.
Following a rally into next week, investors need to be on alert for any hint of negative market breadth, or DeMark-based exhaustion appearing on indices and/or on Treasury yields which might be important towards signaling that consolidation might be overdue.
Finally, 11/27 stands out as being important given its relationship to the 7/27/23 peaks as well as being a perfect 180 days from when US equities began to exert more broadening out in late May.
(I always find 90 and 180 day projections from meaningful highs and lows important, and particularly when aligning with other important angles of the circle for timing purposes ( like 120, 135, 225, 270, and specifically, yearly anniversaries (Recall that the US Stock market peaked two years ago in mid-November, 2021))
However, based on the “KISS” method (Keep it Simple Stupid), SPX is trending higher and should face meaningful resistance near 4600, and investors need to watch for whether this area can be exceeded or results in a breakdown (We’ll likely know the answer to this by the 1st week of December.-Stay tuned)
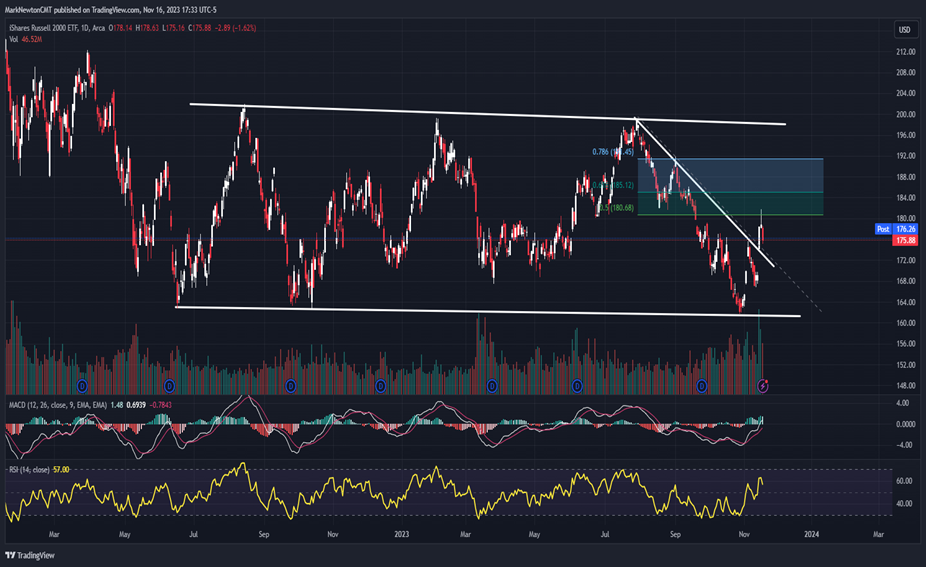
Small-cap rally could continue into next week. However weekly charts show trading range being very much intact
I fielded a ton of questions after discussing Small-caps recently, so it’s only right I show additional charts to try to answer questions.
Daily charts of the Ishares Russell 2000 ETF (IWM 1.41% ) are short-term bullish based on this week’s breakout, as part of a lengthy sideways pattern since mid-2022.
Daily charts show achieved a short-term technical breakout with the move above the downtrend line from July 2023 peaks. This helped short-term momentum gauges turn higher and IWM managed to successfully bottom out within striking distance of two prior lows.
However, much needs to happen in order to think that Small-caps can lead into and through 2024. I’ll discuss my 2024 thoughts in my Annual Outlook on 12/14/23.
At present, I feel that IWM likely continues higher up to 185-190 before stalling out. Given that Treasury yields falling sharply coincided with this sharp bounce in IWM, I’m expecting that a larger breakdown of 4.35% might be necessary before expecting IWM exceeds $199.
For now, despite Thursday’s (11/16) weakness, it’s right to expect further strength and outperformance from IWM into next week before this index ETF stalls, and possibly reverses course.
Crude oil likely could bottom out by OPEC meeting
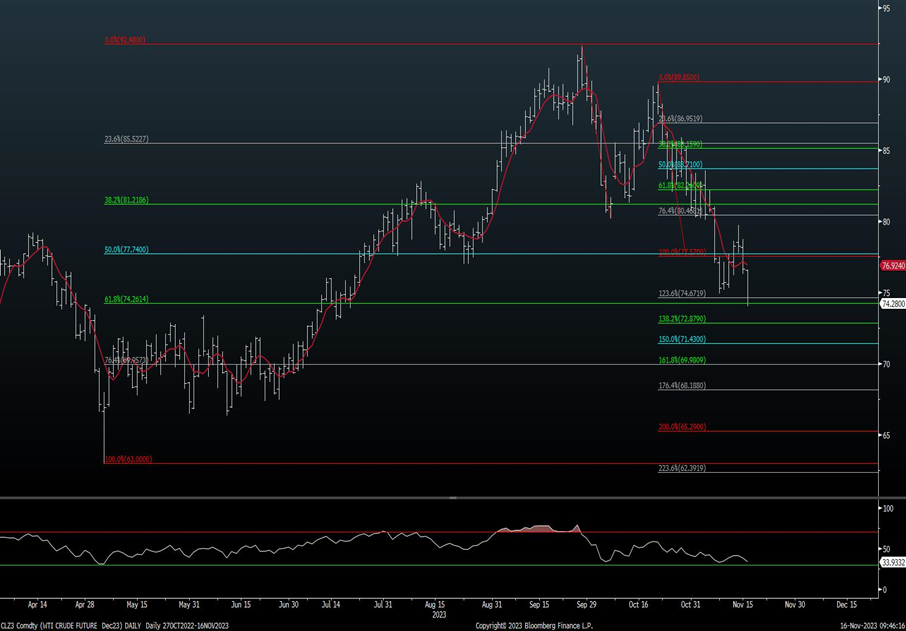
WTI Crude Oil futures (Generic WTI Crude futures contracts) violated early November lows today, constituting the lowest daily close since July 2023.
Volume spiked, and Elliott-wave structure remains bearish, along with Crude cycles pointing towards a possibility of further weakness into late November.
Many Energy-related ETF”s like XOP 1.74% and XLE 1.02% have not broken early November lows on this weakness thus far. However, I do expect that should happen before the OPEC meeting on 11/26/23.
In the short run, additional Energy weakness is likely.
The key technical question is whether Crude can bottom out in late November and begin trending back higher in a way that results in a 2024 retest and breakout above highs? Or should prices remain near recent lows and simply stabilize and consolidate.
My technical thoughts are that it should be right to buy into weakness into late November for most Energy stocks that should coincide with cyclical lows for Energy.
However, momentum is quite strong to the downside at present. One cannot rule out an initial bounce into December from 11/26 that shows additional consolidation to make a final low.
However, technically speaking, I am not anticipating that Crude oil, nor Energy breaks its Spring 2023 lows. Thus, this decline is slowly but surely nearing a time where Energy will be an attractive risk/reward. At present, Thursday’s (11/16) decline makes this early, and additional weakness into the OPEC meeting is anticipated, technically speaking.
If/when Saudi Arabia and Russia make any unexpected comment about extending supply cuts throughout the first few quarters of 2024, my thinking is Crude oil and Energy likely could respond quite positively (At present, nothing of the sort has been announced, but is just a scenario which could possibly deliver a positive surprise)
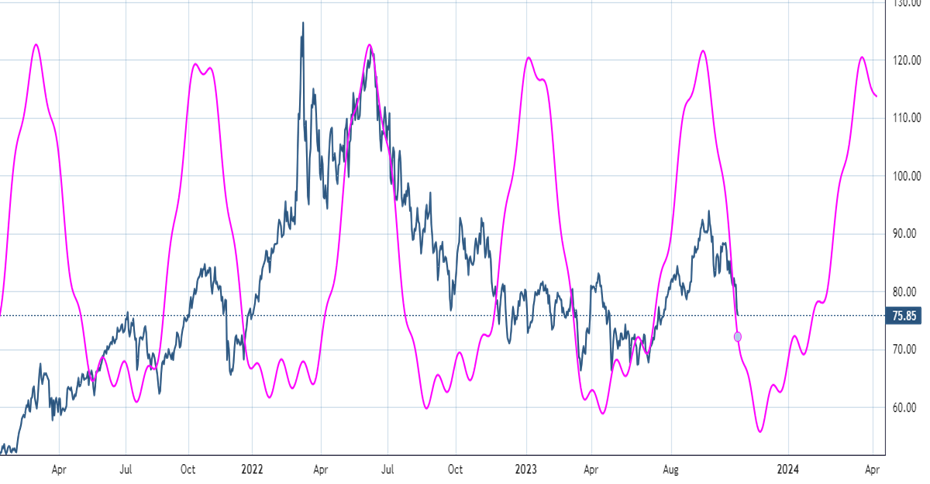
Crude Oil short-term cycle looks set to bottom by late November
Interstingly enough, the date of the OPEC meeting on 11/26/23 directly lines up with when my short-term cycle composite for WTI Crude bottoms and turns higher.
Thus, it’s possible that something is discussed at the meeting which might act as a positive catalyst for WTI Crude to reverse recent losses and turn higher.
Bottom line, any Energy weakness into 11/26 will be analyzed for evidence of techincal bottoming, by means of price/time relationships whih could bring about a bounce.
Counter-trend tools along with volume analysis, positioning, and/or general sentiment analysis could be helpful in about two weeks’ time. I’ll discuss this further as the time approaches.
While my 2024 Technical Outlook will cover WTI Crude oil in more detail, I can relay that I am expecting prices to rebound into 2024, and the first step of this process might begin on/near 11/26 if/when any positive comments are made at the OPEC meeting.
WTI Crude’s short-term cyclical composite is shown below. I’ll analyze the weekly, longer-term composite in my 2024 Annual Outlook on 12/14/23.