Tuesday’s rapid early day decline in US Equities failed to do much technical damage, and by end of day, SPX had recovered nearly half of the early day weakness.
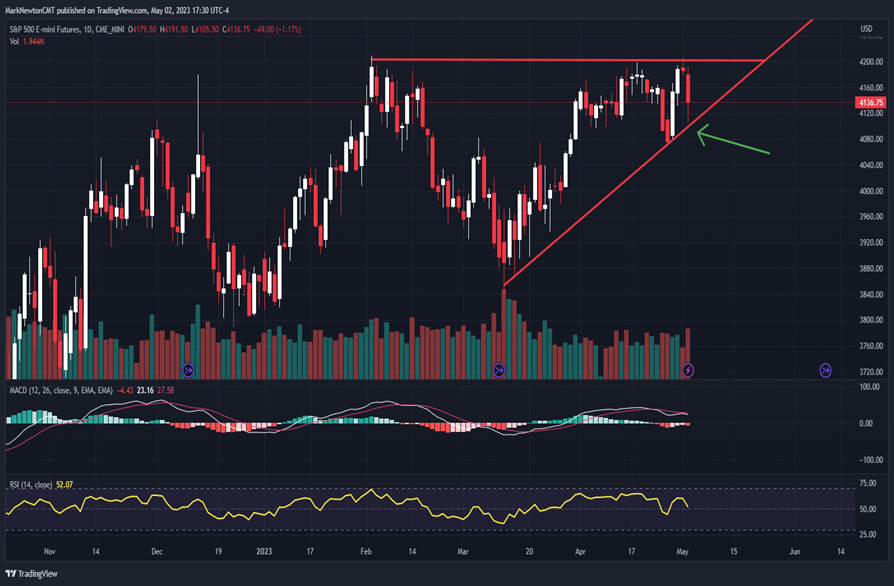
Despite some of the recent waning in breadth and momentum in groups like Technology, it remains difficult to be bearish on the underlying US Equity indices, as little to no evidence of index price weakness has occurred. Triangle patterns remain intact for SPX, and price requires a move back lower under last week’s lows to raise concerns about possible weakness.
While a daily decline under last week’s S&P Futures low of 4068 or SPX cash-4049 would likely result in a test of 4000, it might be more likely that Wednesday’s FOMC meeting results in a push back to weekly highs.
I suspect that volatility will indeed occur over the next few days, but there’s no guarantee that this needs to be downside volatility. Gains back over SPX-4200 would certainly result in short-covering and breakout buying which could lift SPX to 4250-4325 into mid-May.
SPX price action has consolidated the recent push up towards 4200, and such movement often will lead to another test and breakout of recent highs, which might happen into next week. QQQ -1.91% , to its credit, has made just a minor pullback in Tuesday’s session following its breakout of the highest levels since last Fall. It’s thought for QQQ -1.91% that prices should not violate 310 before turning back higher up to 326-328.
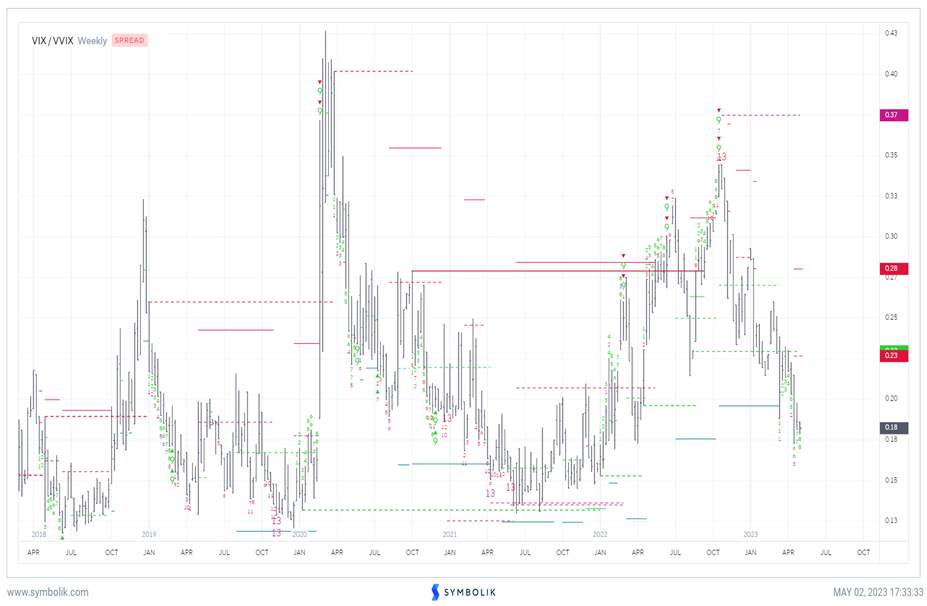
VIX never achieved its perfect “buy” signal
While my analysis Monday evening focused on the VIX bottoming this week, it never quite achieved a perfect confirmed DeMark TD Combo or TD Sequential “13 Countdown” signal that would have given more confidence of a low being at hand.
While there were numerous reasons to expect that VIX might lift from extreme lows, most of these dealt with the extremely depressed nature of spot VIX in relation to its back month Futures levels.
As shown below the ratio chart between the spot VIX to the VVIX, CBOE VVIX index, (VIX of the VIX) tends to be quite important at turning points. VVIX represents the expected volatility of the 30-day forward price of the CBOE Volatility index, (or said another way, the volatility of the volatility).
As shown below, the rapid US Equity declines in early 2020 along with early 2022 at lows for this ratio occurred following Downside exhaustion (“Buy” signals of ratios of VIX to VVIX, as shown by DeMark “13 Countdown” exhaustion). Furthermore, the Equity market bottom last October 2022 also coincided with important upside exhaustion in Ratios of VIX to VVIX.
Bottom line, the current ratio has been declining since last October and is not yet at completion (No Signal) While DeMark indicators are “close” to lining up to show downside exhaustion in the ratio of VIX to VVIX, this remains premature at this time. This could be achieved potentially in 1-2 weeks on further declines in the ratio of VIX to VVIX.
Furthermore, the VIX index itself never quite triggered the 13 Countdown signal, nor confirmed it. Thus, there remains the potential for Equity markets to potentially rally post FOMC which would erase Tuesday’s violent VIX advance, and could potentially send VIX down to new weekly lows into mid-May. Then, there could be sufficient signs for a more meaningful rally in VIX.
At present, despite the abrupt, meaningful reversal, I’m not quite convinced, technically speaking.
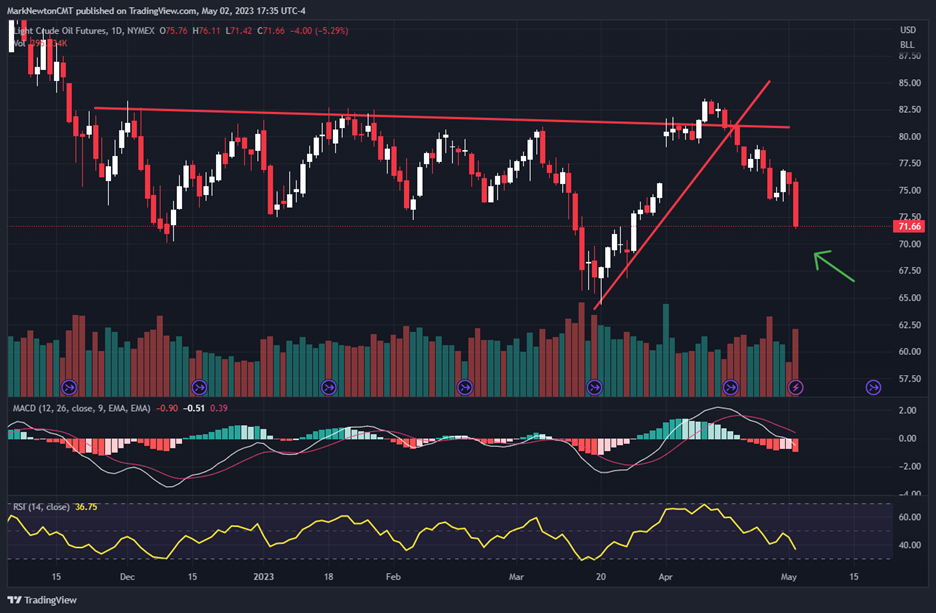
Crude postpones Energy rally with violent decline
Crude’s 4%+ selloff Tuesday broke former lows of its recent stabilization and finished near lows of the day on above-average volume.
This pullback on Tuesday likely postpones the chance of immediate strength in Energy and it’s important to see some evidence of upcoming stabilization and turn back higher before expecting that Energy will outperform such as what’s been happening within Healthcare lately.
It’s disappointing that Energy has ignored the traditionally bullish seasonality that normally occurs in April into May. However, given that May has just gotten underway, I’m not confident that Crude requires a breakdown under prior lows which would take prices down to $60 or lower.
In the short-run, a move to $66-$68 in front month futures looks very possible for WTI Crude, but technically it looks important for Crude to hold former lows from March.
Thus, the most important area of support lies at March lows which will need to hold on any further selling in the weeks to come. The ability to reclaim $73 would be a welcome sign for the Bulls, and I’ll discuss this when it occurs.
For now, it’s right to examine how much of a false breakout occurred into April, following a successful move above prior monthly highs. This reversed sharply and has trended lower ever since. Bottom line, selectivity is important in Energy until this can stabilize and Tuesday’s decline makes this seem a bit premature.
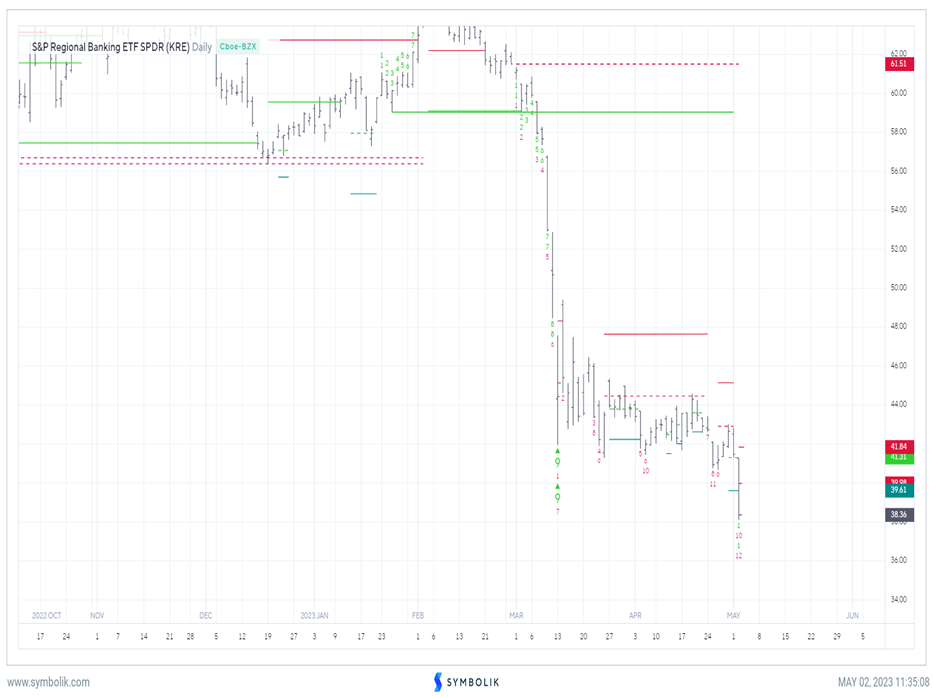
KRE’s breakdown to new monthly lows could find support possibly by end of week
Tuesday’s decline in PacWest Bancorp and Western Alliance Bancorp (both fell greater than 15% in Tuesday’s session) resulted in a sharp breakdown in KRE -1.01% .
Regional Banks have underperformed Large Money Center banks dramatically, and Tuesday’s selloff undercuct the lows of the past two months of stabilization.
This certainly appears technically bearish and it is. However, DeMark exhaustion is within 1-3 days on KRE -1.01% on daily charts, while weekly charts already have triggered, (but not confirmed) “weekly 13” buys. Thus, at a time where Tuesday’s price action seemed to signal lots of uncertainty ahead of Wednesday’s FOMC decision, it wouldn’t be surprising to see Regional banks via KRE -1.01% try to bottom out and rally at a time following a big breakdown in Regional banks, coinciding with ongoing bearish sentiment towards the banks.
$36-$37.50 seems like an appealing area to consider support for KRE -1.01% on this decline.