
Trends for Equities remain upward sloping based on Equal-weighted SPX, but the underlying volatility across Equities has picked up measurably despite no true underlying trend in SPX since last October’s close. Positives include the NYSE and SPX Advance/Decline line having recently pushed back to new highs, along with the continued mean reversion higher in sectors like Energy, Materials, and Consumer Staples. Defensive positioning has grown stronger in recent weeks as sectors like REITS, Telecom, and Utilities have now started to join the push higher in Consumer Staples. However, the bifurcation in Technology has proven stunning lately, with severe weakness in Software, while stocks like WDC 4.19% , STX 6.00% , SNDK 6.45% have continued to scale new heights. Moreover, it’s the weakness in “Mag 7” which has caused Technology to fall out of favor and has resulted in SPX breaking down from multi-year uptrends vs the All-Country World index. While it’s difficult to consider that trends are changing, barring an actual breakdown in intermediate-term price trends and breadth gauges (which hasn’t happened), there are a plethora of advance warning signs that are starting to crop up, which are important to pay attention to at this stage of the rally. Overall, I am expecting a choppy push higher up to the 7100-7200 area, but feel like the upside should be limited to around 3% higher. Meanwhile, any drop under early February lows at 6780.13 would serve to turn trends negative, and this remains arguably the “line in the sand” for trend followers.
Thursday’s trading showed similar signs of the same type of rotation we’ve seen in recent weeks: A heavy push into defensive areas like Utilities and Consumer Staples, while Software and Financials weakened sharply. Incredibly enough, Technology fell over 1.25% despite STX 6.00% , WDC 4.19% , and SNDK 6.45% all gaining more than 5% on the day.
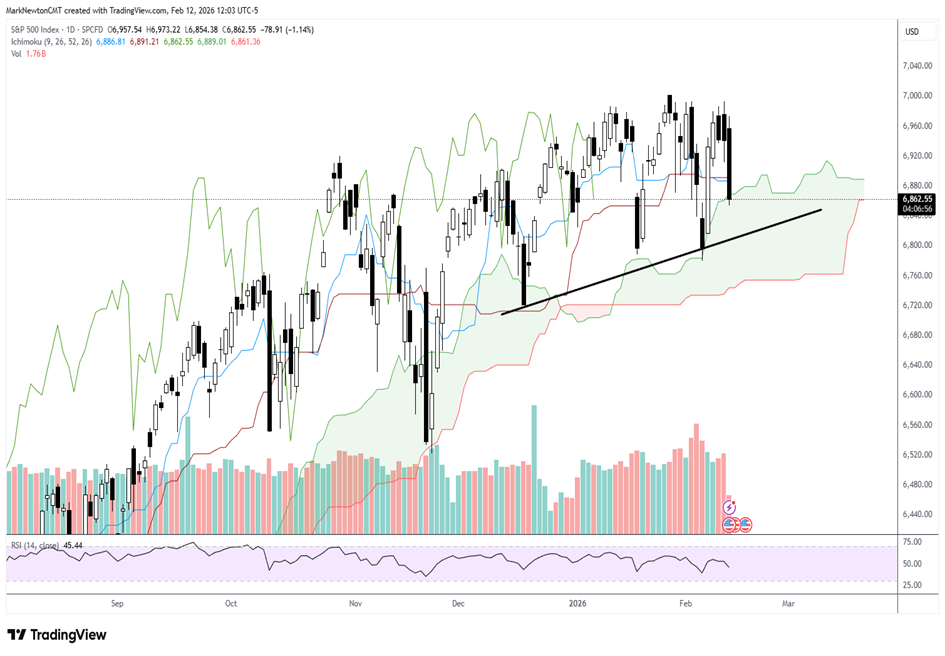
Overall, I don’t consider Thursday to represent any sort of meaningful breakdown. Until/unless 6780 is violated, which approximates February lows for ^SPX, trends remain intact, despite being quite choppy with volatile price action in many sub-sectors.
As shown below, until February lows are broken on a weekly close, it’s still possible to view this pattern as just choppy consolidation, which could resolve higher. However, the next 3-5 days will be quite important for the price to turn back higher.
S&P 500 Index
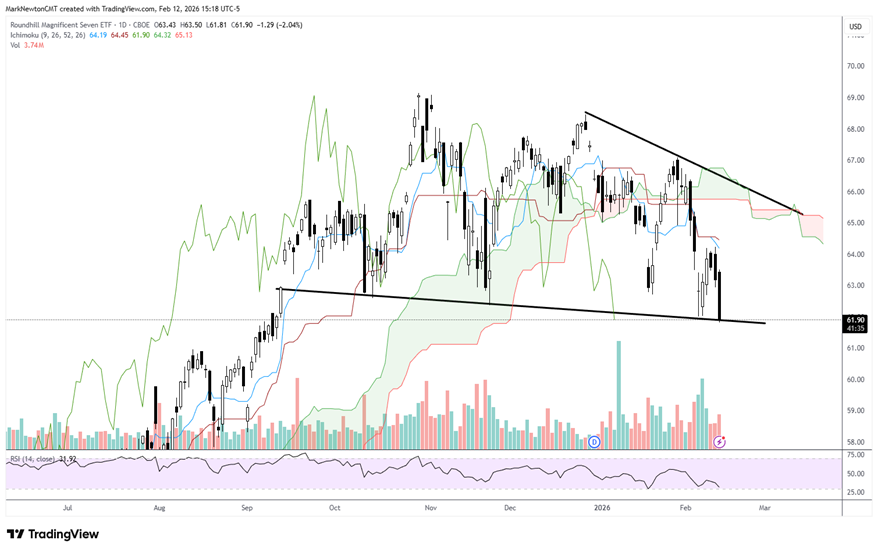
Magnificent 7 ETF pullback has reached a “Do-Or-Die” area of support
Recent weakness in AMZN -2.24% and MSFT -0.63% has resulted in the Roundhill Magnificent 7 ETF (MAGS -2.29% ) having pulled back to arguably a very important area, which needs to hold to prevent a further breakdown in Technology.
Despite the strength in NVDA -1.74% TSLA -2.59% this past week, the Magnificent 7 continues to fall out of favor as its weakness starts to grow more pronounced.
As this chart shows below, there’s been no net progress in MAGS since September, and many investors who own NVDA -1.74% can attest to the degree of sideways activity that has occurred since last Summer.
Technically speaking, it is always incorrect to mention a pattern being a Head and Shoulders and/or topping pattern simply because of a range-bound situation.
However, MAGS is thought to need to hold above $60.84 to have a chance at rebounding in the weeks to come. (Note, even on a rebound at this point, I’m growing increasingly skeptical that MAGS manages to get back above $66 right away.)
Overall, even on a snap-back rally, my thinking is that the act of recovering this minor downtrend line from late 2025, which intersects the highs, might prove difficult.
Roundhill Magnificent Seven ETF
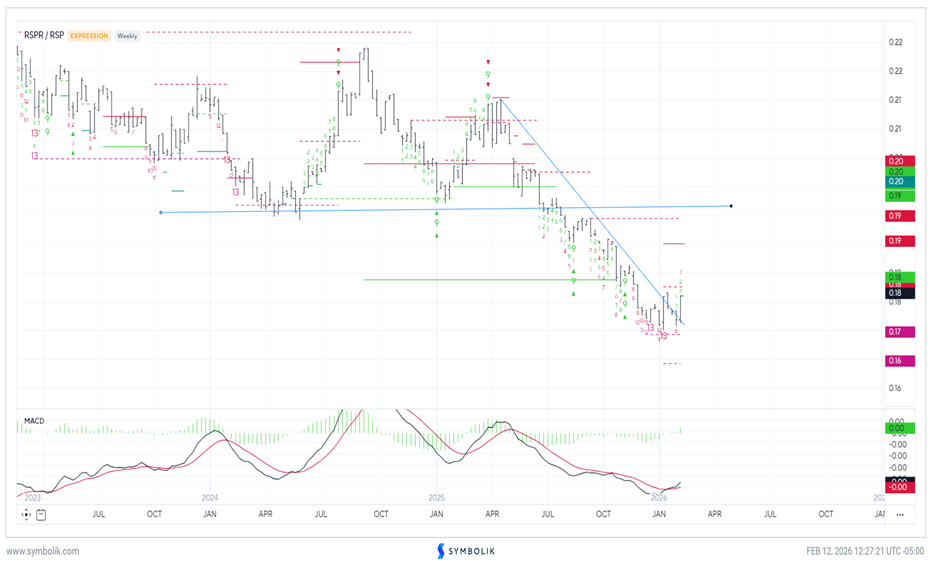
REIT’s strength “opens up the door” for higher prices in the months to come
The push into Defensive sectors has now spread to the Real Estate Investment Trusts (REITS), and I expect that this sector likely can show above-average strength vs. the S&P 500 in the months to come.
As shown below, the Equal-weighted REIT ETF by Invesco (EWRE -0.28% ) has officially broken out above a lengthy downtrend when shown relative to the Equal-weighted S&P 500 (RSP -1.45% ).
Momentum indicators like MACD have crossed the signal line and turned positive, while DeMark indicators show two weekly exhaustion signals based on TD Sequential and TD Combo, which likely suggest a meaningful change in trend.
Thus, following 10 months of underperformance, this ratio now looks to be turning higher. Weekly ratio charts of RSPR vs. RSP have reached the highest levels of the year and have exceeded the downtrend from last April’s peaks.
Some of my favorite REITS from a technical perspective are: REG -1.10% , DLR 3.29% , HST -2.10% , O 0.43% , VTR -0.57% , EQIX 10.41% , WELL 0.13% , and SPG -1.71% .
Thus, the REIT sector might be one to consider for those looking for alternatives outside of Technology and Financials.
RSPR/RSP
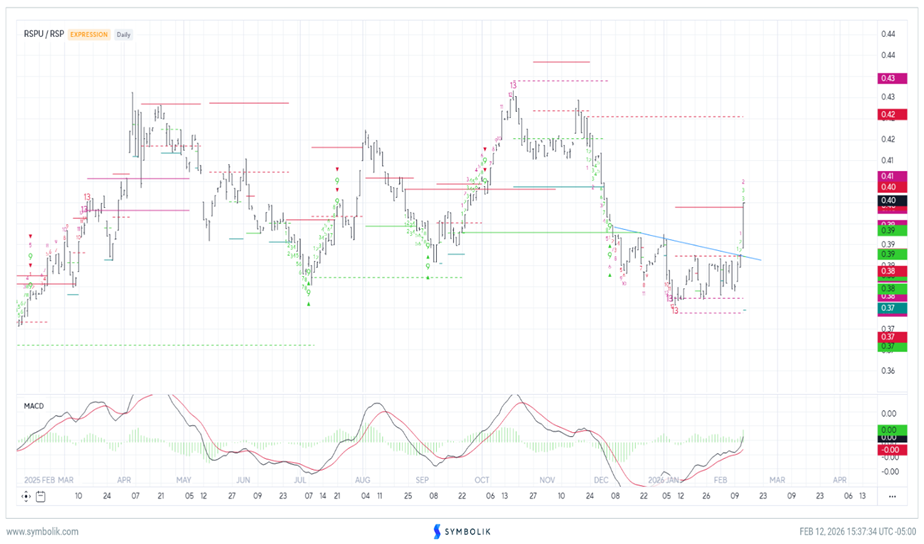
Utilities have also broken out to the highest levels of the year
Utilities also look to be recovering sharply after some consolidation, which followed a very good 2025 year of performance.
Many investors recall that this sector largely outperformed for most of 2024 and half of 2025 before weakening in the back half of last year.
That weakness now looks complete as Utilities have pushed up in relative terms to the Equal-weighted SPX to the highest levels since late last year.
Similar to REITS, the Utilities space also looks like an attractive area to consider for those concerned about volatility.
My favorite Utilities at this time technically are: CNP 1.49% , LNT 2.13% , NI 1.16% , CMS 0.28% , AEE 3.12% , EVRG 1.74% , ETR 1.76% , ATO 1.02% , NEE 0.53% , and AEP 3.35% .
RSPU/RSP