
US Equity trends remain choppy, but bullish, and both SPX and QQQ look to be stabilizing near key support, which likely can lead to a bounce this week. Last Friday’s reversal looked like a mirror of the prior Friday, but still failed to generate immediate follow-through as of Monday’s close. November has generated the worst Equity returns since 2008 for a November with eight trading days remaining. However, my expectations are that NVDA earnings, along with a possible rebound in September Payrolls, could serve as the catalyst for a possible rally this week. Despite Small-caps and Financials being under pressure, both have appeal on weakness this week, and their underperformance is thought to be temporary. Until/unless October lows are violated, it’s right to be bullish and simply use this recent consolidation as a chance to buy dips.
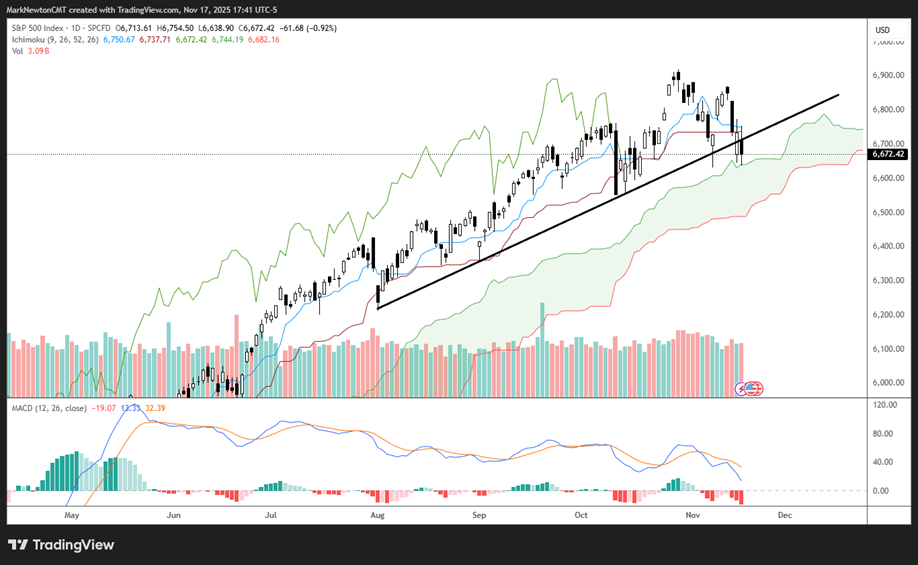
As seen below, ^SPX’s pullback is now hovering right near its uptrend from August lows. While today’s move in Financials looked particularly bearish, NVDA -1.74% looks to be holding up in strong fashion ahead of its earnings this Wednesday.
As discussed in recent weeks, I think ^SPX very well could hold November lows before turning higher. However, structurally, it’s actually more important that October lows hold, which have more significance in my work than November.
Given that sentiment has turned the most negative of the year for Cryptocurrencies (which have been known to lead Equities) while AAII and Fear and Greed sentiment polls remain negative, I’m skeptical just yet that November shows much further downside volatility.
As daily SPX charts show below, price is trading right near the upward sloping Ichimoku Cloud support, and I suspect we’ll get some kind of reversal this week. Given NVDA -1.74% ’s poor track record of showing strong performance post earnings in recent years (NVDA -1.74% has actually fallen in the weeks after earnings in five of the last eight quarters), the market reversal might not necessarily be because of NVDA -1.74% earnings.
Instead, this very well could be based on Economic data and a forthcoming “V-shaped” recovery after the Shutdown was resolved.
Key levels for SPX seem to lie at 6631, then 6550. Meanwhile, any rally back over 6775 should have importance as a bullish move.
S&P 500 Index
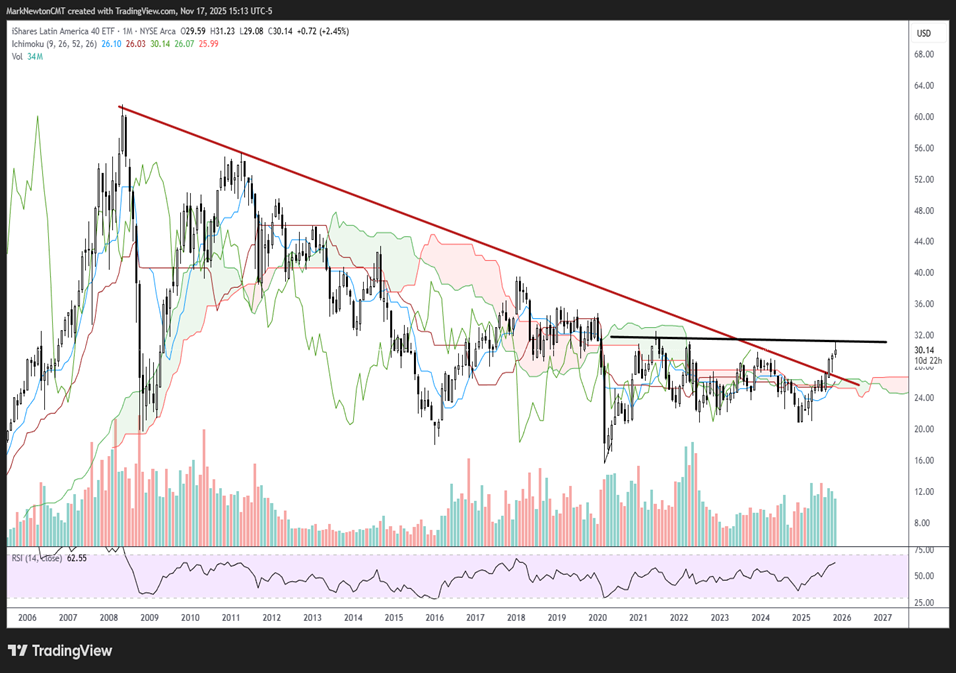
ILF long-term breakout makes this attractive for 2026
Pullback this week should be buyable for ILF near 29-29.50 after the recent breakout to multi-year highs.
Note, as shown above, this breakout has not only exceeded the downtrend from 2017 but also a lengthier downtrend going back to 2008. Thus, I tend to view this as a good sign for 2026. Initially, one should view the 2021 peaks near 32.52 as having some importance. As the US Dollar begins to slide back towards lows in December, I expect ILF to outperform into 2026.
In the short run, weakness this week makes ILF appealing technically speaking.
iShares Latin America 40 ETF
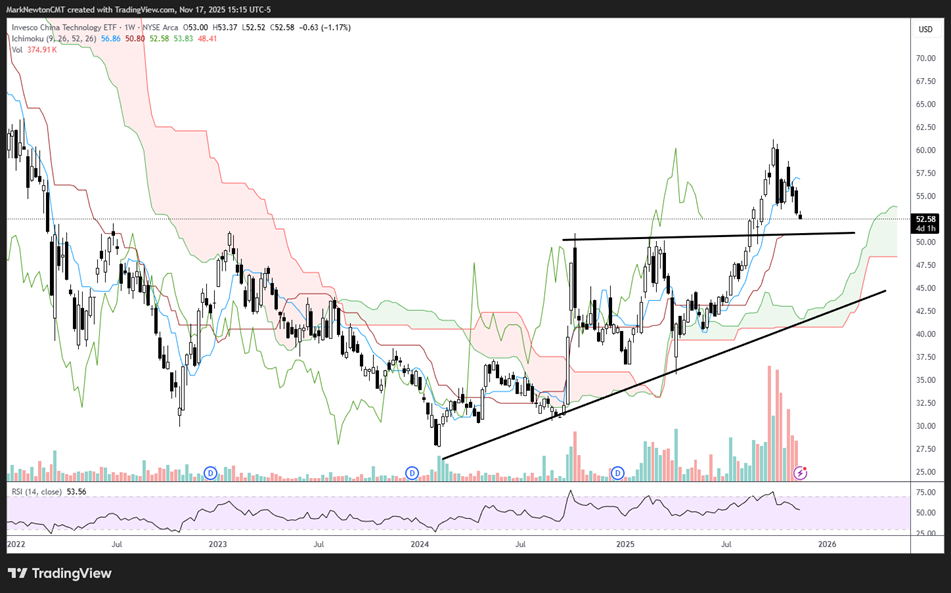
CQQQ should also reach support this week and turn back higher
China’s Invesco Technology ETF is growing near support following last week’s breakdown below 53.50.
CQQQ looks actionable to buy near 51-51.50 after its short-term peak last week. The breakout in August above former peaks from fall 2024 and also early 2025 is positive.
However, the break of support near 10/17 lows at 53.55 is short-term negative and likely takes this lower under 52 this week before it finds support and begins to trade back higher. Overall, I see weakness as being temporary. However, for now, it still looks to have $1 to go on the downside and early to buy just yet.
As shown below, this week’s weakness has undercut October 2025 lows but is hovering just above two former meaningful highs. This level near $51-$51.50 looks quite important as an area of support where this likely stabilizes.
At present, a bit more downside looks likely this week.
Invesco China Technology ETF
Small-caps likely can attempt to bottom out relatively soon this week, following a couple of difficult weeks of performance
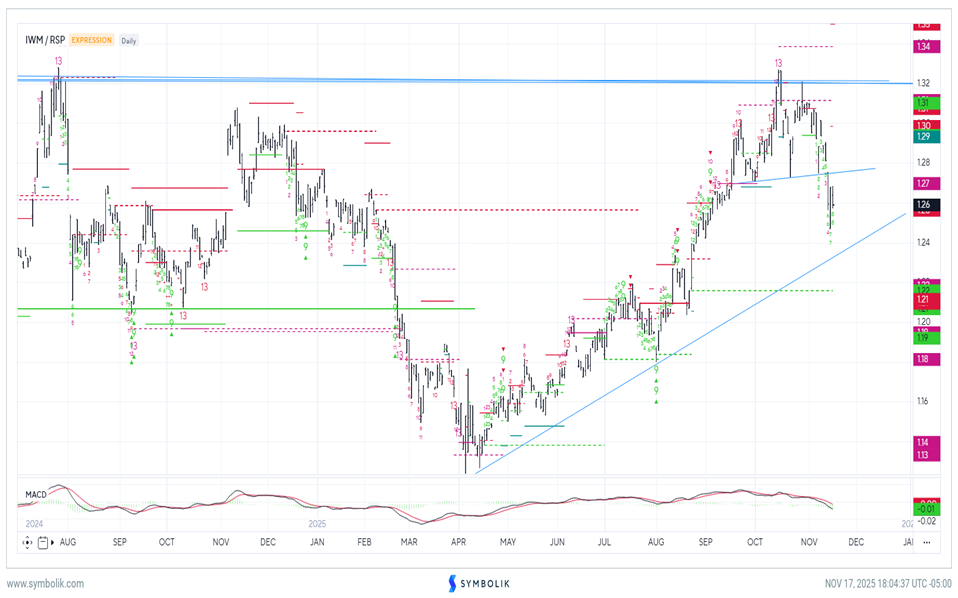
IWM stalled out near 2024 highs relative vs. Equal-weighted SPX in recent weeks before showing some underperformance.
However, this looks a bit overdone as monthly momentum indicators (MACD) remain positively sloped (not shown).
DeMark-based exhaustion might materialize over the next 1-2 days of weakness, and should set up for an attractive risk/reward opportunity for Small caps to strengthen between this week and mid-January.
Overall, despite a couple weeks of poor performance given lack of Economic data (and a minor retreat in the percentage chance of a December rate cut) the FOMC likely will still cut rates next month.
Bottom line, I don’t make much of this weakness, and it should line up with buying opportunities later this week. (Chart shown below is a ratio chart of IWM -1.94% vs RSP -1.20% .)
IWM/RSP