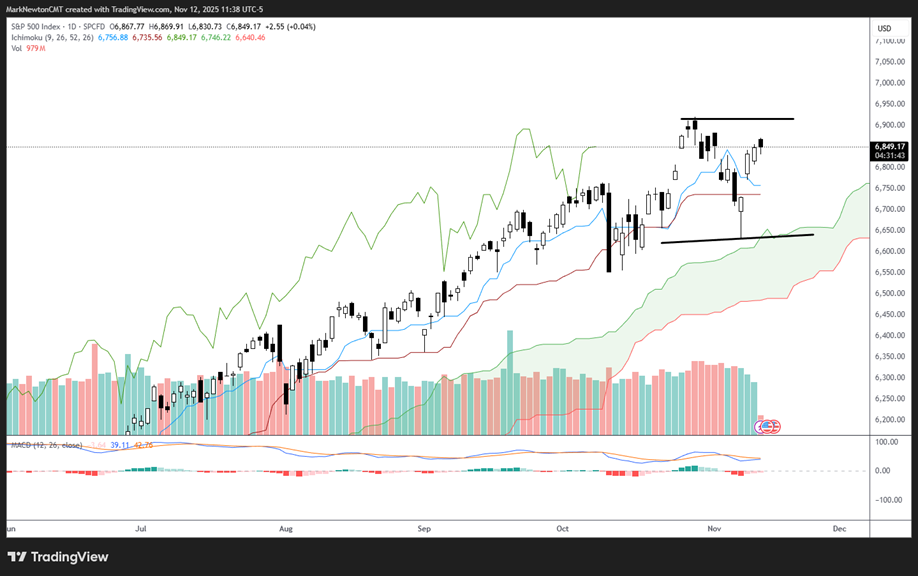
Near-term US Equity trends are bullish, but I expect Equities have entered a choppier environment, which might require some consolidation before SPX can push back to new highs. While I believe that last week’s lows should represent the probable lows for November, I’m unwilling to think that an immediate push back to highs is imminent. Many investors who are involved in many AI, Quantum, or Crypto miners, not to mention Precious metals stocks, since October can attest to this market feeling much worse than what the technical trend of SPX and QQQ might suggest. While Emerging markets and various commodities have begun to strengthen, it’s likely that Crude oil is likely entering a trickier period in the months ahead. At present, I am constructive on Equities, but sense that some backing and filling could happen this month before a move back to new highs gets underway.
While the House vote to end the Government shutdown happens Wednesday evening, much of this is likely factored into the market at this point and should not be a material surprise.
Near-term trends remain pointed higher from last Friday’s lows in ^SPX and QQQ 0.01% . Yet, the action in QQQ 0.01% in recent days has shown some meaningful divergence from ^SPX. Moreover, Indications of index strength, such as the percentage of broad-based gauges like Russell 3000 names above their respective 50 and 200-day moving averages, remain between 45-55%. Thus, nearly one-half of the entire Russell 3000 at this point is trading below its 200-day moving average.
Many investors certainly might be able to attest to some of the divergence of the broader market from ^SPX and QQQ 0.01% in recent months.
Bottom line, it’s tough to find fault with larger trends for ^SPX and QQQ 0.01% . These remain clearly still bullish. However, I suspect that the weeks ahead will still require consolidation, which would align with the cycle composite for ^SPX, which was shown last month. The composite shows clear cyclical weakness into late November/early December before a strong push higher.
As shown below, my thinking is that the October peaks might likely mark a temporary resistance for ^SPX. Conversely, but different from what many market bears expect, I do not expect that the October lows will be immediately broken. The resulting pattern, therefore, likely will prove choppy between now and November expiration, and might stay weak until right before the Thanksgiving holiday.
S&P 500 Index
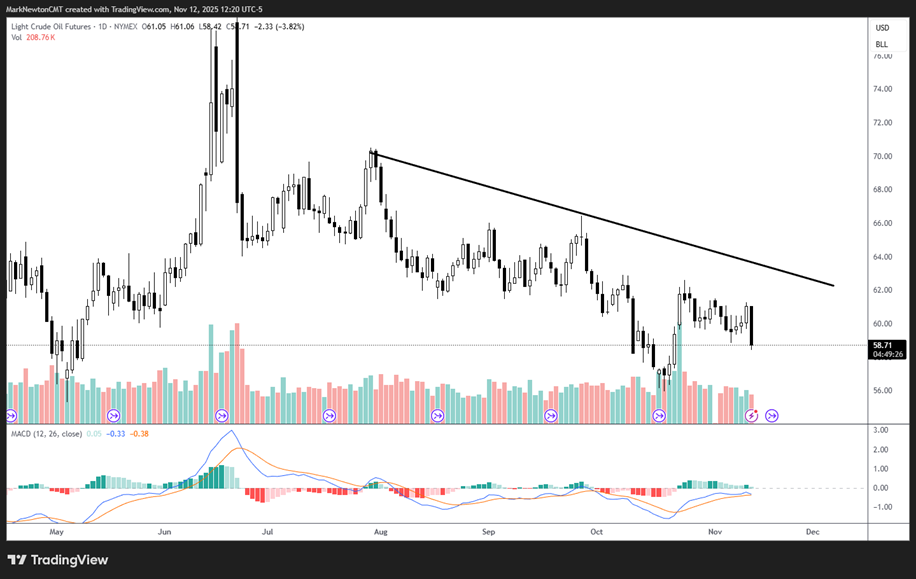
WTI Crude oil has reversed sharply enough, coinciding with bearish OPEC+ supply data, that any move higher likely will prove short-lived
My comments on WTI Crude attempting to move higher proved to be ill-timed given the sudden comments from OPEC+ + in the last 24 hours, and it’s important to comment on how today’s move affects the picture for the months ahead.
Today’s move in WTI Crude on the heels of this OPEC flipping their estimate for global oil markets from a deficit to a surplus is a bit of a game-changer. In the short run, this is very bearish fundamental news and goes against the bullish news on demand from the International Energy Agency’s recent discussion about demand rising for the next 25 years.
I had expected that WTI Crude might be able to move higher into late November before the plunge into year-end (which might last into January/February). Today’s move casts some skepticism about that. While Energy has been the best performing sector over the last week, last month, and last three-month period, based on Equal-weighted ETFs, I would utilize bounces in the next couple of weeks as a time to reinforce my Bearish Underweight on Energy between now and next February.
This very well could take WTI Crude into the $40’s. So while my commodity discussion last night was bullish, I expect the Energy part of this to be a drag in the short run. (Meaning from now until Late January/February of next year.)
Specifically with regards to WTI Crude oil technicals, the extreme high to low range of today’s trading and close near the lows of the session likely does take WTI Crude down to test October lows. Thereafter, I suspect a possible bounce can happen, which might keep Crude in the low-to-mid $60’s a bit longer. However, my three-month forecast on Crude is quite bearish and gels with the Underweight, which I feel Energy deserves, technically speaking.
With regards to OIH -3.46% , I am somewhat unclear at this point whether OIH -3.46% can push up to $305-$310 as mentioned last night. However, there has been no material break in the trend. This would require a violation under 277 and would suggest a slide in OIH -3.46% in the month of December.
As for 2026, I’ll discuss this as part of my Outlook on 12/15, but feel that weakness in Energy in the 4th quarter likely does create an opportunity for next year, specifically in the period from February into June/July.
Light Crude Oil Futures
Equal-weighted Energy vs. Equal-weighted SPX looks to be holding an area of resistance from peaks made in 2023
While Energy has been a strong one-month performer, I feel the relative chart helps to explain whether or not Energy can begin a period of outperformance vs ^SPX.
Given this lengthy downtrend from 2023, which remains intact, my feeling is that Energy outperformance is highly unlikely.
The bounce over the last month in the Equal-weighted Energy ETF vs. Equal-weighted ^SPX (RYE -1.28% vs. RSP 0.49% ) has not broken the downtrend of the last two years.
Furthermore, DeMark counts show a TD Sell Setup following this most recent runup in Energy performance over the last couple of weeks in this relative chart.
I sense that Energy’s trend vs. ^SPX likely should prove choppy but negative and pull back to new lows into early 2026.
While I certainly had a sense of optimism about the potential for a possible bounce, the negative fundamental news today, combined with the longer-term bearish technical position of the relative chart of Energy vs. the RSP, makes it unlikely that Energy will be able to bottom out just yet.
Movement back under $55.96 in front-month Crude futures likely should lead to a violation of $50 in Crude into the new year.
RSPG/RSP

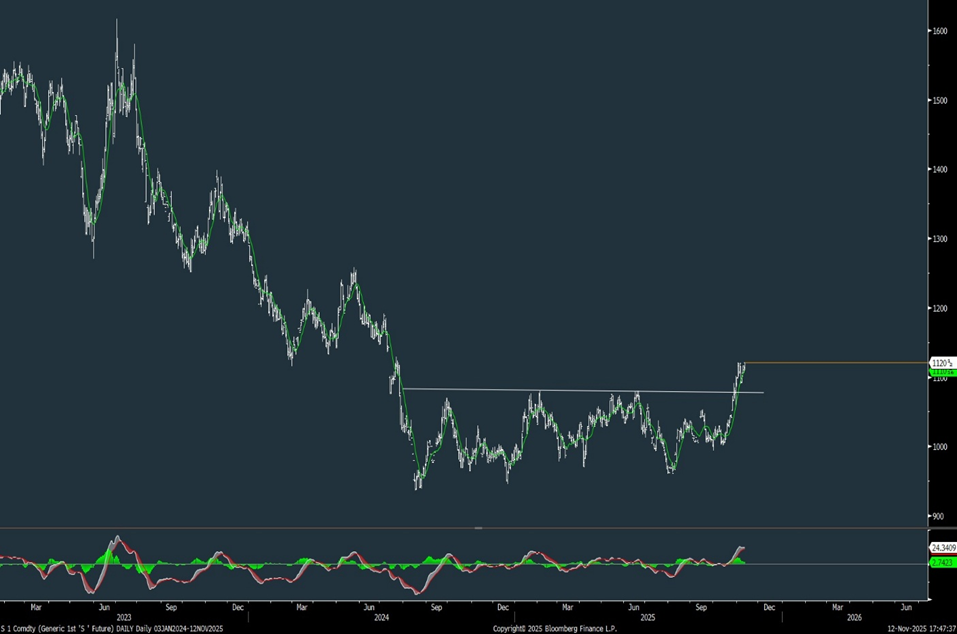
Soybeans breakout bodes well for Grains to start to strengthen
Last week’s agreement by China to buy 25 million metric tons of Soybeans annually through 2028 is something that resulted in a sharp breakout in the price of Soybeans last week, which had largely been range-bound for the last year. (This agreement also included the resumption of trade in other agricultural products such as sorghum and Hardwood logs.)
Technically, following a sharp two-year decline in Soybeans from 2022 into 2024, followed by a year-long sideways consolidation trend, I feel that this breakout back over $11/lb. per bushel is quite encouraging for the months ahead for Soybeans.
While a few ETFs exist by Teucrium that attempt to mirror the prices of the Grains, it’s important for investors to track the liquidity of these before making any decisions. The Teucrium Soybeans Fund has a ticker of SOYB 0.39% .
At this time, while both corn and Wheat look to have made some minor bounces off the lows, Soybeans look to be the strongest of any of the Grains at this time.
Generic 1st ‘S’ Future