Near-term US Equity trends are bullish, but SPX looks to be stalling near the highs of its channel resistance, and breadth has begun to wane sharply this week as Financials, REITS, Consumer Staples, Materials, and Healthcare are all lower over the past week. Top SPX constituent NVDA, meanwhile, has broken out and is rallying back to overbought levels. Yet, both MSFT and META fell after-hours on Wednesday and might serve as a near-term drag on SPX heading into Thursday. A few of the short-term cycles seem to come together with DeMark indicators to suggest next week could be important heading into November. However, pullbacks in the weeks to come aren’t thought to be serious enough to break early October lows near 6550 and should be buying opportunities. At present, Semiconductor Index (SOX) still looks to push higher into next week, and it remains difficult to fight the near-term momentum in Technology.
The key question as Big-Cap Tech earnings get underway is “When do all these divergences matter?” The bifurcation in US Equity markets has been growing more pronounced since July (where Tech rises, but the broader market doesn’t), and unless corrected in the near future, could have the effect of driving a minor consolidation if/when the Tech sector starts to peak out.
It’s not a technical positive when eight of 11 sectors are lower in the past month (only Healthcare, Technology, and Utilities are positive on a rolling one-month basis), and the percentage of Russell 3000 stocks that are above their 50-day moving average is just 47%.
However, as discussed yesterday, I generally feel it’s right to stay bullish and positive until trends are broken. (In this case, ^SPX is pulling back under 6550, which is growing increasingly more distant.) While consolidation from near-term overbought levels is certainly overdue, signs of Financials starting to stabilize will be a welcome step towards helping to add conviction to the idea of a broader rally.
At present, the risk/reward to me, technically based on a combination of cycles, DeMark tools, Elliott-wave, and traditional trendline-based resistance for many stocks, looks sub-par for the next few weeks.
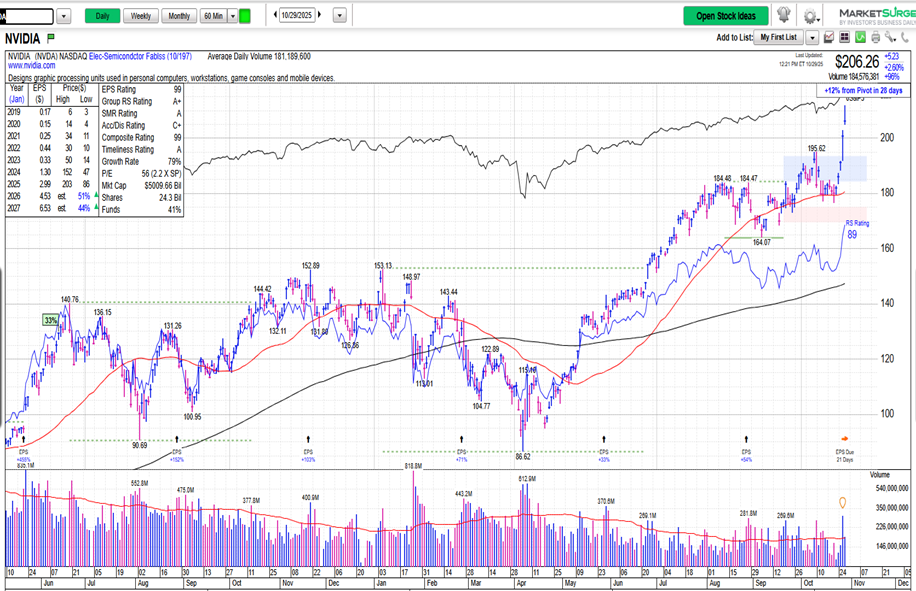
Below is a chart of NVDA -2.88% , which has surpassed $200 and briefly exceeded $212 today, which represented the first time a US company has exceeded the $5 trillion level. It goes without saying that at 8%+ of ^SPX, this remains a very important stock to watch carefully.
To reiterate some comments posted earlier to Flash Insights,
(NVDA -2.88% ) is short-term in need of consolidation, but tough to get too bearish with this over 195. Weekly DeMark signals & daily are absent here, so some minor backing and filling are possible, but it will be tough to get too bearish on NVDA -2.88% until this breaks below prior peaks at 195, which largely line up with the short-term uptrend. I suspect this might get to $215-$220, but it pays to keep stops tight given the overbought nature of SMH -2.27% having surpassed my target at 370. Backing and filling might ensue before a final stab higher into early November, and $185-$195 makes more sense for technical support to buy dips into November, vs. reaching for this near today’s highs at approximately $212.
NVIDIA
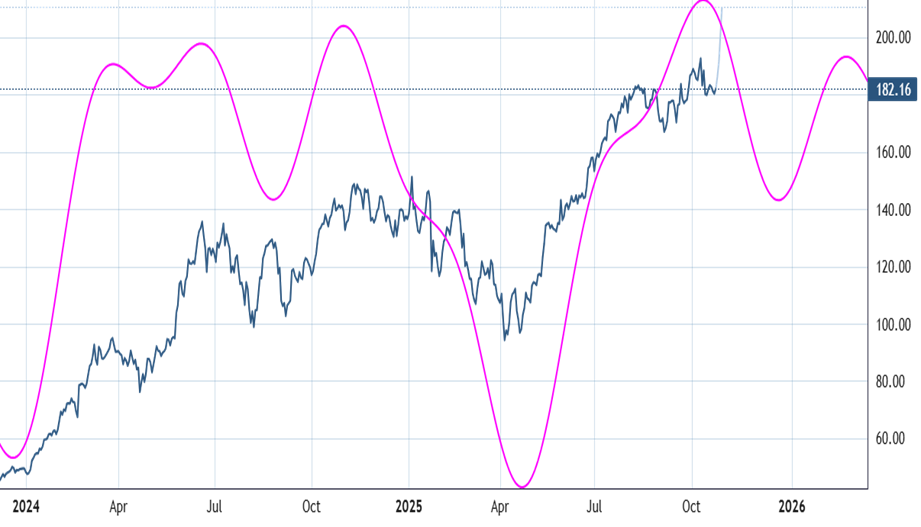
NVDA cycle looks to fall into early December before a sharp rally into January
Interestingly enough, the stock’s recent parabolic push to $212 looks to be defying what NVDA -2.88% ’s daily cycle composite says might be likely between now and early December.
While it’s always best to utilize trendlines to understand when a trend might be giving way (and for NVDA -2.88% , this lies near $195), the stock remains bullish but overbought at present, but has shown little evidence of wanting to turn lower.
I expect that the next few weeks might bring about some consolidation for NVDA -2.88% and other Semiconductor names, but it’s hard to get bearish on NVDA -2.88% when this is over $195. Until/unless that happens, it’s going to remain technically attractive.
If this does start to reverse course, I expect that its weighting within ^SPX and QQQ -1.31% likely does result in some short-term backing and filling for the broader market.
Note that the pink line (amplitude) of NVDA -2.88% ’s possible direction is based on three distinct short-term cycles put together as a composite. Despite their success in the past, there’s no guarantee that this cycle projection will continue to work. As always, these cycle composite charts do not imply that NVDA -2.88% will reach the magnitude shown by any correction or advance, as they represent amplitude only. Thus, the turning point on these composite charts looks more important than the extent of the advance or decline.
NVDA Cycle Composite
Financials continue to lag performance, making a broad-based rally difficult at this time
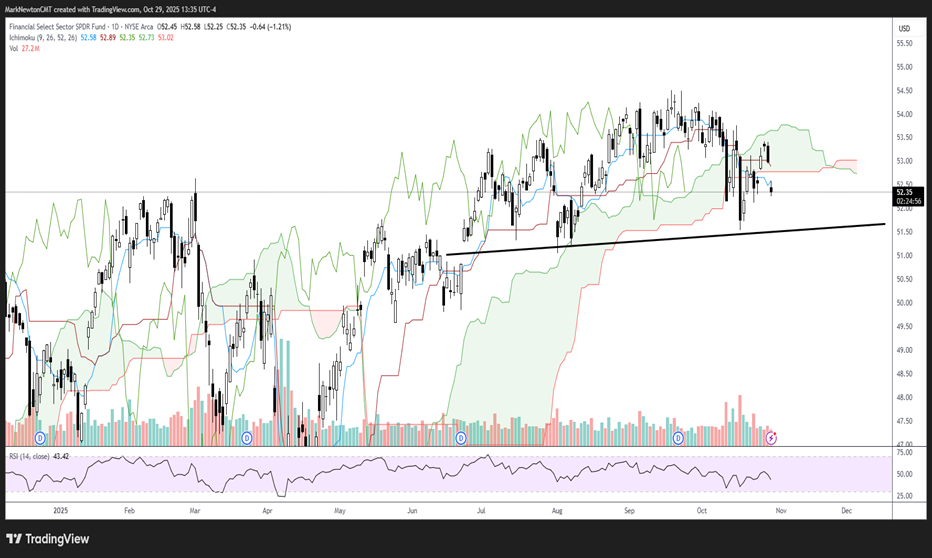
This XLF -0.23% chart below, as the Financial Select SPDR ETF for the Financial sector, has largely moved sideways in range-bound consolidation since June, following its sharp runup from April.
Given that Financials are the 2nd largest sector of the S&P 500 index behind Technology, this has the effect of causing a “thin” rally as one of the leading sectors within SPX has just not been participating lately.
This grew more pronounced this week as Fiserv dropped over 40% on Wednesday, and many of the key Insurance names within XLF -0.23% , like AJG -0.26% , BRO -0.50% , PGR -0.21% , and EG -0.10% , have all dropped more than 10% in the rolling one-month period.
In the short run, I expect a bit more weakness in the month of November. However, my technical analysis suggests that $51.50 should serve as strong support and likely can provide a floor to further selling pressure in the next month.
Financial Select Sector SPDR Fund
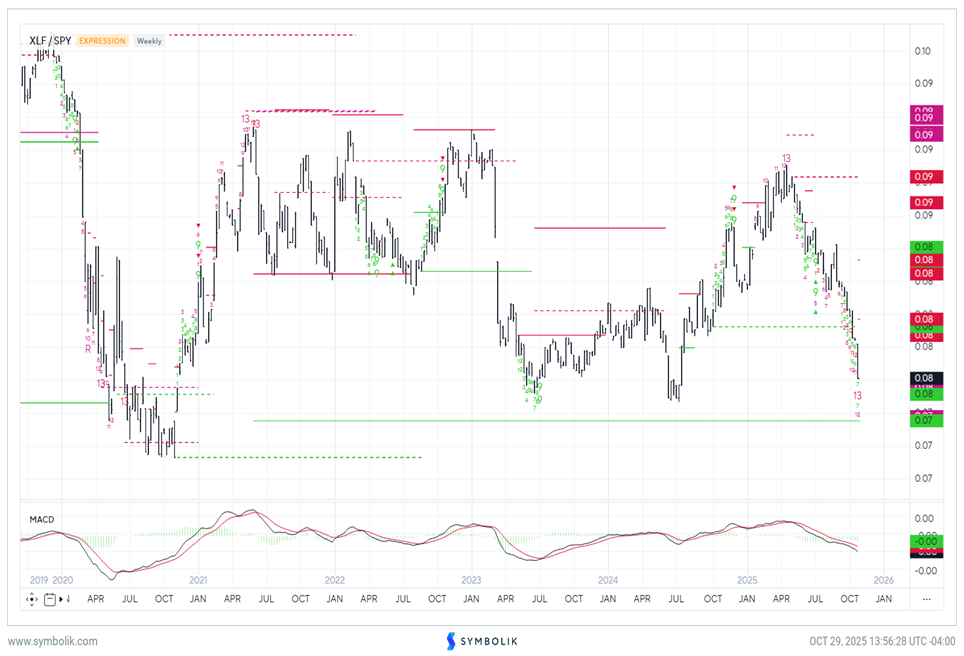
Financials relative to SPY have nearly reached 2024 lows, and I expect that Financials should start to stabilize and turn back higher in November
This ratio chart of XLF -0.23% to SPY -0.95% really helps to put this weakness in Financials into perspective. As seen below, this sector has shown chronic underperformance for the last month, with the last two weeks being particularly difficult.
However, the good news for Financials “bulls” is that this ratio level is nearing very important former relative levels where XLF -0.23% bottomed out in the past vs. SPY -0.95% .
Moreover, DeMark-based exhaustion signals might materialize on any further decline into November within the next couple of weeks.
Overall, I expect Financials to stabilize in November and turn higher, providing a broad-based rally which has proven lacking in recent months. I remain overweight in Financials despite this short-term weakness, and do not expect this to prove long-lasting in scope or duration.
XLF/SPY
Advance/Decline line for “All NYSE Stocks” has waned since July
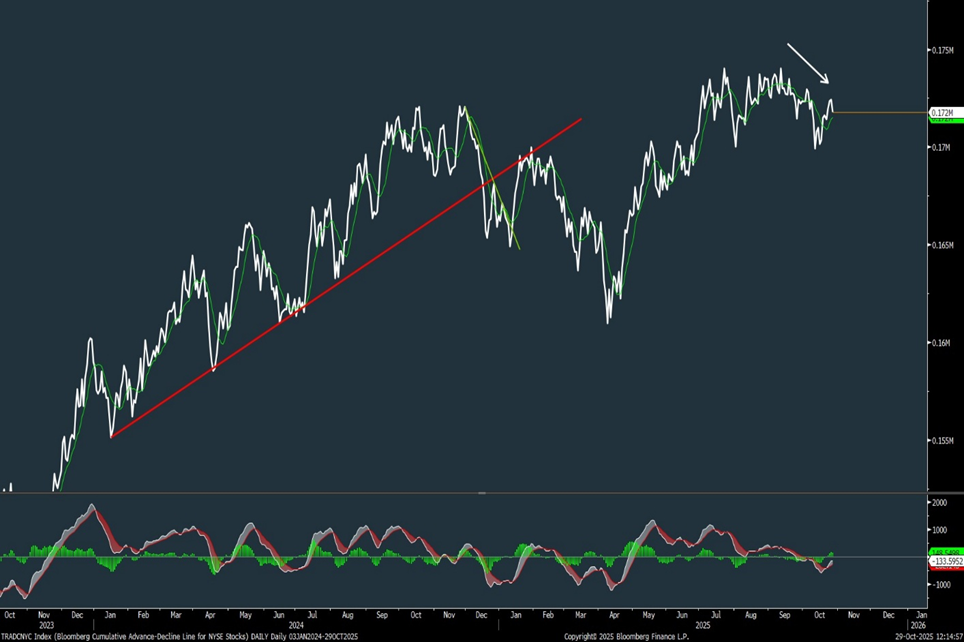
When looking at the Bloomberg Cumulative Advance/Decline line for NYSE stocks (TRADCNYC- Bloomberg) (“AD Line”), we see that this has been slumping since July of this year.
While not bearish per se for indices, it certainly could become an issue if this starts to turn down more rapidly. Thus, if Technology peaks out from an overbought state and other sectors don’t “come to the rescue,” this could be the technical catalyst that helps to illustrate why ^SPX and QQQ -1.31% might begin to consolidate the rally.
Back in 2024, this snapped a multi-month uptrend (shown in red) right near the end of 2024, which demonstrated the dropoff in stocks from their 52-week highs, which began in earnest before the broader market peaked out in early 2025.
In order to avoid this happening again, I feel it’s important for the “AD line” not to move lower to violate October lows. Such a development would make it difficult for ^SPX to continue its advance above 7000 without consolidation, and I do expect that some type of consolidation should happen in November.
At present, it’s important to keep a close eye on the Advance/Decline line (for all stocks, not for all securities that contain fixed income) for evidence of this starting to weaken further.
TRADCNYC Index