Near-term and intermediate-term technical trends remain bullish for US Equities, and Monday’s rally gave some much-needed confidence that SPX should push back to new highs over the next week, given above-average breadth and a drop in both the US Dollar and US Treasury yields. While August has proven quite negative seasonally speaking in post-election years since 1950, I don’t suspect much of the weakness gets underway until the August expiration. Overall, it’s technically right to favor that this SPX rally can continue into mid-August before any “stalling out,” and there should be a similar rally in Treasuries, Euro, and Yen vs. the US Dollar. While technical risks are certainly rising in recent weeks, it looks premature to concentrate on these at present as indices begin a climb back to new all-time highs and trends remain positive. My view is that this coming week could prove to be the most positive week of performance for August before some slowdown gets underway.
Tuesday’s minor weakness looked like a “speedbump” only and not anything indicative of real weakness in US Equities. Equal-weighted ^SPX showed just a scant -0.28% loss while IWM -0.92% rose nearly +0.50% on the day.
Additionally, there was some meaningful evidence of hard-hit sub-sectors like Transportation making meaningful rebound in the last couple days and six sectors rose on the day out of 11 of the major Equal-weighted ^SPX sector ETF’s.
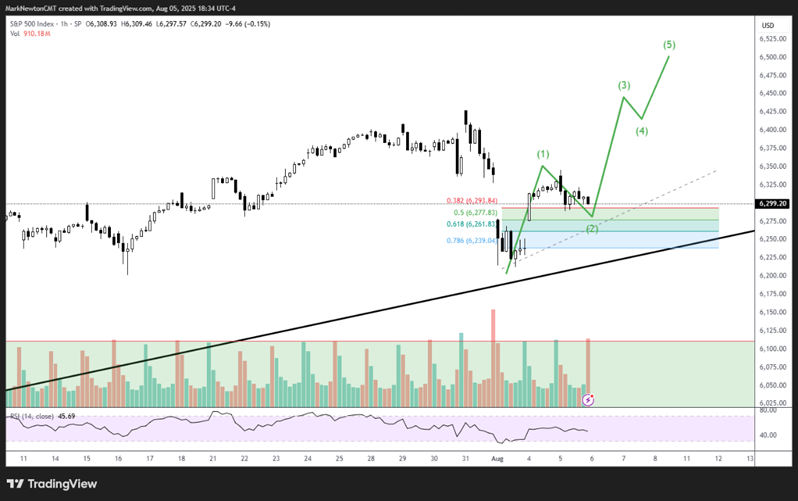
As shown below, SPX suffered no structural damage on Tuesday’s pullback, but similar to Bitcoin, consolidated its sharp rally up from 8/1 lows in an “ABC” type manner.
I anticipate that a minor weakness is possible on Wednesday morning before ^SPX attempts to bottom at support between 6260-6280. Only if 6212 is broken would the short-term technical structure change to more bearish. Unless that happens, it’s right to expect SPX is a very attractive risk/reward with roughly 20-40 points lower with upside to potentially 6500-6550.
My path for early SPX’s early August advance could possibly unfold like the pattern below.
S&P 500 Index
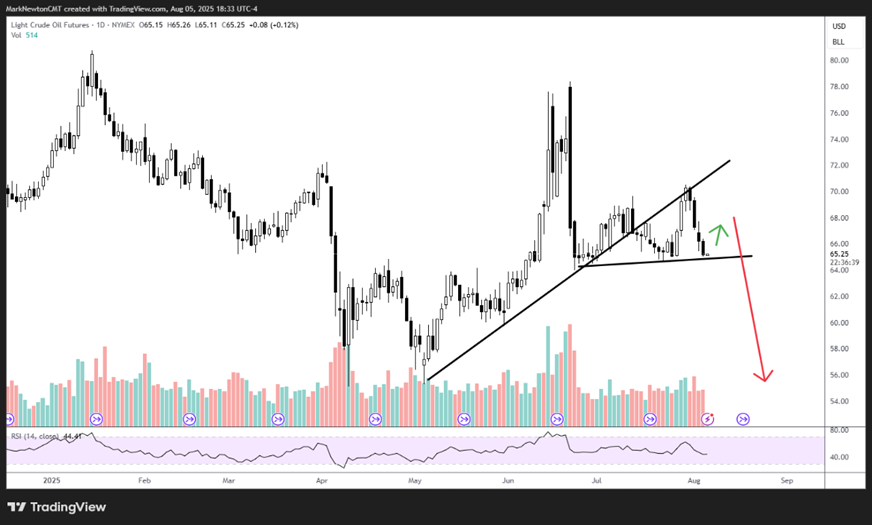
WTI Crude looks to have kicked off its decline down to challenge May lows in the mid-$50s
The four-day decline in Crude oil over the last few days was much deeper than what should have occurred if/when Crude was setting up to build on a possible period of stabilization in July.
This looks quite bearish for the month of August, and I expect that this month should be negative for Crude performance along with US Energy equities.
The administration has highlighted its desire for Crude to fall in order to pressure Russia into peace talks, and technically, this looks to be quite possible after momentum turned sharply negative this past week based on traditional gauges like MACD.
While the WTI front-month Crude future would appear to be at minor support formed by June/July lows, I don’t suspect any bounce gains will gain much traction before a sharp pullback to undercut July lows.
Any decline under $64.71 in front month Crude has little support until the mid-to-high $50’s and it’s likely that Energy underperforms sharply in August before turning higher.
Important support for the major Energy ETFs lies at the following levels:
XLE -0.95% - $84
OIH -0.49% - $231.65
XOP -0.67% - $124.36 (Note, XOP looks to have taken the lead in turning lower and already violated its initial support last Friday)
Violating these levels above would lead to above-average weakness in August, which likely retraces at least 50% of the rally from April. (This has already happened in XOP.)
While I have a Neutral rating on Energy technically speaking, I expect WTI Crude oil to experience an August selloff but eventually find support and begin trading higher from September-December as cycles start to turn higher.
Light Crude Oil Futures
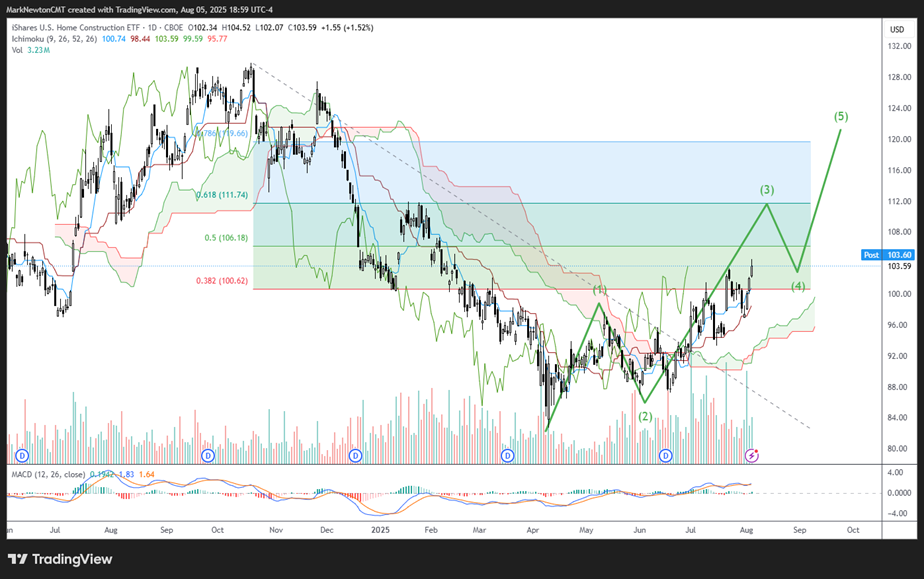
Homebuilder ETF has broken out, and Building stocks should outperform in the months ahead, given lower rates
Following a difficult period of underperformance from last October 2024, Homebuilder stocks have begun to turn back up sharply.
I discussed this back on July 22, 2025 in my daily report on Homebuilders initially which was titled “Homebuilders look appealing after 1H Underperformance”, which highlighted XHB -1.67% .
Today I’ll look at the US Home Construction ETF, ITB -1.94% , which has a slightly different composition, but similar to XHB, has begun to turn up sharply in recent weeks.
Wednesday’s breakout above July highs represents the highest daily close since February of this year. Additional upside looks likely to $106, then $111, with eventual targets found near $120.
Both ITB and XHB have made good headway this year as US Treasury yields began to pull back. The secondary bottoms in ITB which happened in late May and then again in June of this year happened nearly exactly as US Treasury yields began to peak out. The breakdown in yields this week looks like a bullish omen for ITB, and I expect upward follow-through as yields fall in the weeks/months to come.
I expect a sharp two-week rally followed by some consolidation in late August/September followed by a turn back higher in October.
iShares U.S. Home Construction ETF