Short-term trends in US Equities remain bullish, and despite some slowing in the breadth and momentum that has taken place in the last few weeks, uptrends remain intact. While a rally over February peaks should happen this Summer, it’s hard to make a technical call for an immediate breakout. Both SPX and QQQ likely will find resistance near February highs that allows for consolidation in late June ahead of a push back to new all-time highs. Meanwhile, both Treasury yields and the US Dollar are likely to begin trending lower in the weeks to come. Meanwhile, Safe-Haven trades like Japanese Yen and Gold should be starting to turn back higher, and I expect that Equities can still rally despite this happening into mid-June. I favor Industrials, Financials, Technology and Utilities, while Emerging markets also have appeal given the drop in the US Dollar. Overall, a push up to between 6000-6150 is likely for SPX, while QQQ should rally to 540 before some minor stalling out.
SPX turned in its best month of gains in May since Spring 2023. This is encouraging, as Technology managed to outperform all other sectors in May and is steadily making progress in erasing its early-year underperformance.
The positives look to be as follows: Momentum and breadth have improved substantially on an intermediate-term basis, and ^SPX and QQQ 0.89% show weekly MACD having crossed over to bullish territory on their weekly charts. Moreover, DeMark exhaustion remains premature even on a weekly basis, requiring at least another two weeks when eyeing QQQ 0.89% and MAGS 0.91% (Roundhill Magnificent 7 ETF), and likely can help push markets higher into mid-June. Furthermore, both retail and institutional sentiment has not nearly recovered to the extent that sentiment can be called bullish despite a 20% rally off the lows from early April. While sentiment has certainly gotten less bearish, most CTA’s and Hedge funds aren’t nearly as bullish as might be expected after such a recent move.
However, there has been some minor stalling out in breadth and momentum on a short-term basis, given the stalling out since early May. While ^SPX managed to recover to close only partially negative to finish out the month of May, US indices have struggled to follow-through on the early momentum push that was present in April. This isn’t too much of a bearish factor in the near-term as long as indices begin to push higher right away in the month of June.
Ideally, my expectation is for US Equity Indices to push higher over the next couple weeks before encountering resistance potentially right ahead of June Expiration. Following some minor seasonal weakness which might result in some backing and filling, a sharp rally seems likely into August.
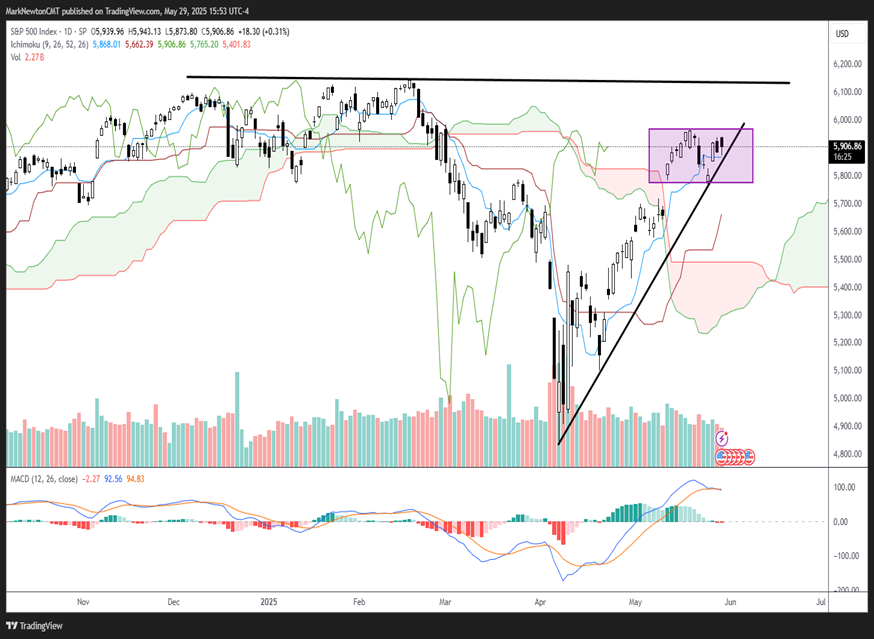
As seen below, the most likely area of strong resistance lies near all-time highs near ^SPX-6150. Overall, I do not expect this area to be immediately broken. However, ^SPX should be starting a push over 6000, which likely gets underway in the first week of June. Thereafter, US indices might begin to stall out into mid-June.
S&P 500 Index
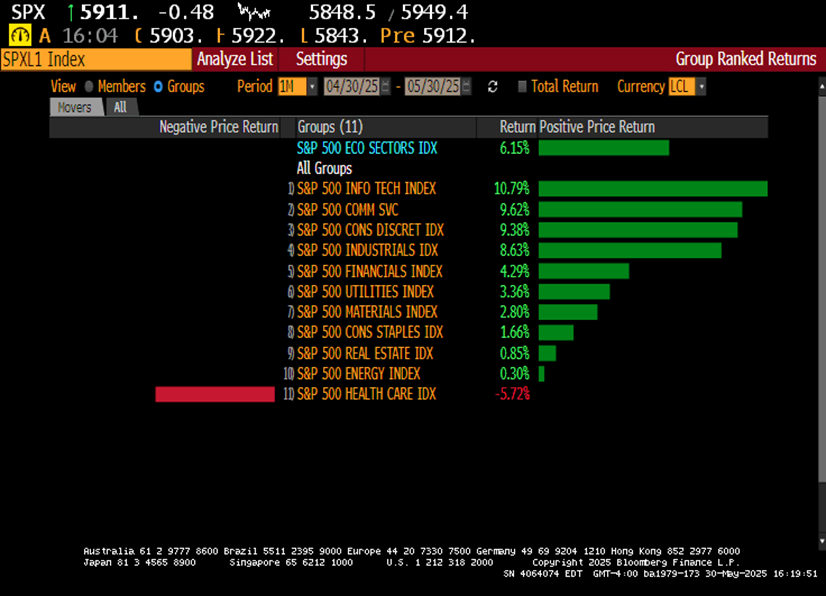
May performance shows strong outperformance by Technology
When studying this past month’s leaders and laggards, it’s apparent that Technology has begun to show excellent relative strength in its recovery over the past eight weeks from early April.
This is encouraging given Tech’s presence within ^SPX, and other sectors like Commercial Services, Consumer Discretionary and Industrials also turned in performance over 8% for the last month. I view this participation as positive for US Equity indices.
Meanwhile, Healthcare was the only major ^SPX sector (of 11) that finished down for the month. I am lowering Healthcare to an Underweight technical rating for the next month, as I suspect additional underperformance could be likely given recent lagging behavior in BDX -0.62% , TMO -0.28% , LLY 2.04% , UNH -1.66% , COO -0.07% , and others.
Energy was the second worst sector in the last month and also likely weakens further in June before a possible bottoming out in this sector as Crude pulls back to a cyclical bottom potentially in June/July timeframe. At present, both Energy and Healthcare look like Laggards, along with Consumer Staples.
SPXL1 Index
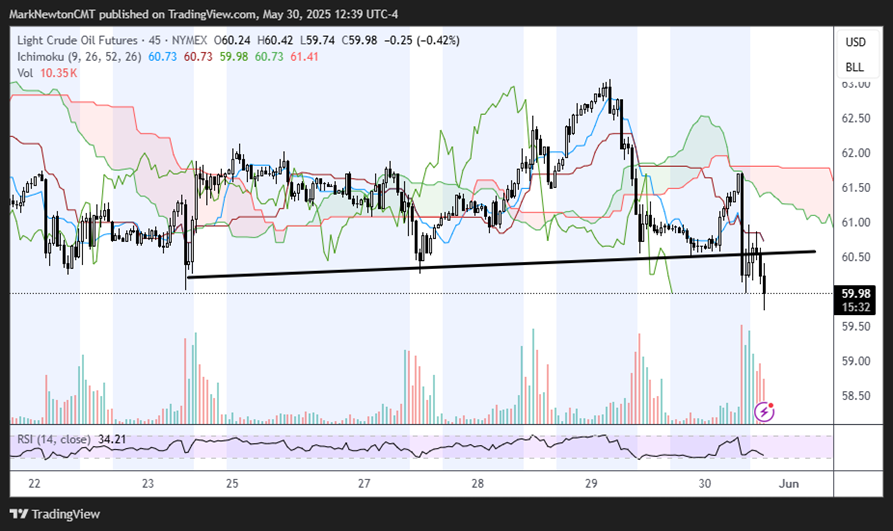
Crude oil should be starting its descent to undercut May lows
Given the strong hints of OPEC’s continued high output quotas, it’s likely that WTI and Brent Crude oil will continue to fall in the month of June.
Crude’s breakdown mid-day on Friday looked negative technically, and WTI Crude futures should be starting to weaken into mid-June into July which could be important from a cyclical standpoint.
Overall, as has been discussed in recent weeks, Energy remains a technical Underweight, and I expect further weakness in Crude and in many parts of Energy, specifically the Exploration and Production issues, and Oil Services stocks.
It’s my expectation that May 2025 lows of $55.30 should be broken, and would set up for a possible bottoming out in Crude oil into the Summer. At present, Crude along with the Energy sector remain vulnerable.
Light Crude Oil Futures
Healthcare likely to weaken in June before possibly stabilizing in July
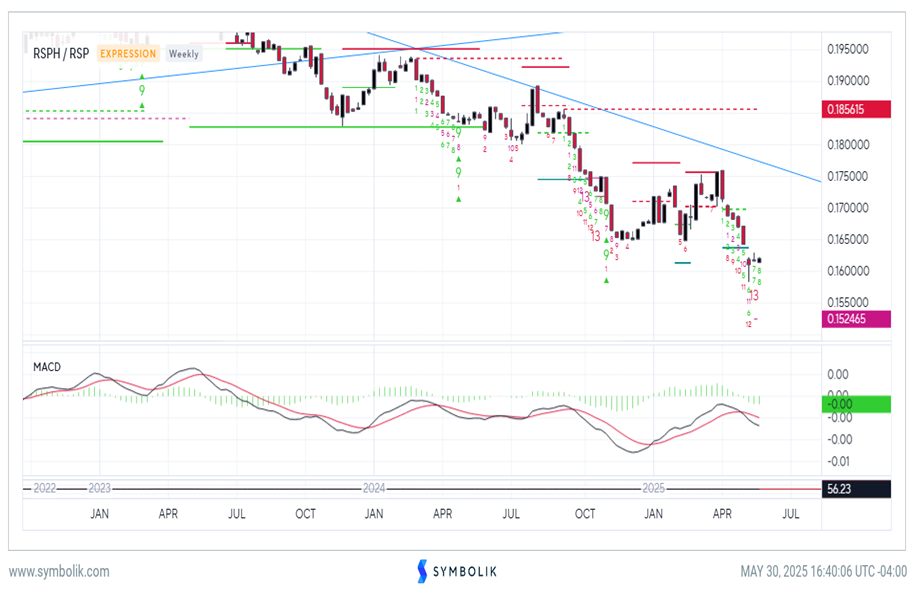
Healthcare’s ratio chart vs. the S&P 500 in Equal-weighted terms (RSPH -0.26% vs RSP -0.06% ) looks quite weak as the month of May has come to a close.
The May decline to new yearly lows in Healthcare is likely to put further pressure on this group, despite June being a seasonally positive month for Healthcare.
I anticipate a sharp decline in relative performance for Healthcare given May’s weak performance, and could set up for an oversold bounce in July.
At present, it’s worth lowering my Neutral technical rating in Healthcare to an Underweight, as I anticipate further lagging behavior in June.
RSPH/RSP
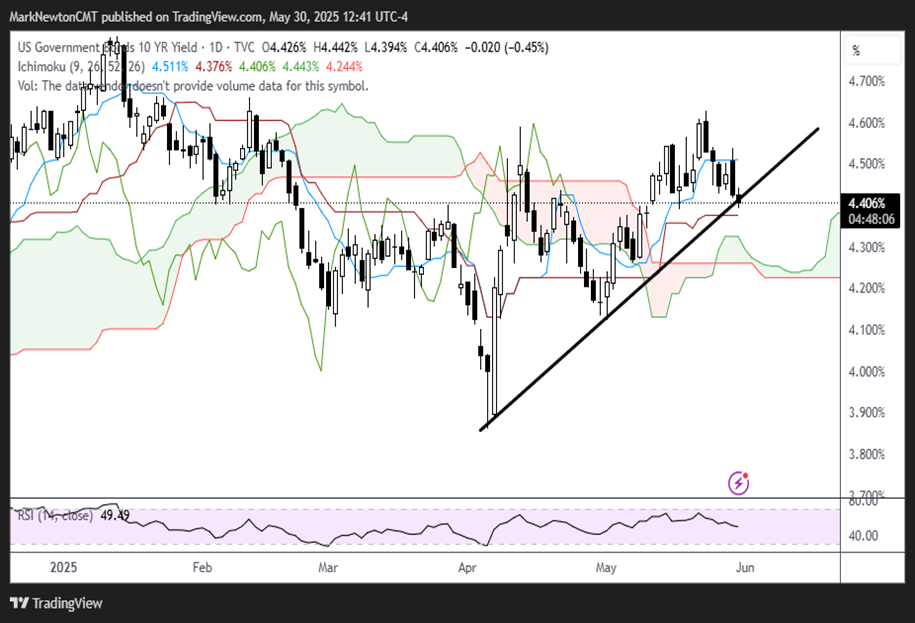
Treasury yields have likely begun their descent into August
Recent strength in Treasuries has largely been opposite to what positioning had been expected by many Institutions and retail investors, who all expected inflation to rise, and for yields to trend back to new monthly highs.
As discussed in recent weeks, I feel the opposite. My expectation is for Treasury yields to trend lower to test and break down to new monthly lows as inflation dissipates on falling Energy prices, and disinflationary Economic data, similar to what was seen on Friday.
As seen below, the US 10-Year Treasury Note yield index has officially broken the uptrend from April lows and should be starting its pullback in the weeks to come.
This would gel with the cycle composite that calls for lower yields into August, and it’s my view that both Equities and Treasuries can both push higher into August (Stocks rally as yields weaken).
US Government Bonds 10 YR Yield