This remains a choppy market for US Equities in the near term as part of a stellar ongoing intermediate-term uptrend, which has shown no evidence of deterioration despite any of the recent DeepSeek and/or Tariff-related volatility spikes. Friday’s sharp reversal indicates a minor reversal is now underway for both Equities and Treasuries. Sentiment regarding tariffs and their possible negative implications for the US Stock market has gotten quite bearish for both the Equity and Bond markets and I suspect that weakness in both should create attractive opportunity into mid-month. Rallies back to new all-time highs will likely take time, but it’s expected that the next large move should involve both stocks and Treasuries pushing back higher after this minor consolidation has run its course. Intermediate-term trends are bullish, and pullbacks at this point will likely hold at 6000 before pushing up above 6121. Such a move would likely coincide with a move up to 6300.
Friday’s decline followed four straight days of prices pushing higher this past week, and both SPX and QQQ managed to make progress toward the highs of their respective trading ranges.
Unfortunately, Friday’s better than expected employment report (not the Headline number, but the upward revisions along with wage and Unemployment data) resulted in Bond yields reversing course back higher after the early week breakout.
Given the correlation to US stocks, Stock indices began to roll over promptly as the better-than-expected economic report was seen as negative for the potential for rate cuts.
While both tariffs and inflation could eventually be factors that cause depreciation in risk assets, for now, it’s more the fear of the unknown than any tangible evidence of this resurfacing.
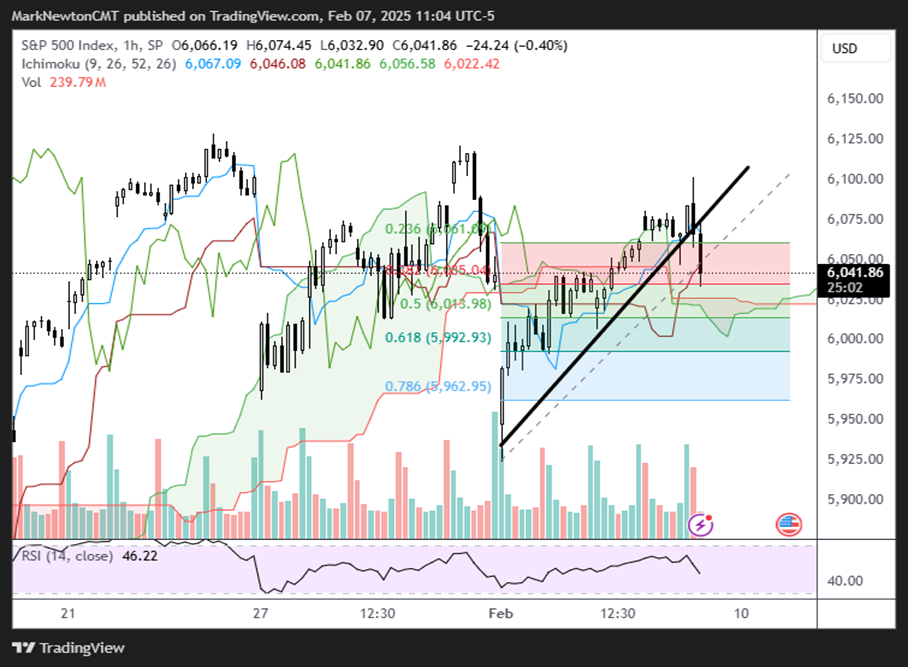
As this SPX chart shows below, the trend reversal happened just as the price neared the prior peak of this ongoing consolidation pattern.
Thus, while many are wondering if the trend is up or down on a short-term basis, the answer is really neither. Trends are neutral and have been for nearly two months as part of an ongoing uptrend.
This hourly SPX chart shows the two peaks from late January followed by this week’s Equity peak, which has led to a break of this week’s four-day uptrend.
Overall, this reversal isn’t overly bearish but can lead to a 50-62% pullback of this past week’s rally as part of this ongoing choppy consolidation. Only if the price undercuts last week’s lows near 5925 would volatility really start to spike, and SPX might be vulnerable down to 5750.
At present, I believe the more likely scenario calls for a few more days of SPX downward pressure, which does not get under 5960 before the price starts to head back higher. As mentioned in Thursday’s report, it’s expected that 6000 might be an optimal area where SPX might bottom, which lies just marginally under current levels. The degree to which this decline slowly crawls lower vs. gaps down sharply will tell a lot about the path forward, making the first couple of days of next week important.
S&P 500 Index
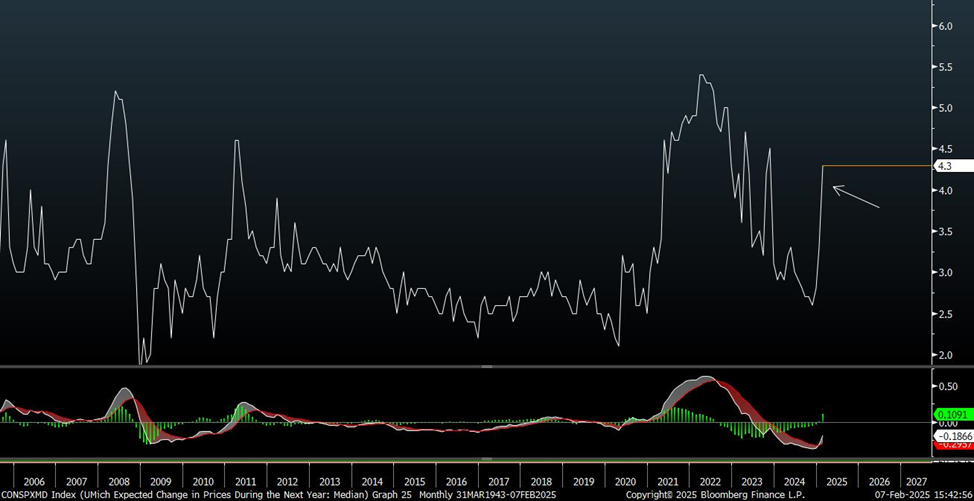
Michigan Consumer poll shows a sharp uptick in “Expected Change in Price during the Next Year.”
Today’s miss in Non-farm Payrolls didn’t seem as important for the stock market as the degree of positive revision change to December’s numbers.
Furthermore, this was coupled with a 4.3% reading in the expected change for prices in the next year. Note, this survey covers investor expectations rather than movement in inflation itself.
Thus, a spike in these surveys helps to capture the current bearish sentiment regarding the media’s constant mention of Tariffs and/or inflation. Moreover, they don’t seem to be calculating the degree to which Crude going lower or a weak China could serve to counterbalance any rising prices. I don’t see this as bearish, but it is merely an interesting observation. I look into the audience’s mind, which has become overly sensitive to the possibility of tariffs derailing the market rally.
CONSPXMD Index
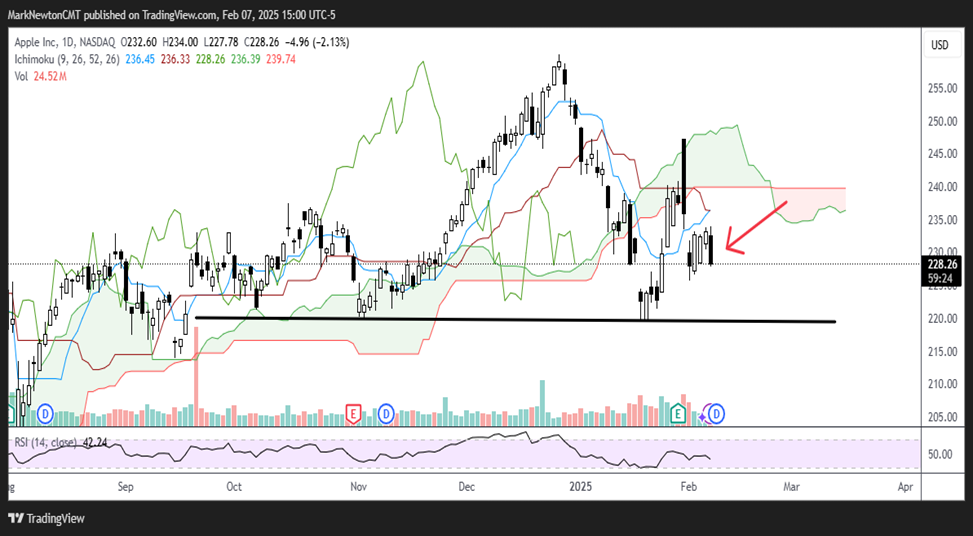
AAPL’s failed rally attempt helps to paint the picture of SPX’s possible trajectory
AAPL -0.44% bounce this week proved to be a bit lackluster, and today’s decline is taking AAPL down to multi-day lows.
This is a temporary negative for AAPL, and structurally, I suspect that a pullback to test 220-221 might be underway. Any break of 225.70 would make the stock technically appealing, as I do not expect a move under 220 right away. Thus, this AAPL weakness is weighing on SPX and QQQ and appears to have another few days of weakness before it’s complete.
Any signs of AAPL nearing prior January lows would actually represent an appealing risk/reward, as I do not suspect AAPL will break January lows.
Apple Inc
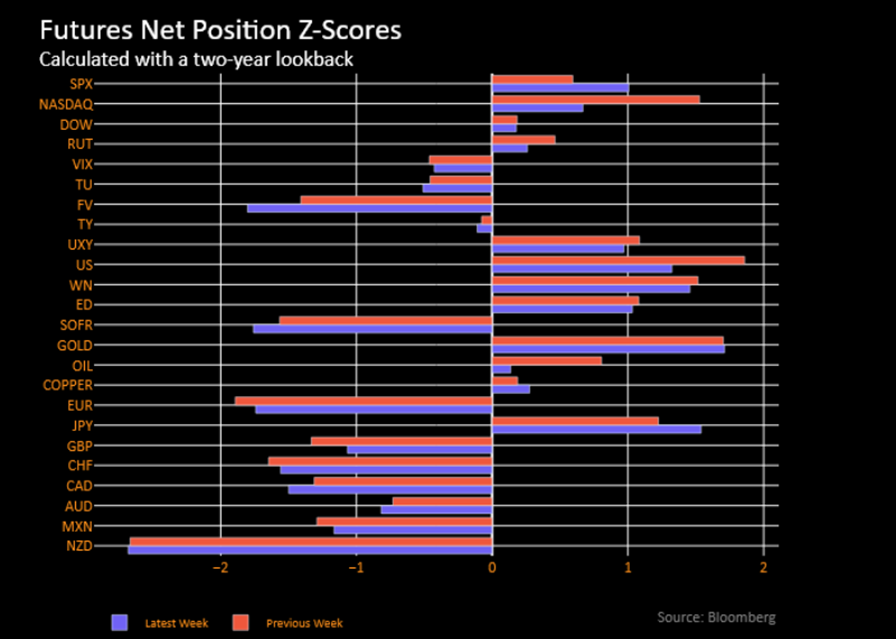
The last CFTC positioning update shows some clues
This past week’s Commitment of Traders report (CFTC) has been released, showing futures positions as of this past Tuesday’s close.
Interestingly enough, in fixed income, traders sold bond futures across the board, with notable selling in 5 year Treasuries as well as 2’s, 10’s, long bonds and Ultra’s.
At the short end, the Secured Overnight Financing Rate (SOFR) short increased by 103k, taking the short position to 747k, the largest since March 2023, just ahead of the mini-banking crisis.
I see this huge short positioning as being quite bullish for Treasuries given the recent trend breakdown and momentum having rolled over to bearish.
Thus, the fear of tariffs leading to higher prices seems to be spooking the market in a way that’s not quite apparent when looking at the actual technical trends of yields this past week.
The bottom line is that I anticipate just 2-3 more days of Treasury yields rising at a maximum before yields begin to start to trend lower in the weeks and months ahead.
The chart below highlights the Z-scores of speculative futures positioning with a two-year lookback window.