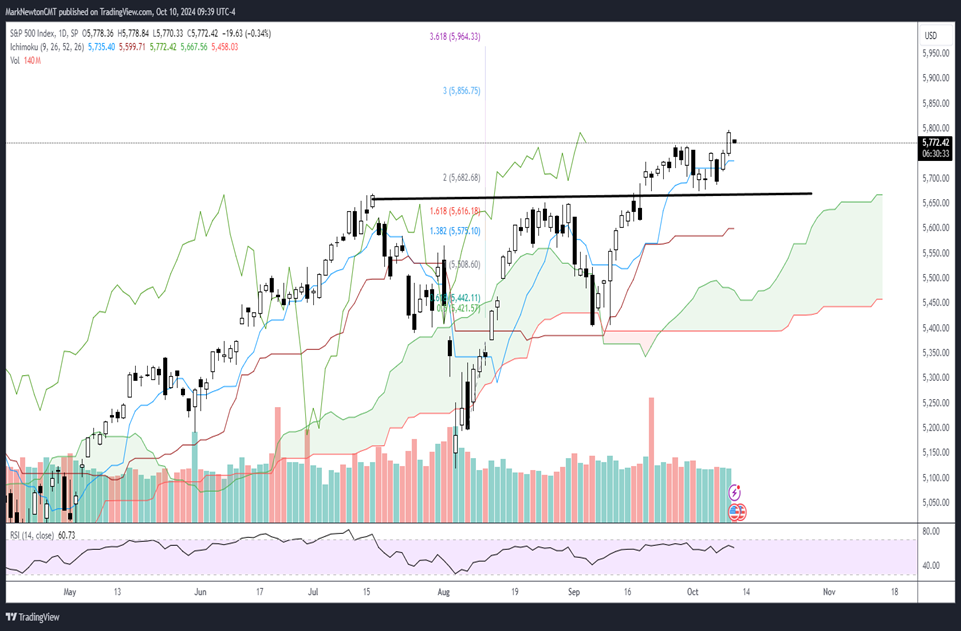
US Equities remain on good footing, despite the recent backing up in US Dollar and US Treasury yields over the last couple weeks. Both SPX and DJIA have successfully pushed back to new all-time highs, and NASDAQ should approach its own all-time highs within the next week. Moreover, most of Europe along with Japan is now signaling that a coming pushback to all-time highs could be getting underway. Overall, I expect that risk assets should still work well into October expiration before a possible stall out into a traditionally very negative seasonal week for stocks. For now, technical structure, momentum, and breadth have improved markedly in recent weeks, while sentiment is not yet bullish enough to think Stock indices might peak out. SPX target lies at 5835, and QQQ should find resistance at 503-505.
No change from yesterday’s thinking as this minor consolidation in Thursday’s trading makes SPX more attractive on a risk/reward basis for a rally into late next week. The combination of Technology, Industrials, and Financials sectors all breaking out of triangle formations in recent days is thought to be particularly good news for the prospects for US Equities in the short run.
It remains the case that intermediate-term breadth along with momentum and technical structure continue to look quite bullish, and this rally back to new highs has certainly been led by more than just Technology. Discretionary, Industrials, and Financials have all shown formidable strength of late and are all thought to likely lead into the end of next week.
While I do harbor short-term concerns if SPX gets above 5830 given the negative effects of waning momentum on slowing price action since mid-September, Wednesday’s pushback to new highs looks to be a definite positive into October expiration. (I label next Friday’s expiration, 10/17, as the first important turning point in October, and will discuss reasons for this into next week.)
For now, the positives involve technical structure, intermediate-term bullish breadth, short, and intermediate-term bullish market cycles, strong momentum, Elliott-wave patterns, bullish seasonality, and lack of counter-trend weekly DeMark-based exhaustion signals on Equal-weighted SPX.
The bears cite negative momentum divergence, intermarket divergence (NDX not at new highs), a slowdown in short-term market breadth (given recent sideways action in recent weeks), and an escalation in short-term bullish sentiment.
The most important of any of these factors arguably is technical structure. Thus, as long as SPX is pushing higher, given its pushback to new all-time highs, the more difficult a bearish stance will be. I expect that Friday of this week into Friday of next week should allow for a sharp rally back above SPX-5830. At that point, a few more negatives will creep onto the horizon, and markets might prove vulnerable to selling pressure into the election.
At present, technical structure looks fantastic on S&P 500, and a pushback up above 5800 should prove forthcoming. An ideal price and time might materialize Friday 10/11 as a low to the minor consolidation from Thursday, leading stock indices higher into late next week. From a price standpoint, 5754 would represent an ideal area for SPX as support, though it is not seen as essential to reach before SPX turns back higher.
S&P 500 Index
2-Year Yields have bounced up to challenge serious resistance
2-Year yields have rallied back to strong resistance at former lows from earlier this year. This is thought to provide a ceiling to upward movement in 2-year yields, and I suspect that a stalling out and turn back lower is possible in the weeks to come.
Looking back at this morning’s CPI and Jobless claims data, today’s drop in the short-end of the curve provided some interesting but informative feedback on how the market views inflation these days.
The Bond market seemed to consider the Jobless Claim rise, (which very well might have been influenced by Strikes or hurricanes) to have been a bigger deal as a source of economic weakness, than the gains in CPI which beat across the board.
Overall, as seen below, this chart has begun to show some major evidence of having topped out following a multi-year topping process on monthly charts which started back in 2021. Momentum began to diverge negatively on the push to new highs, and this year’s break to multi-year lows turned intermediate-term momentum sharply bearish.
US Generic Govt 2 Yr
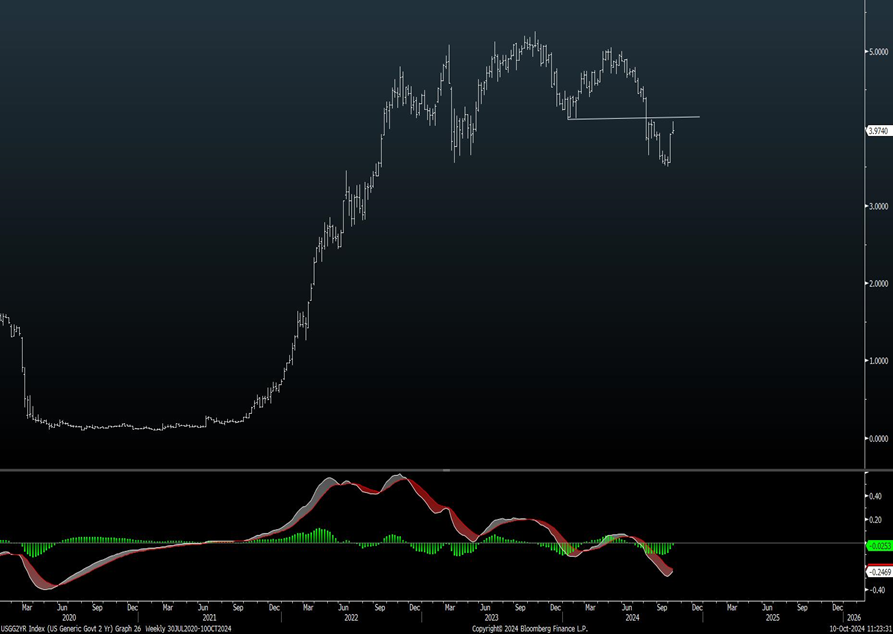
Now the snapback rally has occurred to test the area near the prior lows from December 2023. As the saying goes, former support becomes resistance normally using technical analysis and should make the level of 4.11-4.20% quite strong as resistance to a retest in 2-year yields.
Thereafter, yields should retreat to violate September lows.
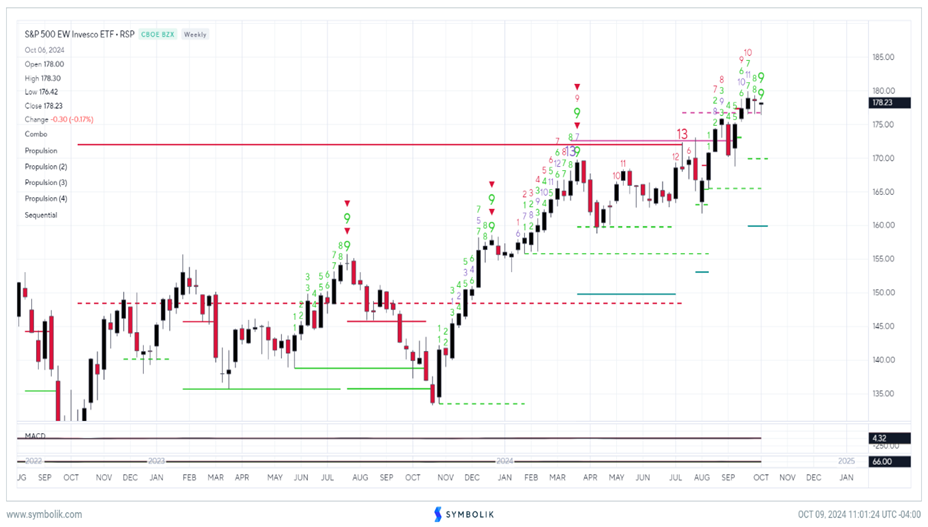
Equal-weighted S&P 500 ETF (RSP 0.39% ) by Invesco still looks early to peak out, but would show exhaustion within 2 weeks on gains
Equal-weighted S&P 500 (RSP) along with QQQ remain the two most important ETF’s which I scan for evidence of counter-trend exhaustion each week. Some have noted that weekly SPY and SPX charts now show weekly evidence of exhaustion using TD indicators.
While this is certainly true, these signals (TD Sequential, and TD Combo) have not been confirmed yet. Furthermore, the RSP 0.39% still looks early to stall out and might require additional strength over the next couple weeks before this registers any kind of exhaustion.
Overall, I view the case for avoiding stocks based on counter-trend signals to be weak at this time given no confluence among either RSP nor QQQ to join what SPX is showing. If/when this changes, then paying closer attention to DeMark’s indicators might prove wise.
S&P 500 EW Invesco ETF
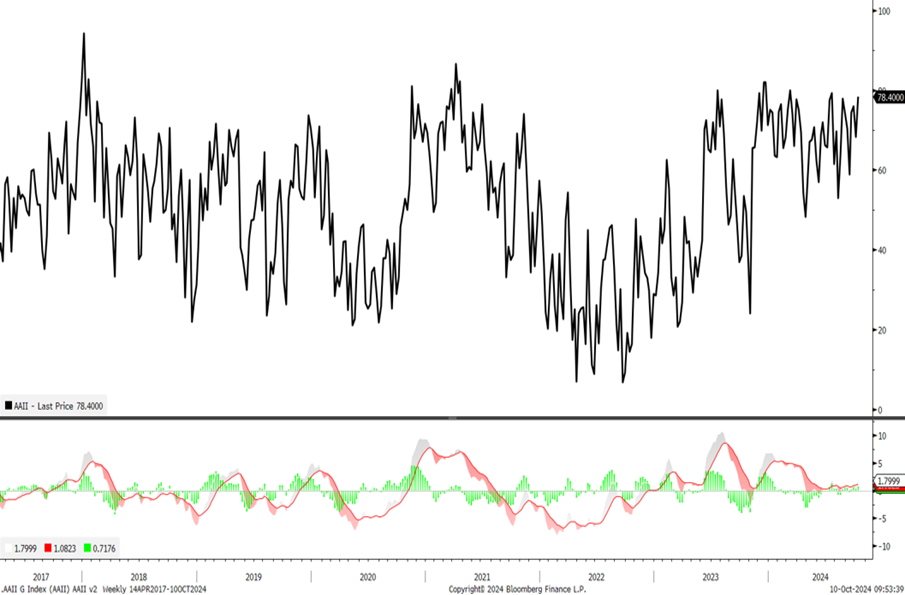
AAII Sentiment data shows “Percentage Bears” at new lows for 2024
While the 13-week Equity Put/call data doesn’t give much reason for any intermediate-term concerns based on current readings, the short-term data by sources like AAII and Fear and Greed are starting to grow to worrisome levels.
Fear and Greed poll from CNN now shows sentiment having reached “Fear”. Furthermore, AAII has now widened out to nearly 30 percentage points between bulls and bears.
While historical studies show that to be a starting point for when one would utilize this plurality to be concerned about the stock market from a contrarian viewpoint, I normally like to utilize the “AAII Percentage Bears” as being more useful in the near term.
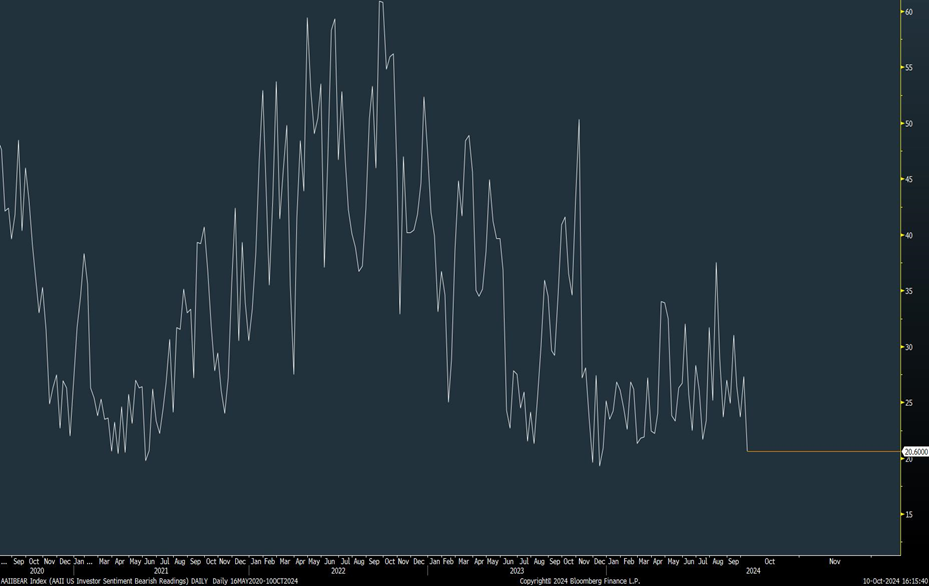
This week’s data (ending 10/9/24) showed AAII bears having plummeted to 20.60%, which represents the lowest readings of the year. This reading is also near the lows of its four-year range shown on this chart and does indicate that bears have started to give up on shorts following the steep runup from early August of this year (which is when this number last peaked in the mid-30s).
I anticipate that SPX moving above 5800 into late next week might allow the Percentage bears to move even lower, and would justify some caution about a possible trend reversal ahead of the US Election. However, I view this to be short-term in nature only, not intermediate-term. Thus, I still feel that any decline into November would make SPX an attractive risk/reward. For now, this is worth monitoring given the low percentage of Bears.
AAIIBEAR Index (AAII US Investor Sentiment Bearish Readings)
AAII Bull-bear spread has risen back to historical extremes
The spread between Bulls and Bears has also widened out to extremes as seen going back since 2017. In this case, the recent pattern of higher lows suggests that even higher levels might come about over the next 1-2 weeks, which might represent a time to pay attention to evidence of trend reversal.
For now, this data for this week is just being shown in a different manner than the prior chart.
My key takeaway is that short-term sentiment has gotten bullish and the lack of Bearish sentiment is troublesome. However, the preponderance of the evidence on a longer-term, more intermediate-term basis when examining both Institutional and individual sentiment measures is that a larger market peak remains quite premature. Bottom line, this is a short-term concern only, and any type of consolidation between late October into mid-November would likely serve to refresh the short-term sentiment data to more neutral readings.
AAII G Index