


Markets Rise in Year's First Week Despite Continuing Worries About Economy Array ( [cookie] => 30ed24-c31944-508848-e1d841-6024fd [current_usage] => 1 [max_usage] => 2 [current_usage_crypto] => 0 [max_usage_crypto] => 2 [lock] => [message] => [error] => [active_member] => 0 [subscriber] => 0 [role] => [visitor_id] => 0 [user_id] => 0 [reason] => Usage under limits [method] => ) 1 and can accesss 1

Our Views

As markets look ahead to 2023, putting the awful 2022 behind, the plurality of investors are neither bullish nor bearish, but rather are “biding their time” until market visibility improves. That visibility comes in many possible forms, including market capitulation, EPS inflection, Fed pivot, or inflation contracting markedly.
Basically, most investors believe the “crisis” environment of 2022 is spilling over into 2023, seeing a litany of headwinds from Fed hikes to a slowing economy to EPS contraction. So most investors and pundits, including many of the team at Fundstrat, believe stocks will go “nowhere” in 2023.
Question: How common is a “flat” year?
Our team calculated the data:
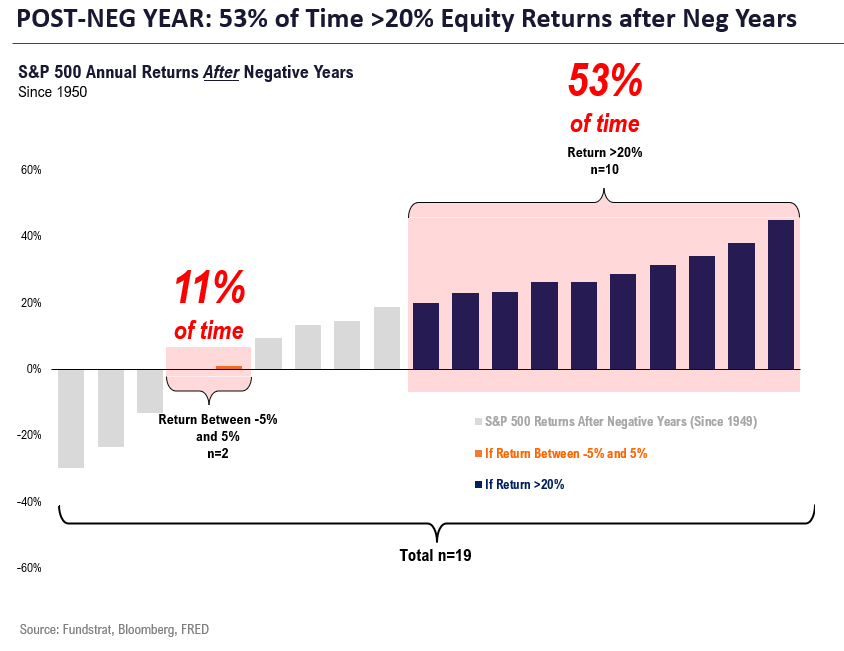
- Since 1950, there are 19 instances of a negative S&P 500 return year. In the following year,
- Stocks are “flat” (+/- 5%) only 11% of the time (n=2)
- Stocks are up >20% 53% of the time (n=10)
So after a down year, stocks are 5X more likely to rise 20% than be flat, and more than half of the instances are >20% gains.
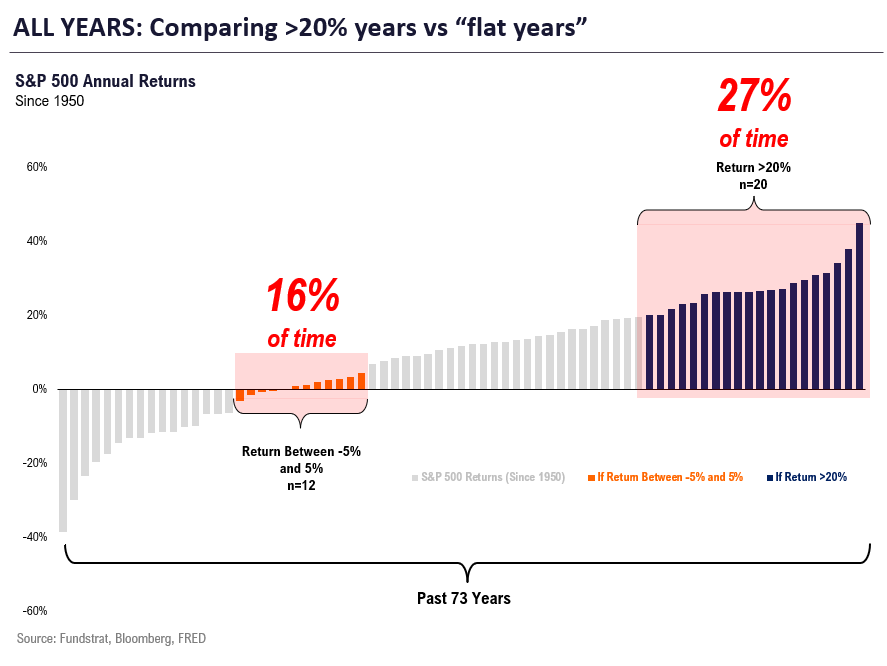
As shown below, these probabilities are far higher than compared to typical years. Since 1950, based upon all 73 years:
- Stocks are “flat” 16% of the time vs 11% post-negative years — BIG DIFFERENCE
- Stocks are up >20% 27% of the time vs 53% post-negative years — BIG DIFFERENCE
The odds of a >20% gain are double because of the decline in 2022.
3 POSSIBLE CATALYSTS: What are the possible catalysts/drivers for a “positive surprise” in 2023
Naturally, the question is, what are the possible factors that would enable equities to produce >20% gains in 2023, versus a “flat” year? We believe there are 3 possible catalysts:
- First, we think US inflation undershoots Fed and consensus, by a wide margin in 2023. In fact, we think the December CPI report could see core CPI as low as 0.1% MoM and bring annualized inflation to below 2%. By the way, inflation is also set to collapse in Euro-area as well falling to 2%-range in early 2023. So this is a global “disinflation” underway. This would be a “step” function change in the path of inflation versus what the Fed expects. And as a consequence, would arguably set the stage for the Fed to lower the path of forward rates and even change the view regarding “higher for longer.”
- Second, despite what look like “strong” jobs markets, leading indicators already suggest wage gains are set to slow. It is visible even in the Atlanta Fed wage tracker (3M annualized slowing) and in leading surveys, as highlighted by Goldman Sachs Economists.
- Third, equity (VIX) and bond volatility (MOVE) are likely to fall sharply in 2023, in response to a step function downwards in inflation and a consequently less hawkish Fed. Our analysis shows this drop in VIX is a huge influential factor in equity gains.
- If VIX even falls modestly in 2023, the median gain is 22% (see below) with a win-ratio of 83%. This is far higher than equity markets overall. Thus, if the trajectory drop in inflation, along with easing wage gains transpire, we expect equity and credit volatility to drop sharply. As such, this would further support >20% gains.

- SPX and QQQ snapped back Friday, but still appear vulnerable to breaking down into late January. Despite the resilience lately in groups like Financials, Industrials and Discretionary, the lagging in Technology is likely to continue to exert downward pressure in indices for the next few weeks.
- QQQ along with AAPL, AMZN, MSFT are getting closer to downside exhaustion. In plain English, markets are growing closer to bottoming, but they aren’t quite there yet.
- If historical cycles are any guide, this year is likely to be far more positive. Pre-election year performance on SPX going back since 1927 shows Q1 performance averaging +5.75%, the best of any of the 16 quarters of the four-year Presidential cycle. Pre-election gains appear quite robust and better in all months except May and September.

- The new year has started with S&P 500 trading within the 3800-3900 range as the economic data tug of war appears to be in full force.
- On one hand there has been and will likely be more dovish signals coming from inflation related data releases while more hawkish signs are probably coming from labor related metrics. Thus, there will be something for both Doves/Bulls and Hawks/Bears to point to for their outlooks, with the outcome still very much uncertain.
- My research is still suggesting that the Fed path as higher for longer, and I am still targeting 5.25-6.0% as the most likely terminal rate, with a high bar for flipping back to accommodation.
- Based on my work, the forward profit outlook still looks to be overly optimistic and valuation levels not yet at attractive levels.
- Bottomline is that I continue to reiterate that there is a high amount of risk for equity investors and that caution and vigilance remain key. I am still advising that investors sell rallies rather than buy dips.
Please note that Brian will be doing his 2023 Portfolio Strategy Outlook on Thursday, January 12th, when he will also be including his monthly sector allocation update.

- Our market valuation methodology shows equities are overvalued relative to investment-grade fixed income, as they have been since March 2022. However, this is improving a little bit.
- We still expect muted returns and elevated volatility for the equity market in the coming months.
- Idiosyncratic risk has been rising since its trough in August, which means that the environment is improving for strategies that emphasize stock-picking.
- Our Reddit sentiment index, which acts as a contra-indicator for the market, is currently at a high level. High levels for this index tend to forecast a downturn in the market in the near term.

- Despite favorable price action for several altcoins to start the year, volumes, volatility, and fundamental on-chain activity remain subdued.
- Ethereum core developers held their first call of the year and decided to prioritize staking withdrawals in Q1. This de-risks Ethereum staking and should be constructive for liquid staking tokens.
- A liquidation-fueled bounce from Solana this week garnered attention. Despite having a steep hill to climb in regaining investor confidence, spot volumes over the past couple of weeks suggest that SOL may have found a long-term bottom.
- On-chain UTXO data indicates an impressive buy wall has formed around current BTC price levels.

- This week has demonstrated the challenge House Republicans will face in trying to govern, no matter who eventually becomes Speaker.
- The most concerning issue for the markets is the near-certain need to raise the debt ceiling for the US Treasury later this year. One of the reported demands of Republicans refusing to support Kevin McCarthy is that he commit to opposing any debt-ceiling increases.
- Past Republican Congresses have found it difficult to pass legislation to fund the federal government. This week raises some red flags about the ability of the House to do this in October.
Wall Street Debrief — Weekly Roundup
Key Takeaways
- After four negative weeks to end 2022, the S&P 500 finished the first week of 2023 up 1.5% at 3,895.08. The Nasdaq rose 1% to 10,569.29.
- Stocks have been range bound for the past two months as investors question whether the U.S. can avoid a recession in 2023.
- We review what our Tom Lee and Adam Gould have observed as 2023 gets underway.
Good evening:
Happy New Year! We hope your 2023 is off to a healthy and productive start.
Adam Gould, Head of Quantitative Research, opened our Thursday meeting in New York the same week he published his stock-rating model’s 2022 performance. It was an excellent year for quant funds across the Street, and Gould’s model continued its outperformance: Last year, his basket of favored stocks beat the S&P 500 benchmark by 9.3%.
Overall, Gould continues to view stocks as expensive relative to both investment-grade and high-yield corporate debt, though he noted there are small improvements on those fronts.
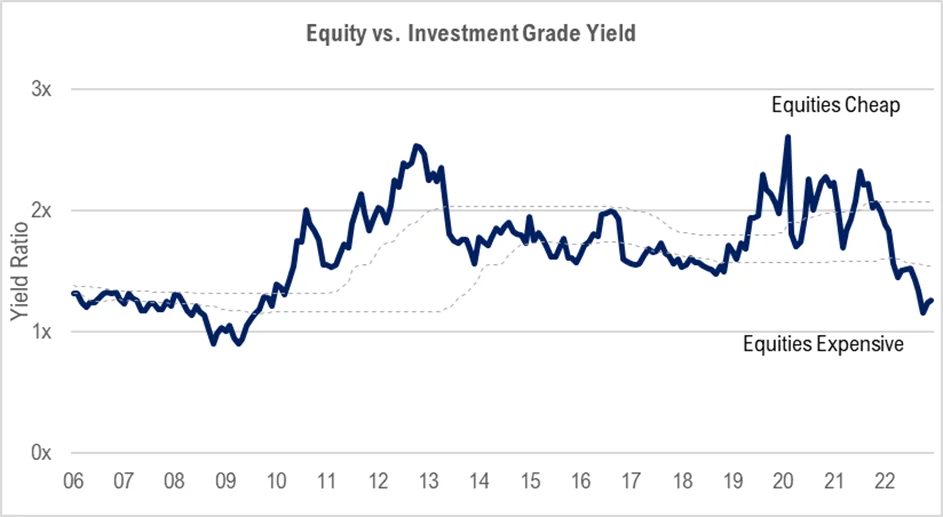
The comparison charted here should not be used predictively in an attempt to time entry and exit points. But it might be useful for investors trying to adjust their stock and bond allocations or those trying to adjust weights between high-beta and low-beta sectors.
Adam led a discussion about the current increase in idiosyncratic risk, which tends to favor stock-picking strategies. Historically, such increases have been accompanied by a market recovery, so the current situation is unusual. Adam’s work suggests stocks could retest the lows of October 2022 (3,5077.03) in the next few months, with idiosyncratic risk to also fall before shooting back up.
“The market has looked overvalued since last March,” Gould said in our weekly meeting. “But it has become a little less overvalued.
“If we retest the lows in February or March, that would be the time to get into your high risk, your value, your more cyclical names,” Gould added. “That would be the time to take on more risk. But I think we’re going to retest the October lows, and hopefully, from there we can rally strong.”
Meanwhile, recessionary fears and the state of US employment dominated investors’ attention this week. Several data releases suggested the labor market remains strong, but hiring and wage growth are slowing. The November JOLTS, the December ADP private payroll, and the Department of Labor’s nonfarm payroll reports each showed stronger-than-expected job growth. Initial and continuing unemployment claims fell more than expected.
However, although wages continued to grow, the rate of growth is slowing. This week’s DOL statistics showed wages grew 0.3% in December, below November’s 0.4%. As Tom Lee has pointed out before, this is consistent with the trend shown by the Atlanta Fed wage tracker (3M annualized slowing).
The December S&P U.S. manufacturing PMI on Tuesday came in at 46.2, down from 47.7 in November. This was the lowest number since May 2020, as output and new orders both contracted. The ISM Services index fell to 49.6% for the month, below estimates of 55.1%. Both reports suggest an economic contraction.
As Head of Technical Strategy Mark Newton predicted, stocks have stayed within the levels made in December, with support and resistance levels for the S&P 500 at 3800 and 3900, respectively.
Americans have been fixated on this week’s dramatic and precedent-setting contest for Speaker of the House. Our Washington Policy Strategist Tom Block described it as a “mess” and “very distressing,” particularly as it relates to legislation to raise the debt ceiling which will need to be passed later this year. “It’s the responsibility of the majority party to pass this bill. This is probably the single most difficult vote for a Republican to take. I just don’t know how they’re going to do it.” That in turn could lead to some “very bad market headlines,” he warned, because failure to raise the debt ceiling could have huge implications throughout the economy, affecting the ability of the US government to raise money, pay off its debt, and pay bills. The huge negative consequences from that would ripple throughout the US and the global economy at all levels.
Elsewhere
Inflation seemed to cool in Europe in December, based on statistics released by German and French officials. Germany reported 9.6% YoY inflation in December compared to 11.3% in November. Analysts had expected 10.7%. France said annualized inflation fell from 7.1% in November to 6.7% in December, contrary to expectations of 7.3%.
That doesn’t diminish the extent of European inflation last year: Germany’s 2022 7.9% inflation was the highest in post-war German history, and Bundesbank President Joachim Nagel warned that 2023 inflation in Germany is still expected to be more than triple the ECB’s 2% target.
And finally …
China is scheduled to reopen its doors to foreign travelers this coming Sunday (January 8), after closing its borders 1,016 days ago at the start of the COVID pandemic.
By the way, we’d like your feedback. How are you enjoying this weekly roundup? We read everything our members send and make every effort to write back. Please email thoughts and suggestions to inquiry@fsinsight.com.
Important Events
Est.: 0.29% Prev.: 0.2%
Consumer Price Index excluding Food and Energy on a Month over Month basis.
Est.: 215K Prev.: 204K
Initial claims for unemployment insurance benefits for the week ending January 7, 2023.
Est.: 60.5 Prev.: 59.7
A monthly survey of consumer confidence levels as conducted by the University of Michigan
FS Insight Media

Stock List Performance
| Strategy | YTD | YTD vs S&P 500 | Inception vs S&P 500 | |
|
Sector Allocation
|
+11.75%
|
+15.46%
|
+33.22%
|
View
|
Small Cap Stock List Performance
| Strategy | YTD | YTD vs Russell 2500 | Inception vs Russell 2500 | |
|
SMID Granny Shots
|
-1.55%
|
+5.14%
|
+23.53%
|
View
|
Articles Read 1/2
🎁 Unlock 1 extra article by joining our Community!
Stay up to date with the latest articles. You’ll even get special recommendations weekly.
Already have an account? Sign In 30ed24-c31944-508848-e1d841-6024fd
Already have an account? Sign In 30ed24-c31944-508848-e1d841-6024fd


Articles Read 1/2
🎁 Unlock 1 extra article by joining our Community!
Stay up to date with the latest articles. You’ll even get special recommendations weekly.
Already have an account? Sign In 96d619-6070d0-b3a357-976a8f-88f14d
Already have an account? Sign In 96d619-6070d0-b3a357-976a8f-88f14d