


The market consensus is sometimes correct but sometimes wrong. I like to push against the consensus. Not only is it intellectually stimulating, but when the consensus is wrong investors can do well by using a contrarian approach.
Currently, for example, the central thesis of market skeptics is that numerous political risks—such as the ongoing U.S.-China trade spat, a looming hard Brexit later this year, and President Donald Trump’s regular shoot from the hip tweets—will undermine corporate and financial market’s confidence sufficiently enough to lead to a selfsustaining economic contraction. That’s otherwise more commonly known as a recession. This is a consensus view and as such, investors are defensively positioned.
Yet there’s some cognitive dissonance here: Why then are cyclical stocks—such as consumer discretionary and industrials—doing well this year and also leading in the rally from the June 3? (See nearby chart.) Secondly, why is the real estate sector second best?
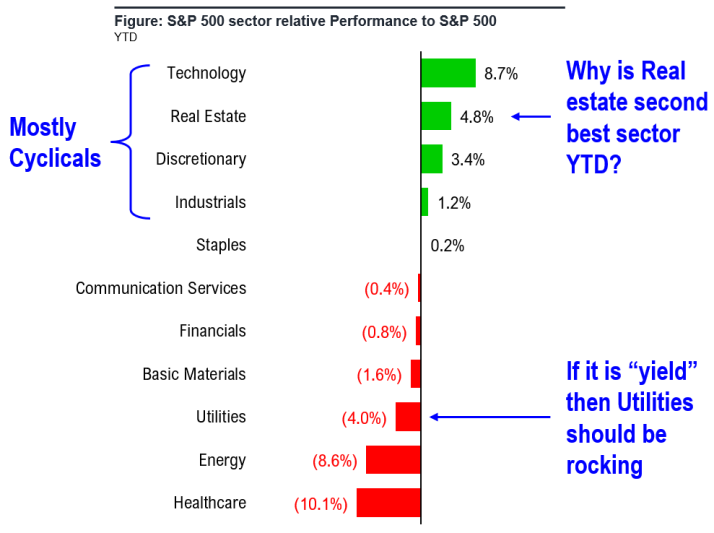
I believe that cyclical stocks are responding to, among other factors, the steepening long term yield curve and to rising inflation expectations.
Cyclicals are leading year to date, and do so despite the 7% correction in May. The interesting sector anomaly is real estate, which reflects a rising inflation risk.
Historically, the only time the market generally sees strong cyclical relative performance is when the long-term yield curve is steepening. This is the case currently, and I think owning cyclical stocks is the appropriate investment stance as well. This is analogous to the 2009 2010 period, which is fitting because I believe a new bull market started in December 2018, when stocks fell 20%–a bear market—from the September’s all-time high, on an intraday basis.
The inflation risk is perceived to be rising because the Fed’s forward 5-year breakeven inflation rate less the consumer price index—a measure of that risk—has risen this year. (The breakeven rate is derived from the nominal 5-year Treasury yield minus the 5-year TIPS yield.) The gap between expected and actual inflation has widened, suggesting financial markets are pricing in a rise in inflation risk.
Investors shouldn’t misread the drop this year in the US Treasury 10-year yield, which as I have argued several times earlier, is more due to zero interest rates in much of the rest of the world’s major bond markets than to a potential economic slowdown.
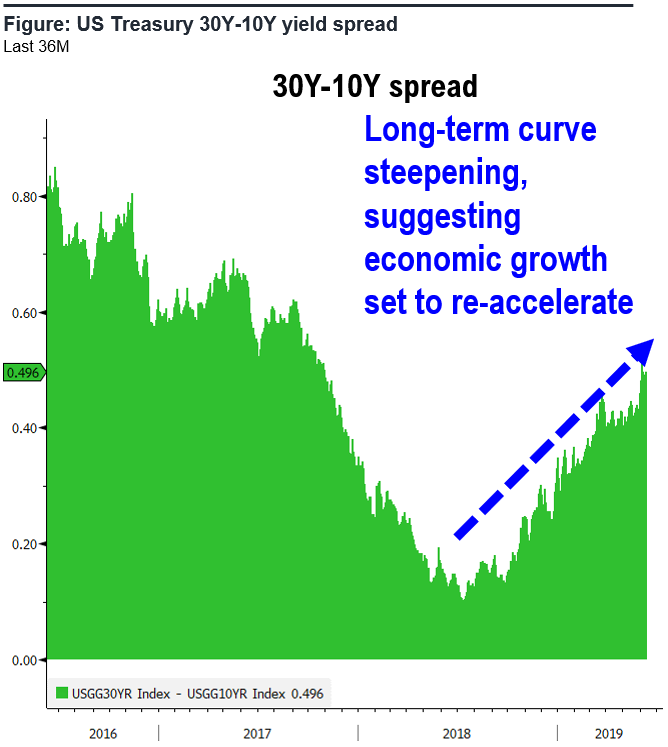
Meanwhile, even as bears fret about the inversion of the 3 months-10-year Treasury yield spread and as the front end of curve is pricing in a Federal Reserve easing of the Fed funds rate quite soon, the more important long-term yield curve has moved counter to that and is steepening.
Indeed, the best indicator of business cycle health is the long term yield curve, notably the 30 year-10 year spread. And its steepening suggests long-term growth outlook is accelerating and there is stronger growth ahead. The spread, now about 40 basis points, was just 12 bps one year ago. That’s bullish for cyclical outperformance, and similar to 2009-2010.
The inversion in the front end reflects the need for the Fed to cut rates to correct for having tightened financial conditions in 2018, which aren’t hurting the long-term growth outlook.
Additionally, as all the world knows by now, the Fed has made a very quick about face in the last month and is now expected to cut interest rates in 2019 instead of hike. Fed futures are pricing a rate cut potentially as early as next month. A rate reduction often leads an expansion in the market’s price/earnings (P/E) ratio.
When the economy is not in a recession, as now, such Fed cuts lead to an average P/E expansion of 1.7 times over the next six months. This implies the forward P/E (2020) should rise to about 17 times, which would put the S&P 500 index comfortably at 3,100 or higher by year. My yearend target of 3125 is based on 17 times my S&P 500 Index EPS estimate of $184 in 2020.
What could go wrong? With purchasing managers index surveys weakening, the current stall in economic momentum could lead to an economic downturn. However, this isn’t my base case and the US economy remains fairly resilient.
Bottom line: I’m constructive on equities and see tailwinds for cyclicals. The following are the ticker symbols for 21 highly-ranked cyclical stocks: TRP, GM, BKNG, LMT, MMM, NSC, CSCO, ADP, MSFT, LYB, APD, NUE, CVX, XOM, PSX, BLK, NTRS, COF, FB, GOOGL and DIS.


