Near-term trends are bullish for SPX, and I anticipate a sharp rally to finish the month of October after an interesting period of sector rotation in recent weeks. Monday’s success in climbing over last week’s highs for SPX and QQQ should enable these to both push back to new all-time high territory. Despite some minor warnings regarding breadth, high yield spread widening, and/or lack of broad-based participation, it looks like breakouts in AAPL GOOGL should help Technology show sufficient leadership to carry US stock indices over the next few weeks. At present, many of the momentum trades of recent months have begun to slowly unwind in recent weeks. While this doesn’t portend a rally continuing in any of these, the structure of this “risk-on” trade has begun to noticeably change in the short run. I expect this might bring about volatility next month, but for now, trends remain intact.
Overall, meaningful support lies at 6550, while any move above 6752 should carry ^SPX up into the highs of its trend channel by early November. This lies between 6850-6950 and should be a strong resistance for November. Thereafter, it might be right to expect some consolidation, but I continue to believe this will come from higher levels.
Technology, Healthcare, Consumer Discretionary, and Utilities could be the sectors that lead in the weeks ahead. While the lack of relative strength from Financials is a temporary concern, I expect this to return in November.
For now, until larger trends begin to show weakness, it’s right to simply lean on existing trends in thinking that Technology likely can carry U.S. stock indices higher, regardless of whether the broad-based indices like the Russell 3000 or the Equal-weighted ^SPX make a similar move. The lack of unison between RSP -0.31% and ^SPX does not portend immediate weakness.
Therefore, it’s necessary to simply pay very close attention to Technology and watch for evidence of this triangle pattern being broken for ^SPX. Above 6752 in ^SPX likely brings about a push higher by 100-150 points into early November. Upon reaching the highs of this lengthy trend channel, it would be right to expect a stalling out and possible consolidation next month.
The key takeaway for intermediate-term investors revolves around the lack of trend damage for ^SPX and QQQ 0.01% in an environment where investors have grown more bearish in recent weeks. The pullback in many parabolic moves of the last couple of months seems to have shaken the spirit of many trend-following investors, despite a lack of any trend damage.
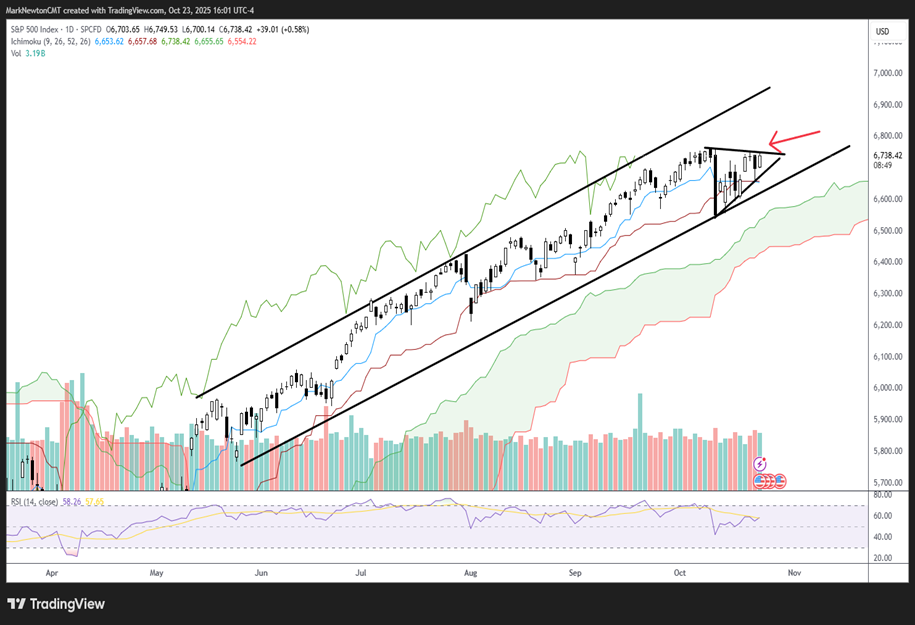
As seen below, ^SPX is now nearing the highs of its minor triangle consolidation, which I expect to give way to yet another upside breakout. This might carry ^SPX up to the highs of this range.
S&P 500 Index
NVIDIA looks close to turning back higher, and I suspect this might test all-time highs into November
NVDA remains the most important stock within ^SPX and QQQ 0.01% in percentage terms, and looks to be showing evidence of trying to bottom out following its recent consolidation.
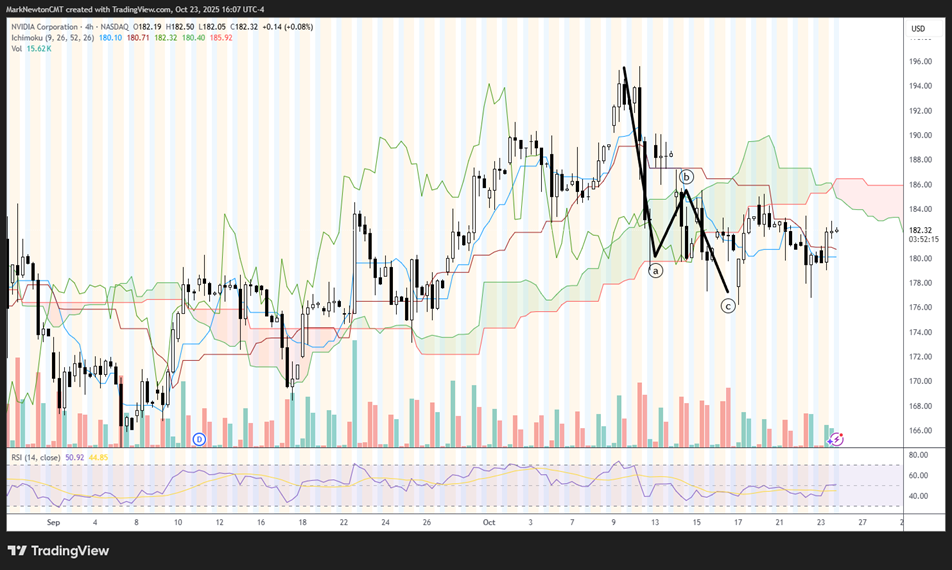
The pullback into last Friday looks complete, and the stock looks to be trying to carve out a bottom and turn back higher.
A key area for this stock lies at $185.20. The ability of NVDA 1.70% to push above this level argues for a likely rally back to challenge and possibly exceed the peaks from early October.
This would be a very bullish move for NVDA 1.70% and given its percentages within ^SPX and QQQ 0.01% , the stock market as well.
My friend and colleague Bill Sarubbi reminded me today that the monthly cycle for NVDA points up during November, and NVDA 1.70% has risen 76.9% of the time in November for an average gain of +10.6% over the last 26 years.
While I do suspect that NVDA 1.70% might face some consolidation when/if it does hit new highs starting in mid-November, I’m expecting that the next few weeks can be bullish.
NVIDIA Corporation
NVDA short-term cycles seem to point lower into early December; However, initially, NVDA might rally to test/exceed all-time highs
I re-examined the short-term cycles on NVDA 1.70% going back since 2022 to gain some insight as to the shorter-term cycles that might be at work in this stock.
Unfortunately, the shorter-term cycles are negative into early December, which was different than what I might have expected, but does gel with what the ^SPX cycle composite also shows.
This doesn’t take into account the larger cycles for NVDA 1.70% , which might have a more bullish influence on NVDA 1.70% until January of next year.
For now, I interpret this to mean that the next 2-3 weeks likely might start off bullish, before NVDA 1.70% pulls back sometime in November from higher levels.
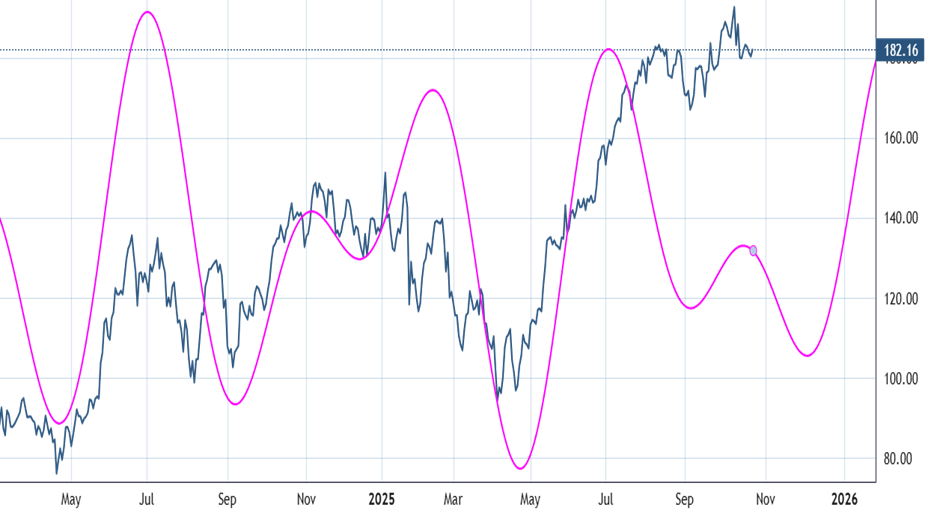
Thereafter, it looks right to favor a strong rebound from early December into January of next year. The pink line below is a combination of four different short-term cycles for NVDA 1.70% . It represents amplitude, not magnitude. Thus, NVDA 1.70% does not necessarily require a steep correction like what this cycle composite below might imply.
However, specifically based on shorter-term cycles, a period of weakness very well could happen in late November before NVDA 1.70% turns back up. As always, it’s important to include the intermediate-term cycles, and the composite below was presented just for a shorter-term view.
NVDA Short-Term Cycle
How important are valuations towards suggesting a stock market pullback?
There has been rampant discussion in recent weeks about whether stock indices might be in a bubble. (In fact, I’ve heard this term more in the last month than I have all year long.)
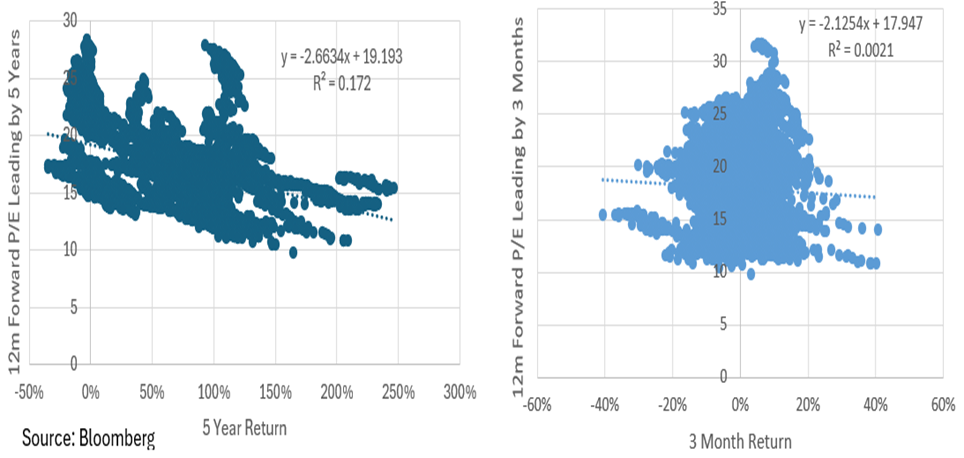
Bloomberg posted an interesting chart, which I felt I should share, done by Skylar Montgomery Koning, which discusses the fallacy of taking near-term “expensive” equity valuations towards suggesting possible mean reversion in equity markets.
As this study shows below, since 1990, in the intermediate term, when the S&P 500’s forward P/E ratio is above 25, it can have some predictive power.
However, on a three-month basis, the explanatory power is nearly non-existent. Based on Koning’s study, the average return over the following month when the S&P 500’s forward P/E is above 25 is +1.1%.
As a market technician, I’ve always been a bigger fan of watching larger trends for evidence of when a selloff might be getting underway. In 2025’s SPX for late October, that level is 6550. Until/unless this level is breached, it’s right to stay bullish. Furthermore, trying to use valuations to time when investors might be more defensive doesn’t seem to “hold much water”.