Great rally this week for US Equities, but intermediate-term progress will take time

Key Takeaways
  • SPX and QQQ have both recouped prior March lows which helps to add rally conviction.
  • VIX looks to possibly have support in the low 20’s next week.
  • University of Michigan shows 12% of all respondents expect a 0% probability of an increase in stock prices over the next 12-months.
Great rally this week for US Equities, but intermediate-term progress will take time

Gains in US Equities this week represent the start of the much-needed first push off the lows, which helps to make the strong technical case that our early April lows likely constitute a meaningful bottom for US Equities.  The combination of phenomenal market breadth, coupled with strong leadership from Technology and stabilization in the bond market during a time of mass pessimism, is promising that US Equities should avoid a bear market and the economy could avoid a 2025 recession. Intermediate-term progress, however, will certainly take some time, given ongoing negative weekly momentum at a time when just 33% of all SPX stocks are above their 200-day moving average. Overall, short-term resistance could begin to materialize next week, given that NASDAQ has now achieved four consecutive 1% days of gains. The area near 5600 in SPX could prove important into next week, and allow for some consolidation. However, it’s unlikely in my view that corrections prove too severe nor long-lasting before starting a larger rally back to new highs. Thus, as discussed, a “two-steps forward, one-Step back” looks to still be in effect, with the two steps forward part off the 4/7 lows possibly complete into next week.       

Four solid days of gains have helped SPX to recoup the prior lows that were broken in mid-March on both SPX and QQQ.  While DJIA and RSP have not yet accomplished this feat, this is seen as very bullish structurally, suggesting that our April 7th lows likely represent the lows for Spring 2025.

Key positives have to do with the following:

-Strong market breadth with Advance/Decline (A/D) and A/D volume both showing very strong bullish percentages on multiple occasions over the last two weeks.

-Breakout in Technology following this sector, having held at intermediate-term support in its relative relationship to SPX.

-VIX and High Yield spreads have both collapsed in the last two weeks.

-Bond market having stabilized following the rapid ascent in rates during the period directly leading into 4/7 SPX lows.

-Cycle composites turning higher in April which pinpointed a low in the first half of April and push higher into May.

-Pessimism remains extraordinarily elevated.

-DeMark signals were triggered (and subsequently confirmed) on 60, 120, 180, 240-minute charts as well as daily charts of SPY within 1 day of the 4/7 low in SPY.

I’ll list some of the negatives and what still needs to be accomplished for intermediate-term conviction early next week.  (For now, let’s end the week on a good note.)

S&P 500 Index

Great rally this week for US Equities, but intermediate-term progress will take time
Source: TradingView

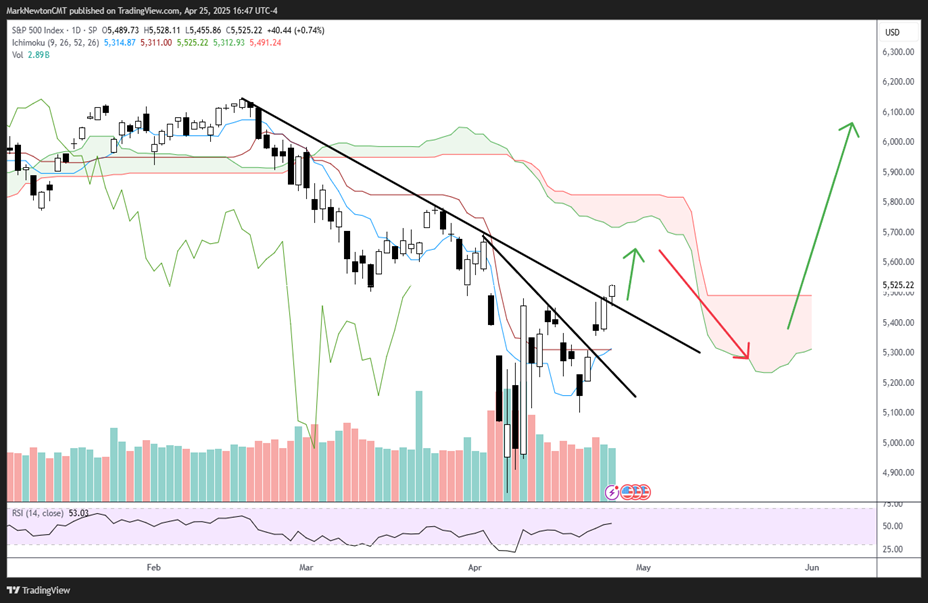
As seen above, the trajectory for SPX very well might play out according to the arrows above.  This would imply a possible near-term peak developing next week. This might be followed by a 38-50% pullback to the progress having made since 4/21 swing lows.

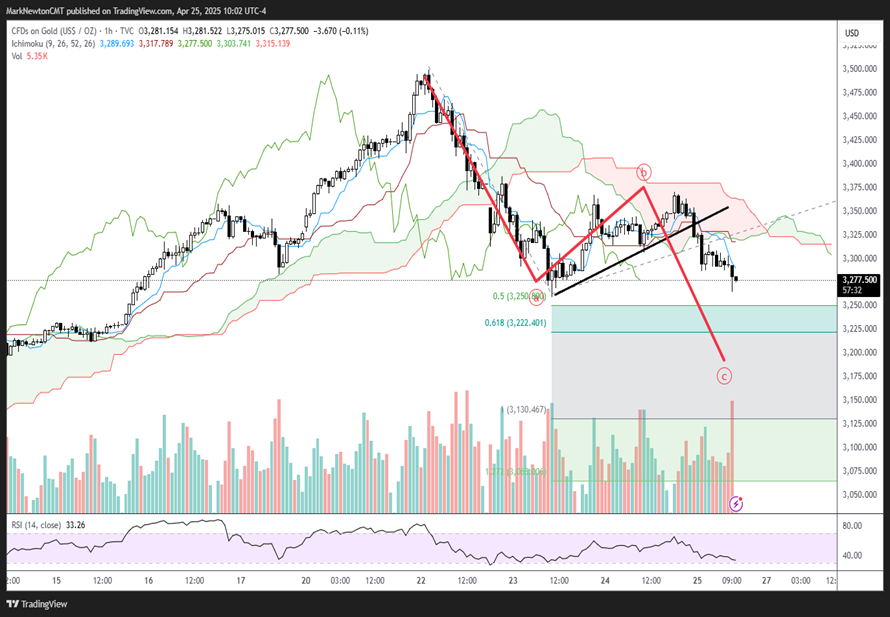
Precious Metals might show minor weakness into May before bottoming and pushing back to new highs

Precious metals along with precious metals stocks have begun a mild correction at a time when the Dollar has stabilized ever so slightly, and some reversal in many of the Haven trades have taken place.  Note that USDJPY USDCHF have all started to turn higher.  I suspect this is a temporary development for Gold and its pattern suggests this should be a simple “ABC” Elliott-wave style corrective decline before price pushes back to highs. 

Overall, I suspect that a pullback into May has begun which will take Gold down to between 3130-3164, and might also result in temporary weakness for Gold stocks and Silver. Upon completion, there should be a push back to new highs. Thus this appears like temporary weakness only. The two-day correction from 4/22-4/23 looked important, and likely will be followed by a similar move lower in price and time before this completes. 

A 100% alternate projection arrives at 3130, and this also is near a 61.8% Fibonacci retracement of the entire April rally, making this zone a good target for gold weakness to find support.

CFDs on Gold (USS / OZ)

Great rally this week for US Equities, but intermediate-term progress will take time
Source: TradingView

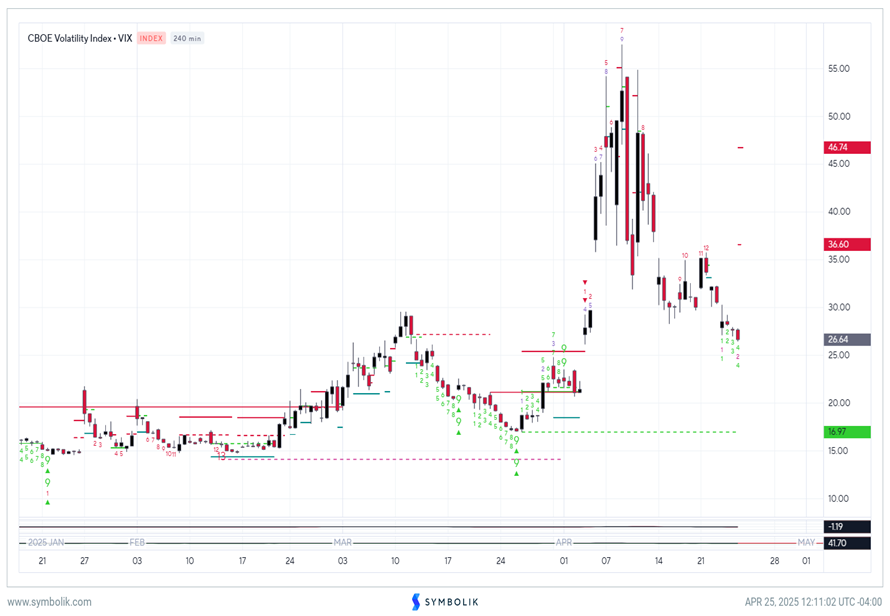
VIX looks to have support in the low 20s next week

CBOE Volatility Index (VIX) in the last 2 weeks has nearly erased its entire backwardation spread, which got to over 20 points between Spot VIX and 3-month Futures in early April. Note, VIX going to yearly highs & then erasing more than 50% of its value has brought “implied vol” down to levels that are normally appealing given no real evidence of meaningful tariff negotiation having gotten underway yet between US and China, or Japan, or EU, and VIX shows technical support in the low 20’s.  

As shown below the 4-hour chart has broken down again under lows of the last few days, and seems likely that VIX might briefly undercut 24 into early next week before trying to stabilize and bounce.  At present, DeMark indicators on 60-min, 180-min, 240-min, and also Daily charts remain premature to bottom. 

However, some indication of intra-day VIX lining up with exhaustion will be in place likely by early next week for those looking.  Thus, in terms of Equity markets, one could expect another couple days of gains before some stalling out potentially and consolidating in a manner that might lead VIX higher. 

For now, I suspect VIX might still have another 7-10% down. 

CBOE Volatility Index – VIX

Great rally this week for US Equities, but intermediate-term progress will take time
Source: Symbolik

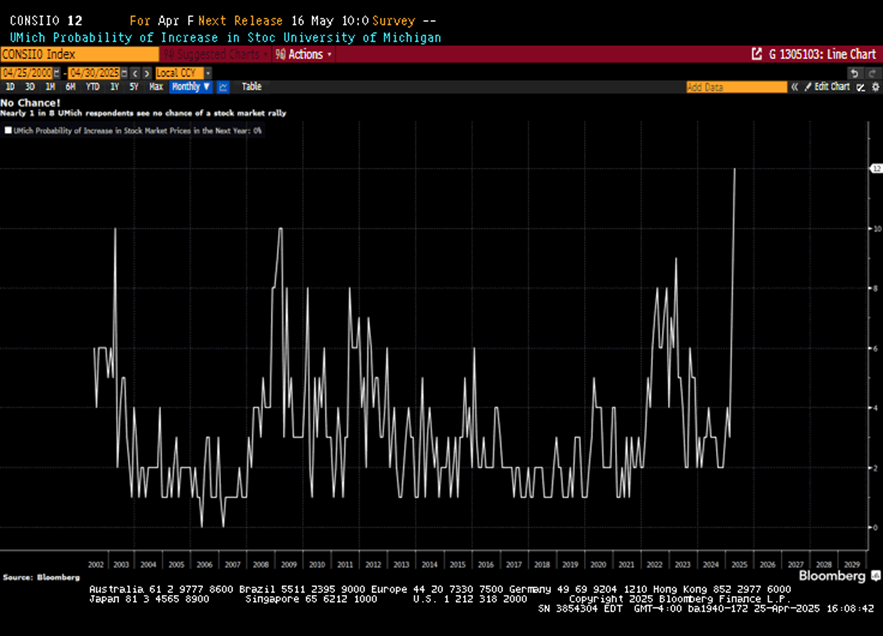
University of Michigan Sentiment data has never been this negative

Recent survey results seem to show extraordinarily negative sentiment, which dovetails with the record number of bearish weeks above 50% in AAII data.

As shown below, 12% of all respondents surveyed believe there is zero chance of a stock market rally in the next year.

Bloomberg data shows this is far and away the most negative that people have been in the 22-year history of this indicator.

CONSIIO Index

Great rally this week for US Equities, but intermediate-term progress will take time
Source: Bloomberg
Disclosures (show)

This research is for the clients of FS Insight only. FSI Subscription entitles the subscriber to 1 user, research cannot be shared or redistributed. For additional information, please contact your sales representative or FS Insight at fsinsight.com.

Analyst Certification (Reg AC)
Mark L. Newton, CMT, the research analyst denoted by an “AC” on the cover of this report, hereby certifies that all of the views expressed in this report accurately reflect his personal views, which have not been influenced by considerations of the firm’s business or client relationships. Neither I, nor a member of my household is an officer, director, or advisory board member of the issuer(s) or has another significant affiliation with the issuer(s) that is/are the subject of this research report. There is a possibility that we will from time to time have long or short positions in, and buy or sell, the securities or derivatives, if any, referred to in this research.
Conflicts of Interest

This research contains the views, opinions and recommendations of FS Insight. At the time of publication of this report, FS Insight does not know of, or have reason to know of any material conflicts of interest.

General Disclosures

FS Insight is an independent research company and is not a registered investment advisor and is not acting as a broker dealer under any federal or state securities laws.

FS Insight is a member of IRC Securities’ Research Prime Services Platform. IRC Securities is a FINRA registered broker-dealer that is focused on supporting the independent research industry. Certain personnel of FS Insight (i.e. Research Analysts) are registered representatives of IRC Securities, a FINRA member firm registered as a broker-dealer with the Securities and Exchange Commission and certain state securities regulators. As registered representatives and independent contractors of IRC Securities, such personnel may receive commissions paid to or shared with IRC Securities for transactions placed by FS Insight clients directly with IRC Securities or with securities firms that may share commissions with IRC Securities in accordance with applicable SEC and FINRA requirements. IRC Securities does not distribute the research of FS Insight, which is available to select institutional clients that have engaged FS Insight.

As registered representatives of IRC Securities our analysts must follow IRC Securities’ Written Supervisory Procedures. Notable compliance policies include (1) prohibition of insider trading or the facilitation thereof, (2) maintaining client confidentiality, (3) archival of electronic communications, and (4) appropriate use of electronic communications, amongst other compliance related policies.

FS Insight does not have the same conflicts that traditional sell-side research organizations have because FS Insight (1) does not conduct any investment banking activities, and (2) does not manage any investment funds.

This communication is issued by FS Insight and/or affiliates of FS Insight. This is not a personal recommendation, nor an offer to buy or sell nor a solicitation to buy or sell any securities, investment products or other financial instruments or services. This material is distributed for general informational and educational purposes only and is not intended to constitute legal, tax, accounting or investment advice.
The statements in this document shall not be considered as an objective or independent explanation of the matters. Please note that this document (a) has not been prepared in accordance with legal requirements designed to promote the independence of investment research, and (b) is not subject to any prohibition on dealing ahead of the dissemination or publication of investment research.
Intended for recipient only and not for further distribution without the consent of FS Insight.

This research is for the clients of FS Insight only. Additional information is available upon request. Information has been obtained from sources believed to be reliable, but FS Insight does not warrant its completeness or accuracy except with respect to any disclosures relative to FS Insight and the analyst’s involvement (if any) with any of the subject companies of the research. All pricing is as of the market close for the securities discussed, unless otherwise stated. Opinions and estimates constitute our judgment as of the date of this material and are subject to change without notice. Past performance is not indicative of future results. This material is not intended as an offer or solicitation for the purchase or sale of any financial instrument. The opinions and recommendations herein do not take into account individual client circumstances, risk tolerance, objectives, or needs and are not intended as recommendations of particular securities, financial instruments or strategies. The recipient of this report must make its own independent decision regarding any securities or financial instruments mentioned herein. Except in circumstances where FS Insight expressly agrees otherwise in writing, FS Insight is not acting as a municipal advisor and the opinions or views contained herein are not intended to be, and do not constitute, advice, including within the meaning of Section 15B of the Securities Exchange Act of 1934. All research reports are disseminated and available to all clients simultaneously through electronic publication to our internal client website, fsinsight.com. Not all research content is redistributed to our clients or made available to third-party aggregators or the media. Please contact your sales representative if you would like to receive any of our research publications.

Copyright © 2025 FS Insight LLC. All rights reserved. No part of this material may be reprinted, sold or redistributed without the prior written consent of FS Insight LLC.