
Recent US Equity selling pressure is ongoing, and trends have not turned back higher as quickly as factors like sentiment and wave structure have suggested could be the case. While it’s expected that market lows should be right around the corner, it’s important to be patient until this does happen in a manner that helps to add conviction. Short-term momentum has gotten oversold and many key large-cap Tech stocks look to be at/near support. Furthermore, Treasury yields and the US Dollar have been breaking down sharply, which is viewed as a constructive development for US risk assets. Moreover, sentiment has continued to grow more and more negative, given the constant rhetoric regarding tariffs and/or a growth slowdown, yet the Magnificent 7 looks to be trading near support. Finally, market cycles seem to make the case for a bottom in SPX by next Friday, 3/14/25, at the latest. However, some evidence of breaking the current downtrend is necessary before having much confidence.
Break to new lows likely postpones low for a bit longer, and seeing some strength is necessary at this point
Bottom line, it remains difficult to try to make a stand at this point with no meaningful evidence of any trend improvement. While I suspect this is near, and could materialize by next Friday at the latest (which would line up with cyclical lows) most rebound attempts have proven short-lived and haven’t been too satisfying for the “Bulls” given no trend improvement.
Following two straight days of stabilization, Thursday’s breakdown is resulting in some minor positive divergence in momentum and breadth, which could be important if economic data turns out to be better than expected on Friday.
In recent months, poor data led rates down which helped equities rally as “Bad news is good News” and more Rate cuts were factored into the market. At this point, the Fed’s worry seems to have shifted from inflation to a growth scare and rates have been falling for reasons not related to inflation. However, stocks have fallen anyway, which goes against some of the positive correlation trends markets have shown for the last couple years.
Thus, my view is that a better-than-expected Jobs number on Friday morning that causes rates to turn back higher might not be as negative for the stock market as has been the case historically.
Overall, despite the increasing number of positive technical reasons for “why” the Equity market should bounce, it’s important to let this happen and not be set on continuing to buy dips in this downtrend without proof that SPX has begun to turn higher.
I don’t like the risk/reward of being “out” of the market at this point, but I also feel like the mid-5600s area is a distinct possibility into next Monday-Friday before SPX can bottom. My QQQ target is 482-5, and I expect any pullback here to prove an excellent risk-reward opportunity.
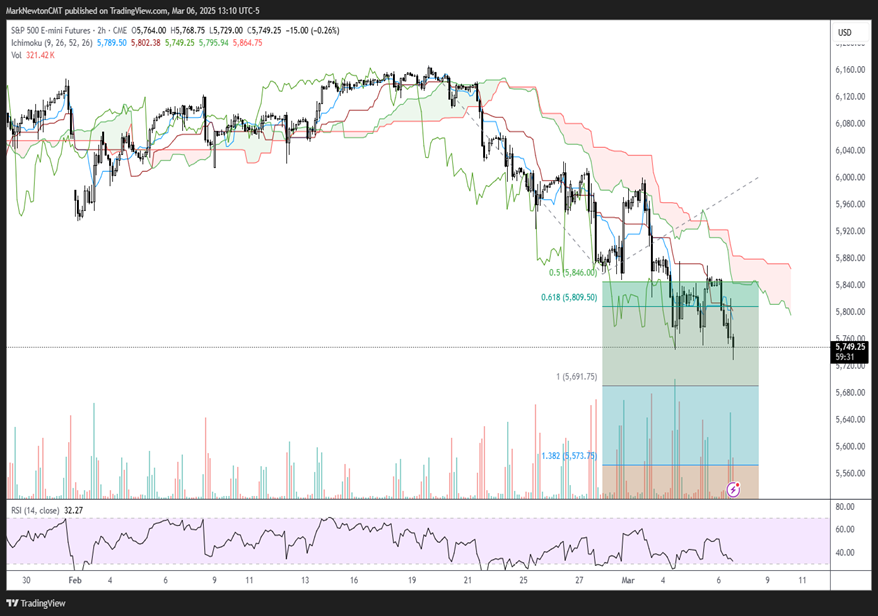
As seen below on this hourly chart of S&P Futures, the downtrend has proven relentless and could lead to 5681. To have confidence, SPX requires a move back over 5865 at a minimum and requires a move back over a previous day’s highs on a close. This hasn’t happened since all-time highs were registered 11 trading days ago on 2/19/25.
S&P 500 E-mini Futures
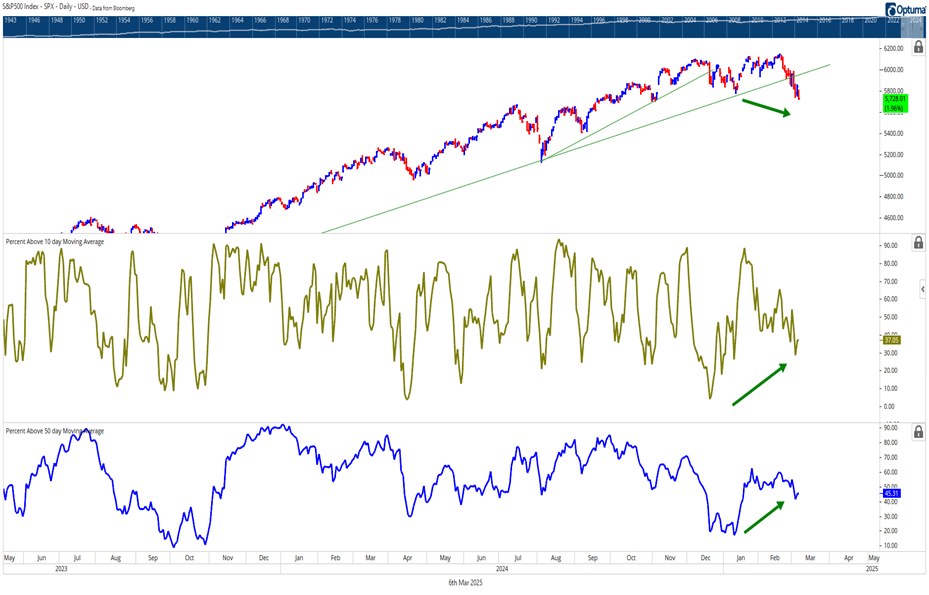
Breadth has held up despite the pullback under January lows
Several breadth gauges have held up quite well since the most recent decline started 11 trading days ago from all-time highs in SPX on 2/19/25. McClellan’s Summation index remains in good shape and the percentage of SPX names above their 10-day moving average (m.a.) as well as 50-day m.a. are both meaningfully above where they traded back at market lows on 1/13.
Normally, breadth divergences like these (stock index prices are lower, but breadth is higher) can help to pinpoint market lows.
Thus, outside of factors like bearish sentiment, intermediate-term trends are intact (QQQ), so it’s often insightful to keep a close eye on breadth.
I suspect this is important as a positive, but the velocity of our recent pullback will demand some stabilization before having conviction that a low has arrived.
S&P 500 Index – SPX – Daily – USD
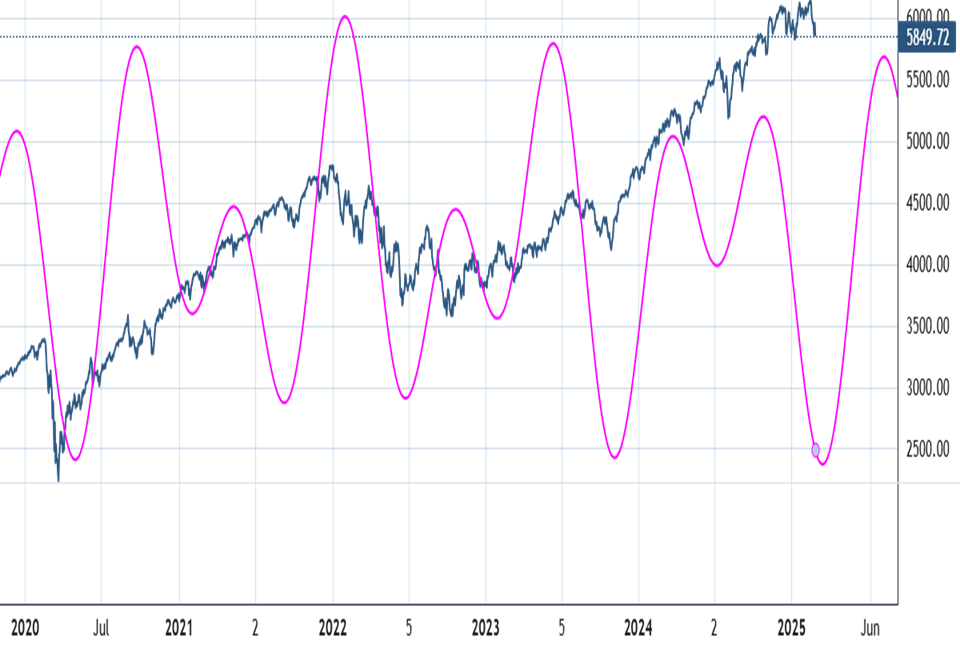
Daily cycle composite makes a good case for a strong trading low by 3/14
Of the short-term cyclical composites I utilize, there are two that both show downward pressure into the spring. (Note: the intermediate-term cycle on my 2025 Technical Outlook by Ferrera back in January (not shown here) also showed spring weakness in 2025 followed by a sharp rally back to new all-time highs into late Fall 2025.)
As shown below, this bottomed in 2020, 2022, 2023, and 2024, near the area where SPX also made its lows.
The peaks have been less accurate in recent years on this particular model, but did show a peak near the bull market peak in early 2022 as well as mid-2023 which preceded the selloff into October 2023.
Looking below, this started to turn down in the Fall of 2024 which didn’t equate to Equity prices falling, but did coincide with breadth readings starting to fall dramatically last October.
The bottom according to this model could happen by 3/14/25 which lines up with next Friday. This date might also prove significant as it lines up with the date for a possible Government shutdown which hopefully can be avoided.
Daily Cycle Composite
Thus, while Eliott-wave, sentiment, and DeMark tools all suggested lows might be near, cycles now say this might happen as of next week. As we know with Technical analysis, the most important confirmation comes not from any specific technical reading itself, but purely from price improvement.
Thus, it’s important for the price to break the downtrend from 2/19 and to see volume and breadth expand. At present, there hasn’t been a single trading day since the recent mid-February peak, where SPX’s closing price has surpassed a prior day’s highs. This is a necessary first step towards gaining some optimism. However, it’s encouraging to see this model suggest lows could be near based on cyclical rhythms, which have coincided with several important market bottoms in the past.
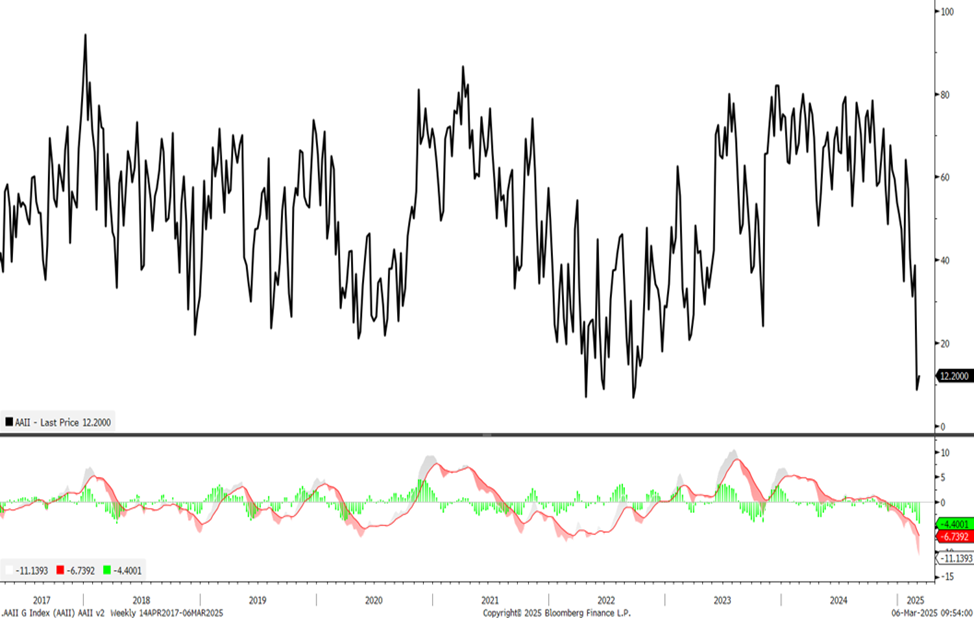
AAII data continues to show a very high percentage of Bears
AAII data (American Association of Individual Investors) continues to show bearish sentiment being quite elevated for the second straight week, and the negativity on both AAII, Fear and Greed and other retail polls shows bearish sentiment being the highest since 2022.
Of course, this doesn’t imply that markets necessarily have to bottom right away, but I suspect that this is close. Note that there is no evidence of capitulation, meaning abnormal downside volume or high Equity Put/call data, and this is not always necessary before markets turn.
Last week showed 57% Bears and 19% bulls, for a net negative spread of around 38% which is extreme. See this chart where the last time markets were at similar levels of fear was following the bear market of 2021-2022.
Looking back over the last 25 years, there’s only been 1 other case outside of 2022 where bearish sentiment was this elevated and this was 2009 following the 40% drawdown from 2007-2009.
AAII G Index