
I want to wish everyone a very happy holiday season. I appreciate all your support and wish you a very happy New Year and a prosperous 2025!
SPX remains in a short-term bullish uptrend from last Friday’s lows as part of a mild period of bearish consolidation that began roughly three weeks ago. US Equities have officially entered the “Santa Claus Rally period” which has averaged roughly +1.3% returns since 1950. The lackluster volume and breadth of this recent bounce require a bit more price strength out of US Equities before arguing that prices should definitely finish out the year on a high note. US Equity bounce should face resistance into the end of the week, which might make 2024’s Santa Claus rally period turn out a bit more subdued.
Overall, with three more official days left until the end of 2024, this year’s SPX performance looks to finish out with at least the best Election year returns since 1980. However, it’s fair to say that December’s rotation coupled with lack of broad-based participation has proven to be difficult for many investors to manage.
The technical negatives which have cropped up in recent weeks have to do with the following:
- Lackluster market breadth and Equal-weighted S&P 500 decline in December.
- Bearish Elliott-wave structure.
- Traditional momentum gauges like MACD have rolled over to negative for SPX.
- SOX is down more than 12% off July 2024 peaks.
- Four-month uptrend line violation.
To the Equity market’s credit, however, the following remain quite positive
- Ongoing bullish uptrend from 2023 lows.
- No evidence of Credit deterioration; High Yield Junk spreads to Treasuries remain extremely “tight.”
- Sentiment has retreated from its bullishness since early November.
- QQQ’s weekly DeMark exhaustion signals remain premature by at least two weeks.
- No evidence of trend damage from Financials, Industrials, or Discretionary which have pulled back to near attractive levels.
- Defensive sectors like Consumer Staples have pulled back to new annual lows.
- Short-term cycle composites, which suggested weakness from late November into mid-December, now look to have bottomed.
- Bullish seasonality in December.
- Technology has held up relatively speaking and on an absolute basis.
Overall, as can be seen above, there are more technical positives than negatives. However, there has been some deterioration in many Equal-weighted indices and also DJIA, while neither SPX nor QQQ has been able to push back to new highs after having violated four-month uptrends.
The bottom line is that key resistance lies at 6035, then 6055, while 6100 is the true level that will need to be exceeded to have confidence in this bullish trend reasserting itself. However, it’s imperative for market breadth to begin to expand to have confidence in a meaningful 1st Quarter rally without any consolidation. Increasingly, it’s thought to be likely that SPX will show a corrective pullback in January, which cycles seem to indicate could happen between 1/17-3/1.
S&P 500 Index
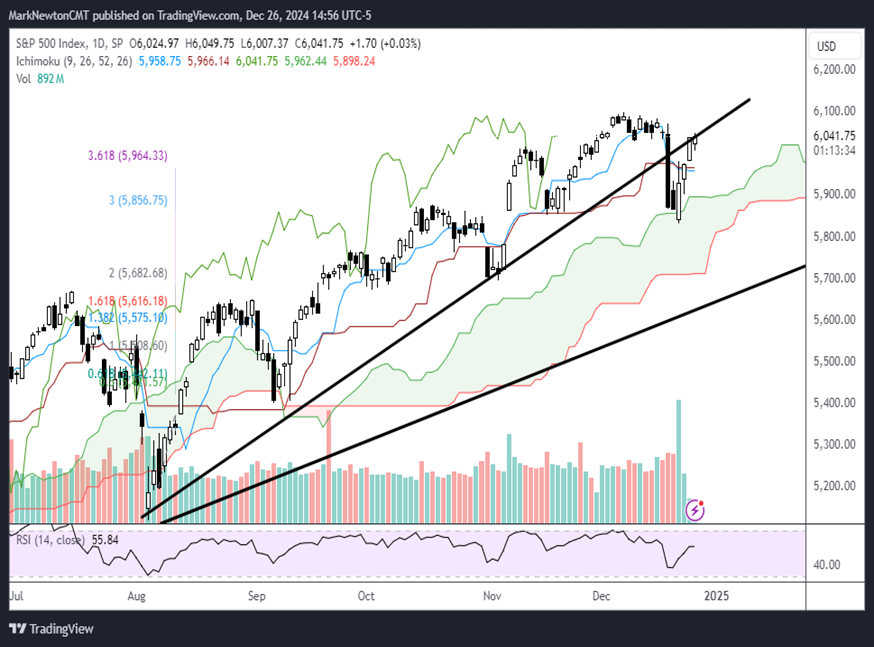
On the downside, 5982 will have importance, as this represented 12/20/24 intra-day peaks. Underneath this level lies 5942, then 5902. Regardless of when it is tested in the days/weeks/months ahead, any decline under 5902 should bring about a pullback to near 5700 which represents the uptrend line support from 2023 lows.
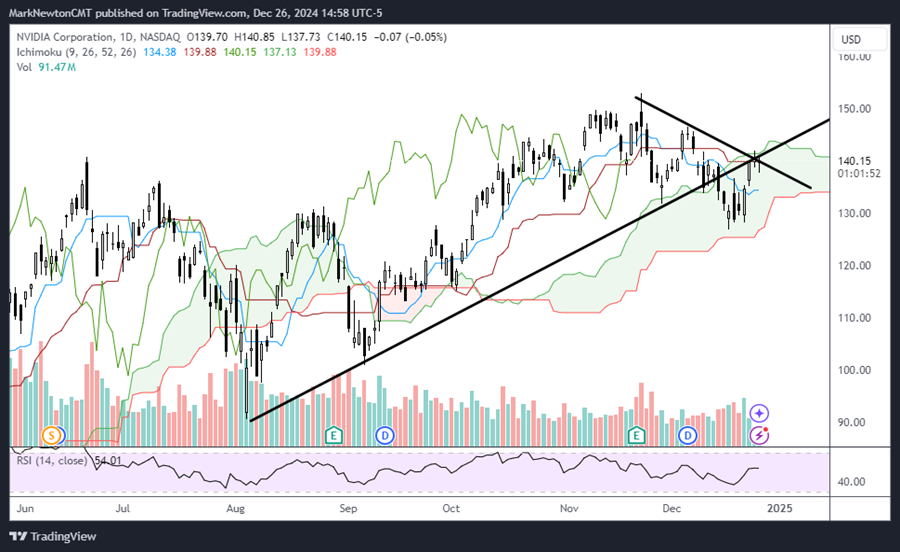
NVDA is up against resistance after initial bounce
NVDA remains one of the better stocks within the Semiconductor and Semi-cap space but remains within near-term consolidation since this peaked in November.
As can be seen, uptrends from August were breached, but yet failed to result in any meaningful deterioration that broke under its Ichimoku cloud.
Bottom line, it’s hard just yet to expect NVDA should rally back to new all-time highs given this ongoing consolidation, and NVDA requires a move back over early December intra-day peaks at $146.54. When this happens, it would be logical that NVDA would begin a rally up to $161, then $180.
In the short run, the stock has rallied up to resistance marked by both the ongoing downtrend line from November as well as the former uptrend from August lows which both tend to intersect near $140.
One cannot rule out possible weakness in January which might retreat back to $126-7, or even a bit below to $120-2. However, this would be an extremely attractive area to consider NVDA on weakness in the weeks/months ahead. My intermediate-term technical thoughts on NVDA remain quite constructive, and feel that any weakness in the weeks ahead would make NVDA an attractive risk/reward.
NVIDIA Corporation
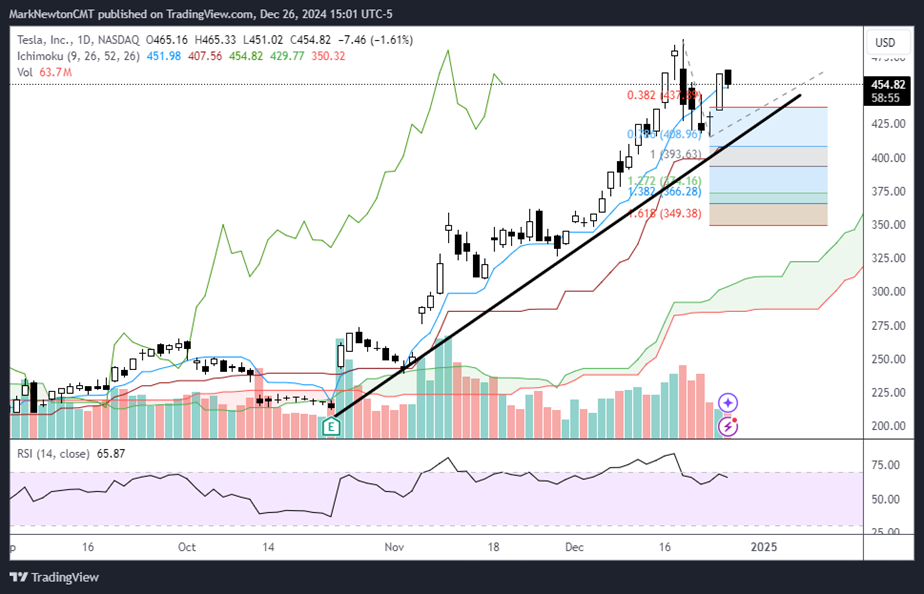
TSLA remains intermediate-term attractive despite some minor stalling out since mid-December
Through 12/26/24, TSLA has been the 10th best-performing stock in the QQQ this year, having risen more than +82%.
The stock has more than doubled from its $212.11 low on 10/23/24, but momentum has begun to wane a bit in the last couple weeks with daily MACD having made a bearish crossover.
Overall, uptrends are intact from late October lows in TSLA and there remain no daily nor weekly counter-trend exhaustion signals.
Yet, until the stock can regain its all-time highs from mid-December at $488, there stands a high probability of some consolidation following this recent run-up.
The bottom line is that the following levels are key to its near-term technical picture.
On the upside, $488, then $505-510.
On the downside, $447, then $410.
If US Equities experiences some consolidation in January and TSLA gets down under $410, this would form an ABC-type consolidation that could result in TSLA declining to $390 or to $362-$370. However, such a decline would make TSLA very attractive from a risk/reward perspective.
Short-term cycle composites on TSLA seem to show January 2025 weakness, followed by a strong push back higher between February and mid-March.
If this were to happen, then TSLA should advance up to $510, then $537.
Overall, as this chart shows below, there has been no evidence of any real deterioration since it turned up sharply two months ago from late October.
Thus, it’s right to be intermediate-term bullish on TSLA, seeking to take advantage of any pullbacks that happen in January.
Tesla, Inc.
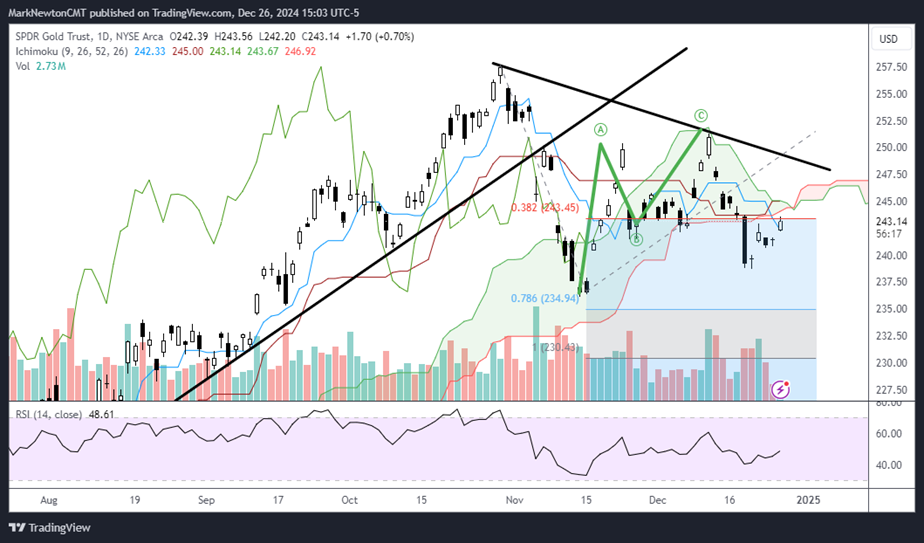
Gold likely will require Treasury yields to start lower before it can push back to new highs
Gold has proven to be uncharacteristically weak this December following seven straight positive December returns since 2017.
Some of this weakness makes sense given the start of the rise in Treasury yields from September lows as the FOMC begun to pull back on its rate cut projections for 2025.
Thus, given this negative correlation to Treasuries, it makes sense that Precious metals might hold off from turning back higher to new all-time highs until some evidence of Treasury strength gets underway. (Thus, on the chart below, it’s important for GLD to get back up above 250)
At present, Treasury yields are still trending higher, and Gold and Silver both remain in consolidation. I don’t expect this to change just yet, but both Treasuries and Gold might to work their way higher following the Inauguration in January, with February being a likely month for a possible peak in Treasury yields.
From a traditional technical standpoint, the decline on 12/18 was clearly a structurally short-term bearish development following the false breakout attempt on 12/11. Given this pattern, the most likely outcome could be a decline in GLD down to the 229-234 area from its current $243.07 (price as of mid-day Thursday 12/26/24)
Thereafter, a move back to new highs is likely for Gold in 2025, and given China’s stabilization lately, it’s thought that Silver also has appeal.
Overall, it’s wise not to add to existing GLD longs until evidence of either a break of mid-November lows from 2024 or evidence of Treasury yields peaking is more visible. The near-term technicals seem to be more bearish, for now, and look to require additional downside consolidation.
SPDR Gold Trust