Short-term US Equity trends are bullish and likely begin to accelerate higher into mid-October before finding much resistance. Despite the bearish seasonality trends, it’s hard to be too negative on recent price action, which combined with rising momentum and above-average bullish breadth, necessitates a bullish stance into October. (While Banks, Biotech, and Small, Mid-caps have been under pressure, Chinese Equities, Industrials, Materials and most importantly, Technology have rallied back sharply.) Moreover, triangle patterns have been exceeded to the upside for SPX, and DJIA, and it’s thought that NASDAQ and Russell 2000 should eventually join in on this strength. Following the Fed’s first interest rate cut in over four years, precious metals look to be showing parabolic strength while both the US Dollar and US Treasury yields start to stabilize. Overall, without evidence of any serious technical damage, it’s difficult turning too negative on US equity markets.
Last Thursday’s surge was truly the day that set the tone for how the next 3-5 weeks could play out. Despite some choppiness since last Thursday’s SPX breakout, SPX remains just 6 points above where SPX closed back on 9/19, trends and momentum have improved over the last week, and markets have proven resilience during a seasonal period that was widely thought by most Financial media to be negative.
However, there’s been some interesting price action happening “Under the hood” so to speak in risk assets. Bond yields have risen nearly 18 bps since FOMC’s 50 b.p. rate cut. The US Dollar has stabilized. Technology has managed a very impressive rebound in the last week. (While XLK remains lower over the last one-month, the Equal-weighted Technology ETF (RSPT) has been the best performing of any of the 11 Equal-weighted ETFs that make up the US stock market on a rolling 1-week basis.)
Healthcare, however, has underperformed, and stocks like REGN, MRNA, AMGN, and MCK are all down more than 6% in the last week. Given Healthcare’s weighting within SPX, that hasn’t been a helpful sign for this past week. The Biotechnology rally in particular looks to have failed, yet again, prior to an impending breakout. Finally, Small, and Mid-cap Stocks have largely been under pressure in the last few days. Regional Banks have also not been acting well, as KRE has fallen for the last four trading sessions.
Thus, some of this small-cap underperformance could be attributed to why XBI and KRE have lagged this week. However, most of these underlying sub-sector developments have not been a “net negative” for the stock market. Forces like China coming back along with Materials and Industrials stocks outperforming, have largely served to buoy US equities, despite some underlying weakness within a few sub-sectors.
Overall, my thinking on Equities remains unchanged. The combination of bullish technical structure, less than ebullient market sentiment coupled with constructive market breadth, and a healthy rebound in Technology likely should help US Equities push higher despite the bearish seasonality trends.
Thus, Tech coming back, along with Industrials, Materials and Chinese Equities remains a larger bullish factor for SPX, than any negatives based on Healthcare or Bank underperformance.
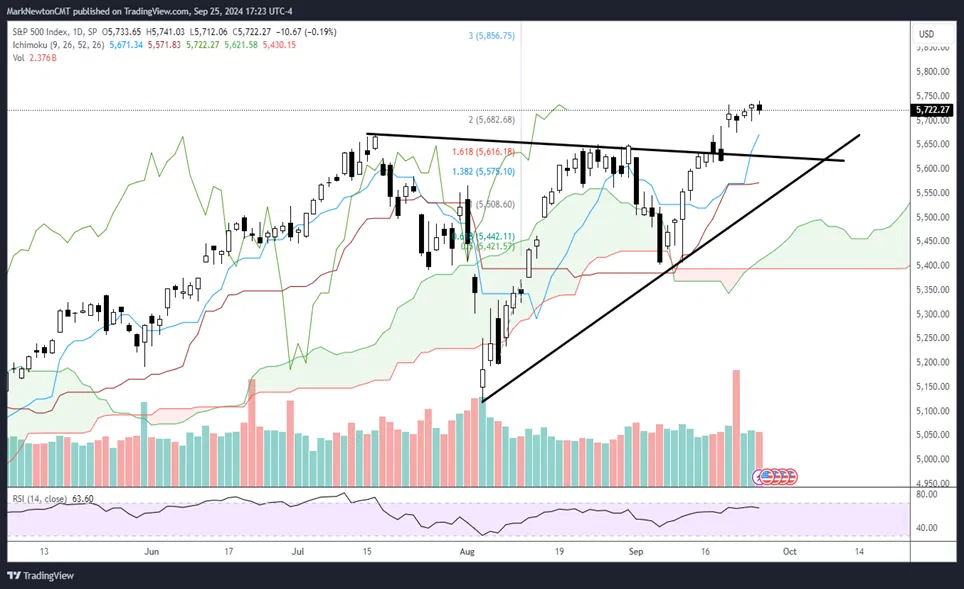
Movement back over SPX-5733 likely could take SPX higher to near 5933 before finding much resistance. The NASDAQ 100 index has technical resistance near $21k.
S&P 500 Index
Equal-weighted Industrials are just breaking out vs. Equal-weighted S&P 500
This is an important development and not one many will catch when studying XLI, nor relative charts of XLI to SPY, which largely pits Industrials against Technology.
As many know, XLI broke back out to new all-time highs this past Spring and has enjoyed a healthy runup.
However, this doesn’t explain its recent outperformance, and both RGI (Invesco’s Equal-weighted Industrials ETF) along with XLI (Sector SPDR Industrials ETF) have outperformed most sectors over the last month.
Some of this might be due to the FOMC’s rate cutting cycle having finally begun. Given projections in the Swaps market for rates to decrease 200 bps between now and next Summer, Industrials seem to be a sector that has benefited quite nicely from that in the last week.
However, some of this involves the combination of Defense stocks along with Homebuilders outperformance along with strength in many Capital Goods stocks which have begun to thrive in recent weeks. Machinery stocks like CAT which have a large percentage of their revenue coming from Overseas tend to thrive as the US Dollar goes lower. Finally, as many might know, GE recently broke back out to new all-time highs.
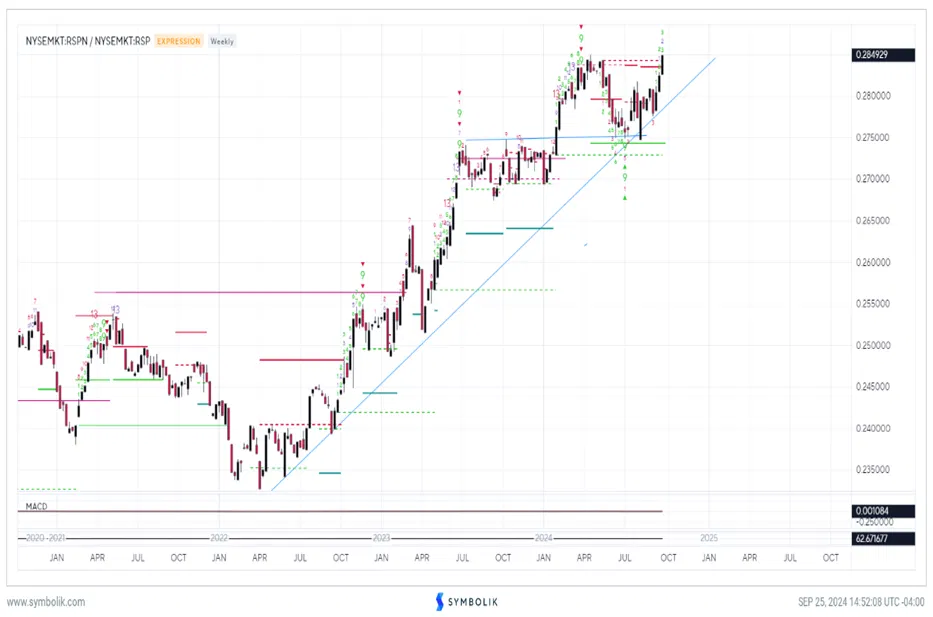
However, it’s this relative chart of RGI in ratio form to RSP which makes this important to discuss today. Industrials is just breaking back out to new all-time highs vs. the S&P (both in Equal-weighted terms to avoid Technology dominance) for the first time since this past Spring. (See chart below)
While Industrials as a group doesn’t carry much weight in ^SPX these days, I believe this move is a huge positive for the sector, and I continue to find Industrials to be a technical Overweight and one of the best sectors to favor for outperformance between now and next Spring.
NYSEMKT:RSPN / NYSEMKT:RSP
20 of my favorite Industrials names from a technical perspective at present are:
RTX, JCI, HWM, CAT, BLDR, MAS, PNR, DOV, LMT, PH, URI, EME, GWW, J, GE, AXON, TOL, FLS, TT, and IR.
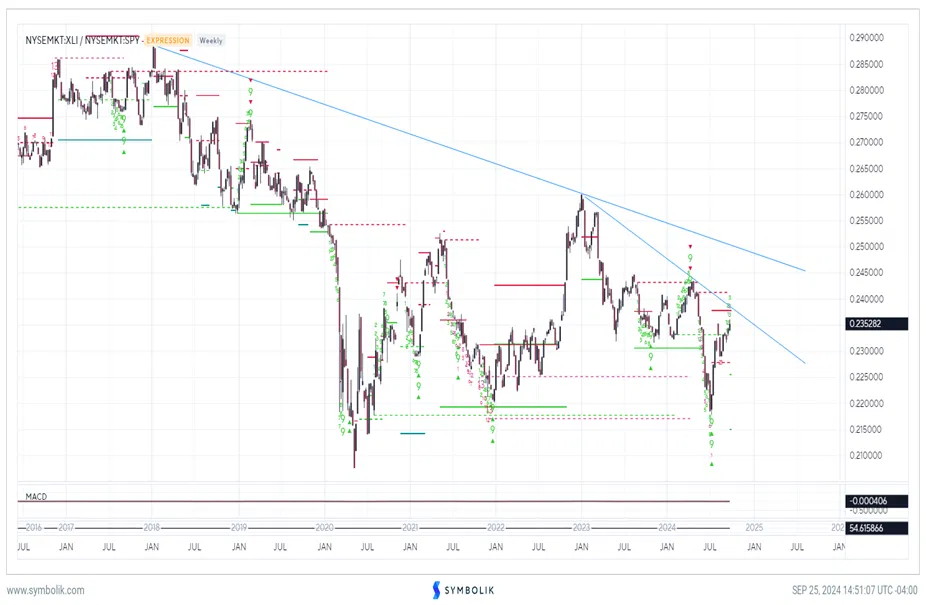
XLI vs. SPY looks much different and not nearly as bullish
As discussed, when utilizing any major SPDR Sector ETF vs. SPY it’s important to realize that there tends to be a huge probability of distortion by just a few companies that will give a different view than when eyeing the relationship purely from an Equal-weighted perspective.
XLI has over 4% weightings in stocks like BA which are serious technical laggards. Meanwhile, SPY has AAPL, MSFT, AMZN, NVDA, and GOOGL that represent a combined ~20% of SPY. Thus, making a bet on any sector relative to SPY is largely just a bet on a sector vs. Technology itself.
As weekly charts of XLI vs SPY show, the Industrials sector vs. SPY doesn’t look nearly as attractive.
NYSEMKT:XLI / NYSEMKT:SPY
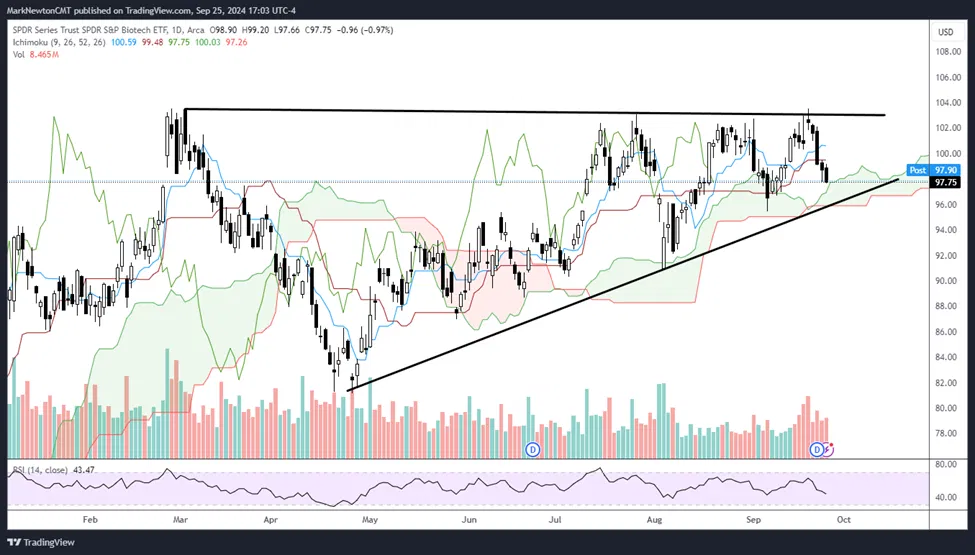
Biotech has failed to break out, as Healthcare starts to weaken
The attempted breakout in Biotech looks to have failed, for now, and it’s just important to recognize that this trade will take some time following the movement this week.
While I still view this chart of XBI to be attractive, (SPDR Series S&P Biotech ETF) Healthcare as a sector has begun to slide in a not so comforting manner in the last week.
Some of this might be attributed to the Election polls starting to tighten up lately. Another possible reason is the move towards “risk-on” which has caused defensive sectors like Consumer Staples to begin to lose ground in the last week.
Healthcare largely remains a defensive sector, despite areas like Biotech which are much higher beta than that of REITS, or Utilities.
In any event, this pullback cannot afford to undercut $95.43, the area of early September lows, without resulting in this entire trend from Spring being broken to the downside.
Biotech looks to be nearing true “Make-Or-Break” territory on this week’s slide, and at present, has not violated intermediate-term support which would suggest any meaningful trend damage.
SPDR Series Trust, SPDR S&P Biotech ETF