The US equity rally over the last nine of 11 days has been constructive enough to think a move back to new highs can happen into September ahead of any seasonal Fall correction. The Equal-weighted SPX has already pushed back to new all-time high territory coinciding with the breakdown in the US Dollar and Treasury yields. Furthermore, market breadth remains constructive and Sentiment is not yet bullish enough to mark a larger market peak. Cycles show strength into mid-September in both Equities and Treasuries before a selloff takes hold, and sectors like Financials and Consumer Discretionary have been instrumental in serving as a “tailwind” for Equity gains at a time when Technology has been a bit wobbly. Overall, unless Technology starts to roll over in bigger fashion or the economy starts to weaken in a much faster rate, it looks right to stay bullish past Labor Day and expect any weakness proves short-lived.
Monday’s fractional weakness looked to be dominated by Technology, as six of 11 sectors were positive on the day and market breadth along with volume into Advancing vs Declining issues was positive.
Despite some market participants feeling that Monday could have been the start of a correction for stocks, S&P 500 failed to undercut last Friday’s lows and remains within 1% of all-time highs.
Furthermore, Equal-weighted S&P 500 continues to show excellent strength following its recent move back to all-time high territory and outperformed SPX, finishing roughly flat on the day.
DJIA and IWM were also positive for Monday, so this minor “blip” lower on Monday looked to be merely a pre-holiday pause ahead of a coming push to new record highs.
Volumes were about 11% below their 10-day average on Monday, but barring any weakness to multi-day lows, it’s quite difficult to claim that late month weakness to rebalance portfolios after a strong month is underway.
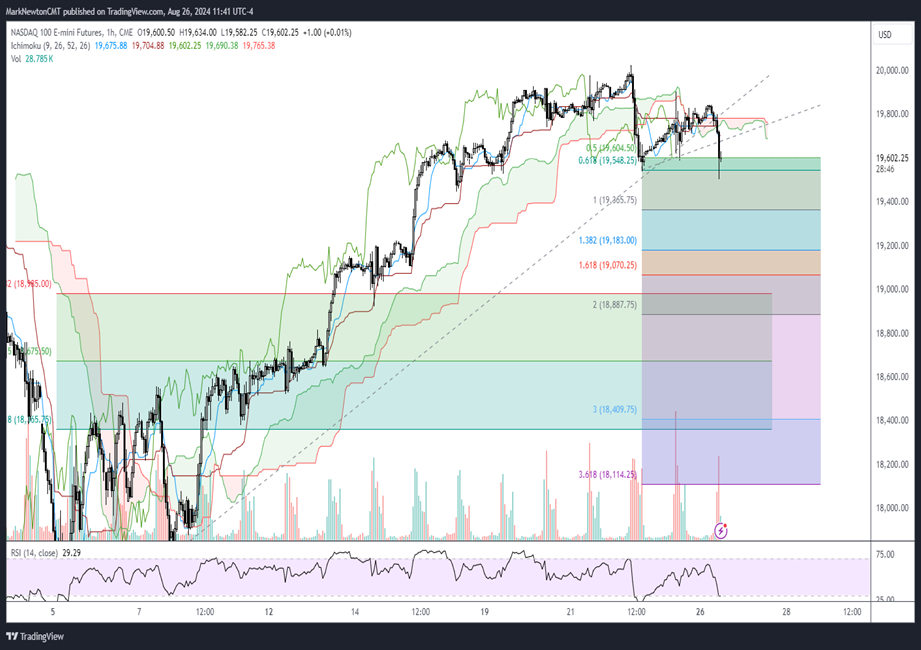
NASDAQ Futures, as shown below, fell to test last Thursday’s lows near 19542, but successfully held above this level. If/when 19542 is broken, it should simply result in a mild pullback to 19365 only, in my view, but likely doesn’t represent the start of any larger setback.
I suspect that NASDAQ futures likely start to rebound post NVDA earnings and should rise to near $20216-$20266 which might have importance on the upside, while movement above this level might allow for a quick test of $20983 into mid-September.
Thus, while many are fearful that a seasonal setback is getting underway, price action has proven merely range-bound over the last week, not bearish and these types of neutral consolidations likely mark wave 4 movement ahead of a push back to new highs.
NASDAQ 100 E-mini Futures
Small-caps have begun to turn back higher in a big way
Don’t look now, but the Small-cap shakeout very well could have run its course following the very steep three-day selloff into 8/5/24 lows.
While this move was certainly greater than many including myself expected, it failed to do much technical damage on an absolute basis, having held the support trendline which has provided a cushion to declines for most of 2024.
Moreover, on a relative basis to SPY -0.70% , we see that IWM -1.38% (Ishares Russell 2000 ETF) did make a false breakout into mid-July but now has regained more than 50% of this relative weakness in just the last couple weeks.
August, in fact, has been quite supportive of Small-cap strength and Russell 2000 managed to outperform SPX over the last week with gains of +2.35% vs. an SPX return of +1.45%.
On a relative basis, there does look to be some work that needs to be done after the recent damage. However, this past week has certainly helped to “lay the groundwork” in many respects given its strong rebound.
If this rebound can recoup more than 75% of the decline from mid-July, it should continue to press higher to test and exceed these former mid-July peaks.
IWM vs RSP
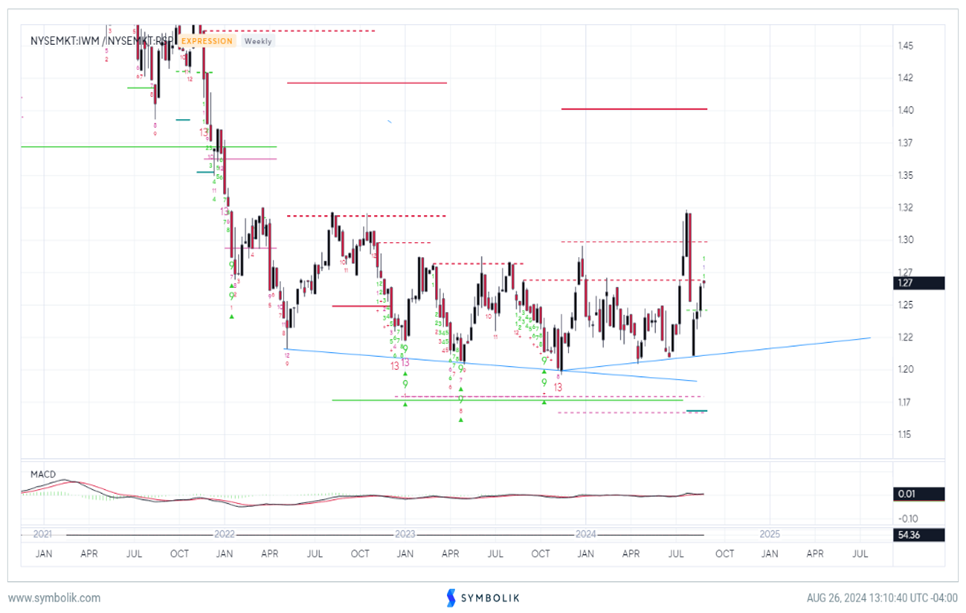
Bottom line, a big setback did occur on a short-term basis to absolute and relative charts, but the rebound over the last two weeks has been encouraging and sets the stage for additional small-cap strength.
Note, if NVDA -2.86% beats and raises guidance on Wednesday, this likely would prove to be beneficial for Large-cap Technology and Small-caps likely would lag Large-cap for a bit heading into September. However, the key takeaway is that despite the sharp pullback into early August, this only temporarily derailed the Small-cap trade, but did not eliminate Small-caps as an area that can strengthen into September.
My view is that a move over $228 might take place between November and next Spring which should lift IWM -1.38% up to $244 and potentially higher and might serve as a more linear rally than the period from now until the US Election.
Overall, I’m bullish on IWM to rally to test July peaks and the act of getting over $228.63 should allow for a continued rise to test $244. Thus, the “Summer of Small-caps” trade still looks to be working, despite the minor setback earlier this month.
Equal-weighted S&P has enjoyed a nice month of relative outperformance, but can this continue?
Equal-weighted S&P 500 has enjoyed a nice rebound in the month of August following its pullback to near-term oversold conditions.
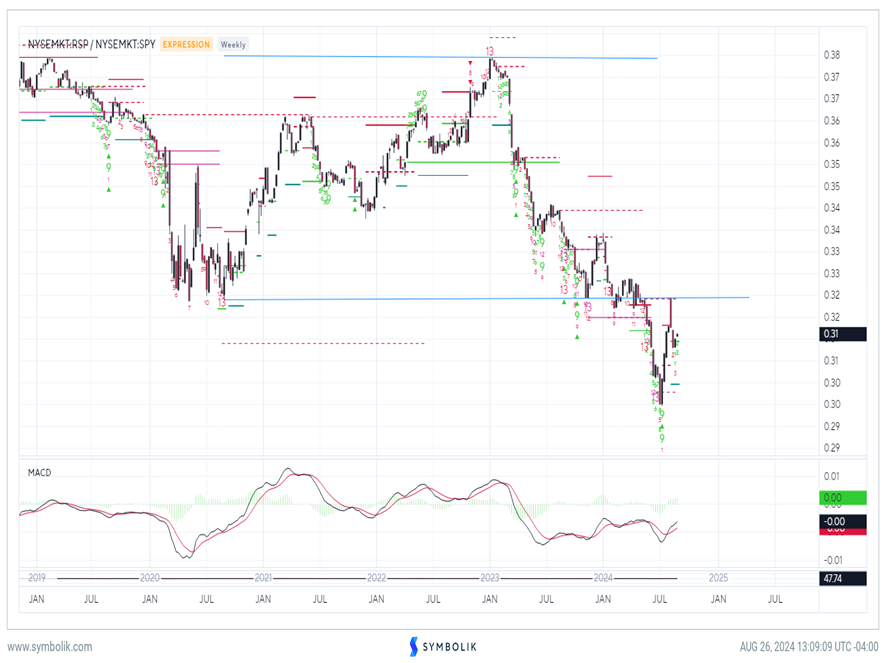
When viewed on relative charts vs. SPY, RSP bounced sharply up to test meaningful resistance near the prior lows from 2020 which held on the first challenge.
At present, the August highs from last week will need to be surpassed along with 2020 prior lows to have faith of Equal-weighted S&P 500 continuing to show dominance into September. At present, while this move in RSP appears to be more than just a tactical four-week advance, we’ll need to show further progress before thinking that an intermediate-term period of broad-based gains is likely vs. the SPY.
Such a move likely would indicate that Technology had begun to slip significantly which might not represent the best risk/reward scenario for US Equities this Fall.
At present, the recent move back to new all-time highs in RSP while SPX, and QQQ have not made this move, puts RSP in much better shape technically.
However, to continue to expect strong relative gains, the first meaningful step will be for ratios of RSP vs SPY to regain last week’s highs and definitively get back above the prior lows from 2020. The next 2-3 weeks of trading likely will likely help to explain this relative strength, or lack thereof.
RSP vs SPY
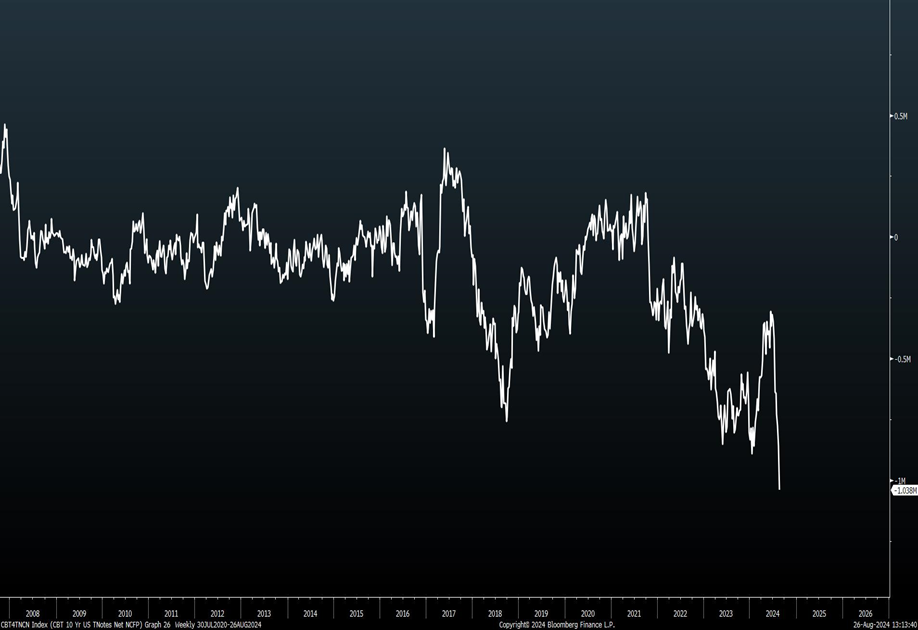
Treasury shorting by Non-commercials has grown extreme
Last week’s CFTC data showed some interesting flow in in 10-year Treasury futures, which resulted in the Non-commercial shorts to a new record of 1.038 million. The disaggregated leveraged fund position is also at a record (not shown), so some of this also represents Basis trades.
Yet, it’s unusual to see the degree of Shorting 10-year Treasuries given a 90 basis point (b.p.) decline in 10-Yr Yields in just the last four months. The last major swing low from September 2018 occurred right near a meaningful peak in yields which occurred with TNX up near 3.25 before it declined to under 0.55 bps within 18 months.
Given that the short-term pattern doesn’t yet look complete, technically speaking, I expect yields to continue lower into mid-to-late September, and do not feel like this minor stabilization since early August represents anything important.
A pullback to break 3.76% should be ongoing which should take the US 10-year Treasury index (^TNX) down to challenge and break 3.66% with targets for mid-September near 3.55-3.60%.
US 10 year Treasury Index