Big breakdowns in SPX and QQQ were not followed by large breakdowns in Equal-weighted SPX and/or many of the sectors outside of Technology. Key issues seem to be the severity of the USDJPY and 2-Year yield declines, while the US Dollar began a meaningful decline given Friday’s weakness. Economic data seems to have precipitated this recent severe drop in US Dollar and Treasury yields. However, it’s hard to see long-term yields move too much lower in the short-run. Small-caps underperformed sharply this past week, but I feel that Small-caps should remain an area of focus between now and mid-September. Interestingly enough, three separate sectors rose to new all-time highs in the last week: Industrials and Financials on an Equal-weighted basis, while Healthcare’s XLV just made its own all-time high. Given the break of SPX 5390, bounces early next week likely still could face selling pressure into late next week as the Cycle composite suggests a mid-August low should be in place. However, I’m reluctant to give much credence to the idea that a larger market peak is upon us. While the “Tech Wreck” has proven violent, most of other parts of the broader market remain in good shape.
Bottom line, at present my reluctance to get too bearish has more to do with the broader market holding up in great shape, despite the “Tech Wreck” causing damage to the QQQ. I still sense that the back-half of August can work quite well and any near-term pullback can certainly be followed by a sharp rally back higher. However, given the cross-asset volatility, markets certainly have entered a more volatile time, and even on a recovery rally into September, could be vulnerable to the seasonal weakness that normally takes Stock indices lower into Election time.
At present, some minor stabilization might allow for a quick bounce Monday into Tuesday, but the extent of the negative momentum makes me reluctant to get too caught up in calling a major low just yet.
Looking back, the technical structure of this SPX slide since 7/16 tells us a couple of things: First, the first move down was clearly 3 waves before yet another 3-wave bounce (this has been made abundantly clear given today’s break of support). Second, the decline that started yesterday could very well last either as long as the first decline 7/16-7/25, or might be a ratio like 50 or 61.8% and normally should be measured for price and/or percentage change. Prices nearly hit the 100% level into the 2:18 EST bottom. However, the rally off this level can’t yet be trusted for being “The low” just “A Low”.
I suspect that rallies to fill this gap are likely early next week, which would carry SPX up to 5428, but then a final washout indeed looks possible, and following a bounce, movement back lower would help create divergences and volume dislocation to appear which will produce our low.
The good news is that when this is done, we have an excellent chance of pushing back to new high territory in SPX which might seem unlikely given Tech’s deterioration. However, this looks perfectly normal in this new period of volatility.
S&P 500
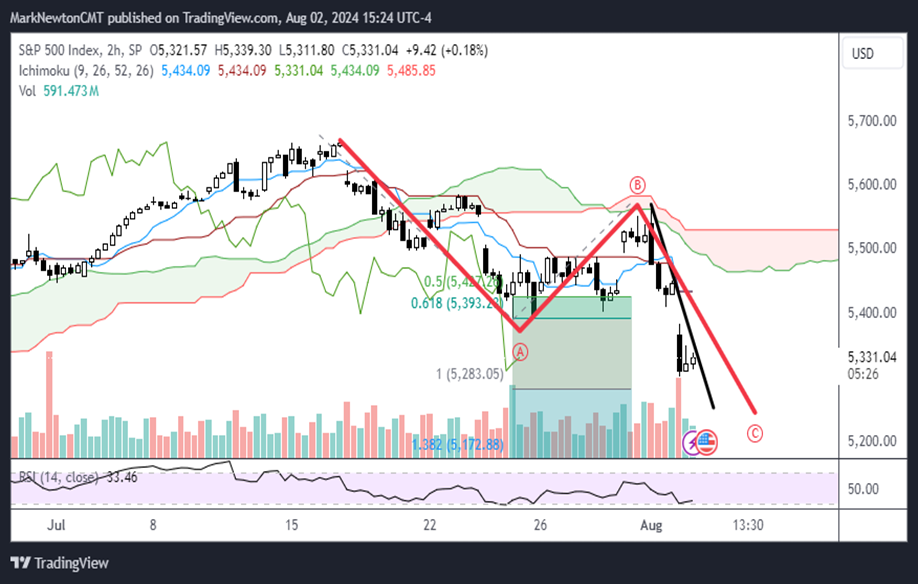
A couple things are important to reiterate following Thursday and Friday’s decline:
-Short-term market breadth started to get more negative after a very docile start earlier this week. Friday registered around 3/1 negative Advance/Decline data, but still no real evidence of capitulation and broader breadth levels remain in good shape.
-No evidence of fear-based selling as TRIN registered 1.54 Friday, the lowest all week. However, VIX rose to over 29 and backwardation likely means that lows should be approaching.
-Three sectors hit new all-time high territory over the past week, Industrials, Financials on an Equal-weighted weekly close, while Healthcare accomplished this feat this week via XLV.
-Uptrends for DJIA, IWM, RSP remain intact, despite this week’s selloff. SPX did in fact break its uptrend from last October, while QQQ rallied intra-day to arguably hold its uptrend.
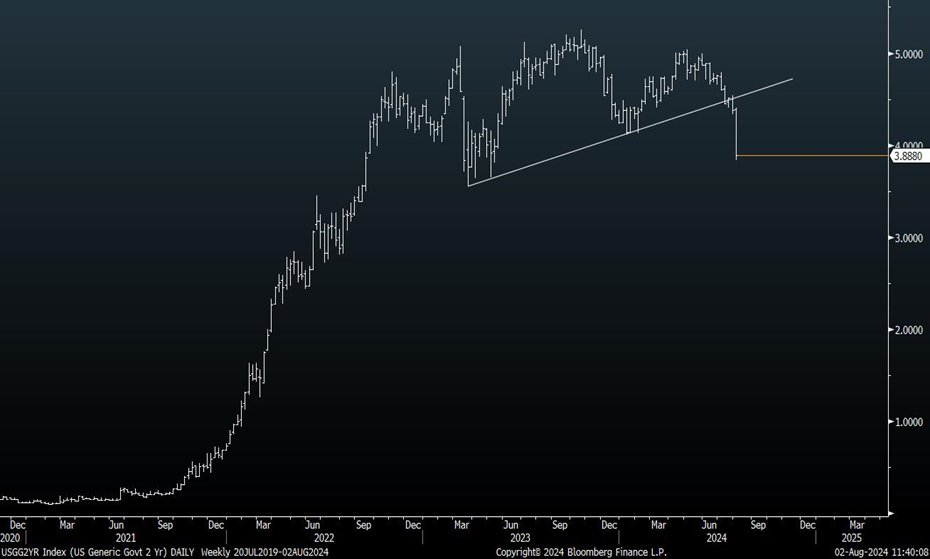
Treasury Yield breakdown might have been abnormally severe in recent days, but 2-Year yield breakdown remains quite negative technically
This plunge in 2-yr. yields is something not many are talking about, but this breakdown has pretty bearish implications for 2-yr. yields while 10yr. has declined to test right above last Dec 2023 lows much quicker than i had expected.
Cycles suggest weakness until at least September. If TNX undercuts 3.78%.. (which seems unlikely based on my work right away), then a decline to 3.22% looks to be in store between now and next Spring.
Projections for 2yr yields can allow for weakness down to 3%, technically, which would line up with former highs in yields made between 2018 and 2019.
As this weekly chart shows below, the support violation led 2-yr. yields down to the lowest levels since early 2023. Thus, 2-yr yields have broken down much faster as rate cut projections grow stronger for September.
This has allowed for a steepening of the 10’s-2’s curve which has nearly reached Zero after a lengthy period of inversion. Given that 10-Yr. yields are approaching 3.78% from last December, while 2-yr. yields have already broken down, we can see a further steepening of the yield curve in the weeks ahead.
US Generic Government 2 YR Yields
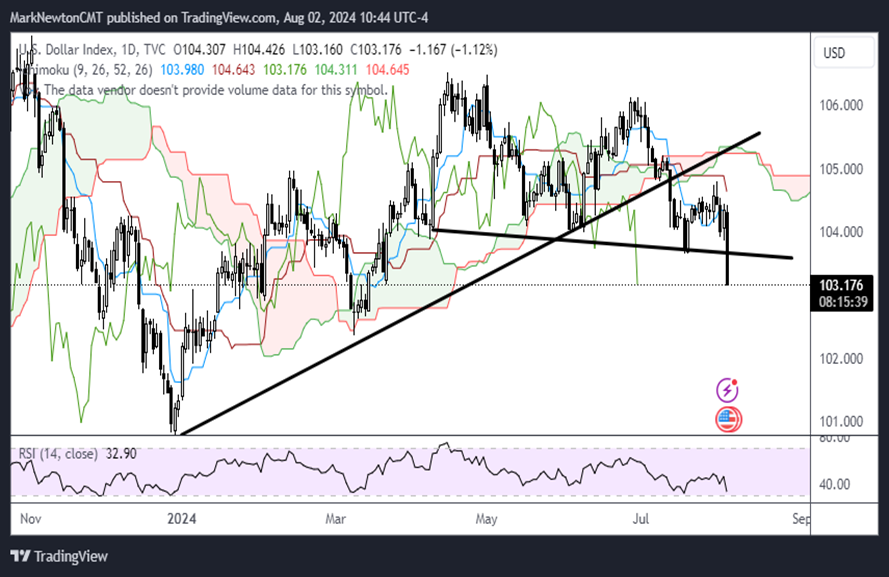
US Dollar breakdown firmly puts intermediate-term DXY bear market on track
The US Dollar broke down to follow suit to the pullback in Treasury yields this week, and both DXY along with USDJPY have broken support and likely will continue lower at this point (Yen gaining 2.5% today) and NKY is also lower by 5%. This week kicks off a new intermediate-term downtrend for DXY which should take DXY down to low 90s initially.
Thus, I do expect a DXY test and break of late December 2023 lows near 100.62. This week’s cross-asset volatility is a big theme and it’s not wrong to keep a close eye on USDJPY as Equity markets are unwinding. The decision for BOJ to halve their bond purchases and hike rates looks like a big deal, but DXY is clearly quite bearish and I expect much lower US Dollar in the weeks ahead, and EURJPY also still looks a bit premature to bottom in the short run.
US Dollar Index
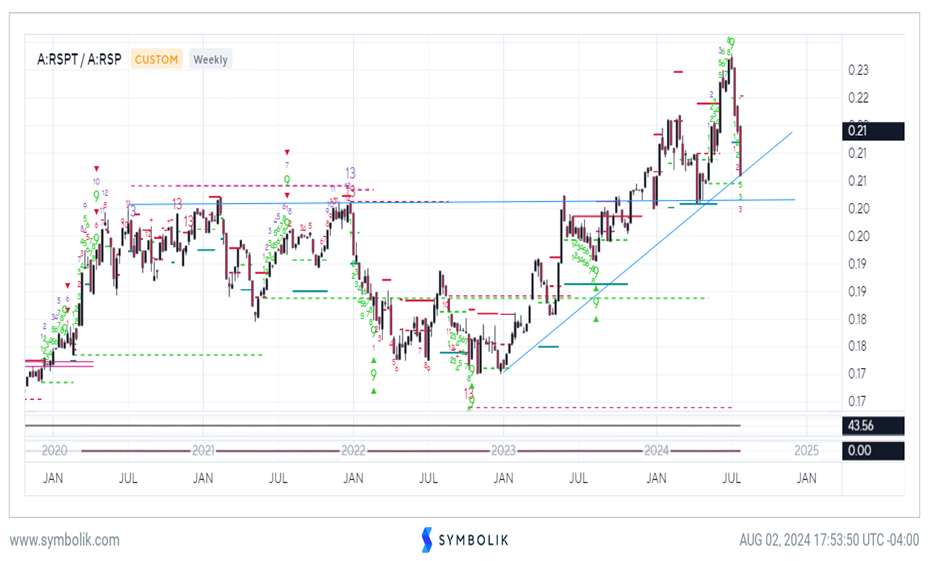
Technology likely to bottom into Support by mid-August
Following four straight weeks of severe Technology underperformance, the Tech sector has finally neared a level of important support based on the combination of its current uptrend line vs. Equal-weighted S&P 500 along with the pivot of its former breakout.
Given that charts of the SOX (Not shown) remain premature to bottom based on hugely bearish momentum, no current support and no counter-trend exhaustion signals, I think it’s likely that Technology might experience a bit more weakness between now and mid-August.
Thus, while a minor bounce might materialize early next week, it’s hard to say with much confidence that major lows are in place, despite the notable uptick in fear.
The key takeaway for Technology is that lows seem near based on the chart below. However, one can’t rule out that rallies happen from mid-August into mid-September before additional weakness happens into the US Election. If this were to happen and Technology breaks back down into its consolidation pattern in the months ahead, then one can give more credence to the idea of Tech making a larger peak. At this point, despite the near-term severity, it remains difficult to “read into” this decline too much as support remains intact.
S&P 500 Equal Weighted Technology vs S&P 500 Equal Weighted