


The economy is confusing—not just for regular people but also for economists. Despite dedicating their entire lives to understanding and predicting it, they still get it wrong much of the time.
The start of this year, too, has thrown everyone for a loop. On-and off-again tariffs, spending cuts by DOGE, and mass deportations have hurt everything from CEO confidence to consumer sentiment to potentially even GDP. Google Trends shows that searches for “layoffs” in February hit the highest level since the Covid-19 pandemic.
Perhaps the biggest hit has come from one of the most-followed economic indicators of all time—the stock market. The S&P 500 is down 3.64% this quarter, on course for its worst three-month performance since September 2022. Once upon a time, major stock indexes were one of President Donald Trump’s favorite economic indicators, but they seems to have been taken over by bitcoin. Too bad that one doesn’t look too hot either.
Yes, the mood is worrisome, but it can also be argued that this is all soft data. Until money managers sharply cut their positioning and run for the hills, there isn’t any real threat to the economy. On the other side of that argument are concerns that living under months of economic uncertainty could lead consumers to eventually break.
Not confusing at all, right?
It’s not new for traditional economic data points to paint a confusing picture. Lately, they’ve especially been disconnected from fundamentals. For example, just think about how the Federal Reserve in 2021 wrongly predicted that inflation would be transitory, or remember how many economists predicted that a recession was sure to come in 2023.
Despite being fully aware of that, we will try the impossible and predict where the economy is headed through unconventional indicators. And why the heck not? It’s not like the traditional ones are all that good anyway, and at least these ones are entertaining.
At the core of these bizarre indicators is tracking consumer spending, which is obviously the economy’s biggest growth engine. There’s hope that we won’t be too far off, but take it with a grain of salt, as not a lot of studies can back up whether these are accurate.
1) Big Mac Index
Invented by The Economist in 1986, it measures whether currencies are currently at their “correct” levels based on the price of a McDonald’s Big Mac across the world. It does so by measuring purchasing power parity, defined as the notion that in the long run, exchange rates should move toward the rate that would equalize the prices of an identical basket of goods and services between two countries.
The U.S. dollar has lost most of its gains since the presidential election. And there are worries that the era of U.S. exceptionalism is over, with many investors rotating into decades-long laggards like Europe and key emerging markets. As a result, foreign currencies have strengthened, and the Big Mac index suggests that there may be even more room for them to run up.
It costs $5.79 to buy a Big Mac in America. The Economist says that you need $3.52, converted into yuan, to purchase the same burger in China. Mexico’s peso and the Canadian dollar are cheaper than the dollar, as well, whereas, the Euro might be overvalued by 2.8%, and the Swiss franc could be 38% higher than the dollar.
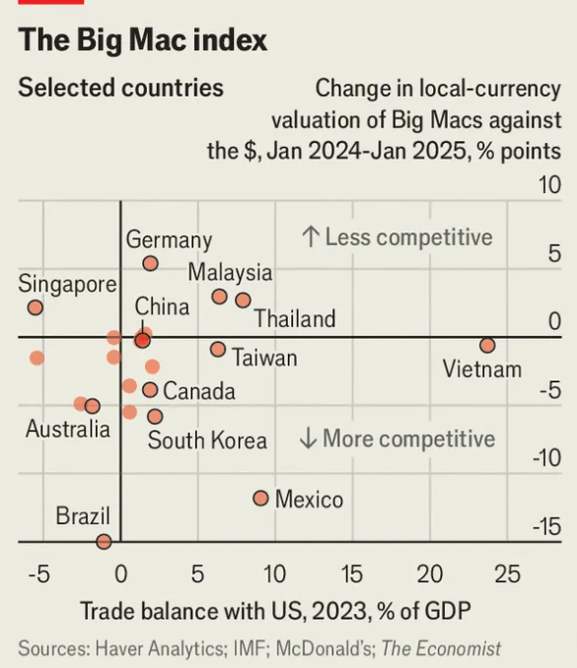
Of course, there’s always trade deficits and surpluses at play, affecting the currency dynamics, and it’s worth mentioning that foreign currencies have historically been significantly undervalued to the dollar. In several cases, The Economist, says it is also because Big Mac prices have risen less elsewhere than they have in America, citing that in South Korea “prices have remained unchanged, even as they have increased by ten cents in America.”
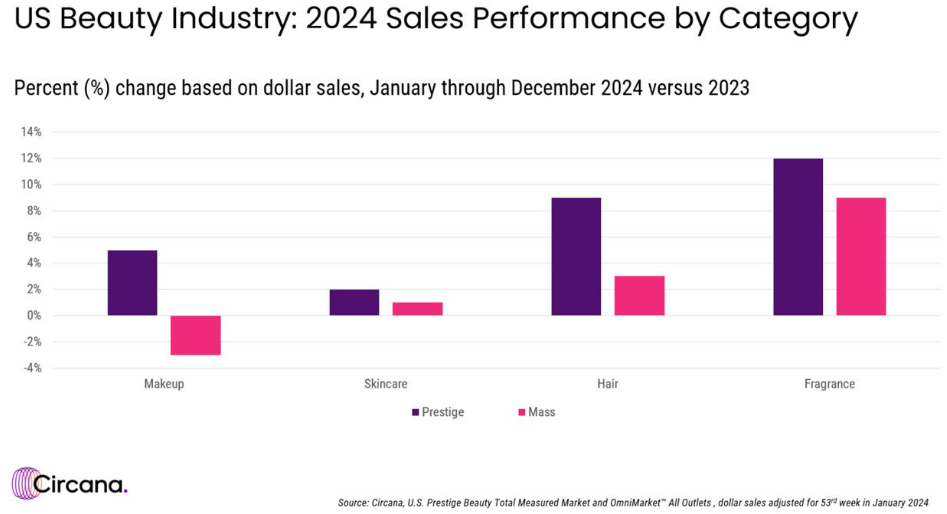
2) Lipstick Index
A lipstick is perhaps the most ubiquitous makeup item. It can be used on the lips, of course, but when in a pinch, it can also double up as blush and eyeshadow.
The idea is that when in a downturn, consumers cut back from purchasing more expensive makeup items and instead ramp up their lipstick purchases because it is a cheaper treat.
Circana, the market research firm previously called NPD, estimated that makeup maintained its position as the largest prestige beauty category, growing 5% in 2024 in the U.S. Within it, lip care was the top-performing makeup segment last year, increasing by 19% and “driven by the popularity of hybrid products providing cosmetic coverage with skincare benefits – including lip oils and balms.”
Earnings from beauty brands, however, suggests that there might be an overall makeup slowdown ahead.
Ulta Beauty has “factored uncertain consumer spending into its guidance. The retailer is also navigating a series of company-specific challenges and views 2025 as a transition year,” CNBC reported. E.l.f Beauty Chief Executive Tarang Amin said on CNBC that “mass cosmetics declined 5% in January and the company suspects that was driven by two factors: a hangover from holiday discounting and a slowdown in ‘social commentary,’ or fewer people talking about beauty online, which can drive cosmetics sales.”
Ulta shares are down about 20% this year, while E.l.f has declined 50%.
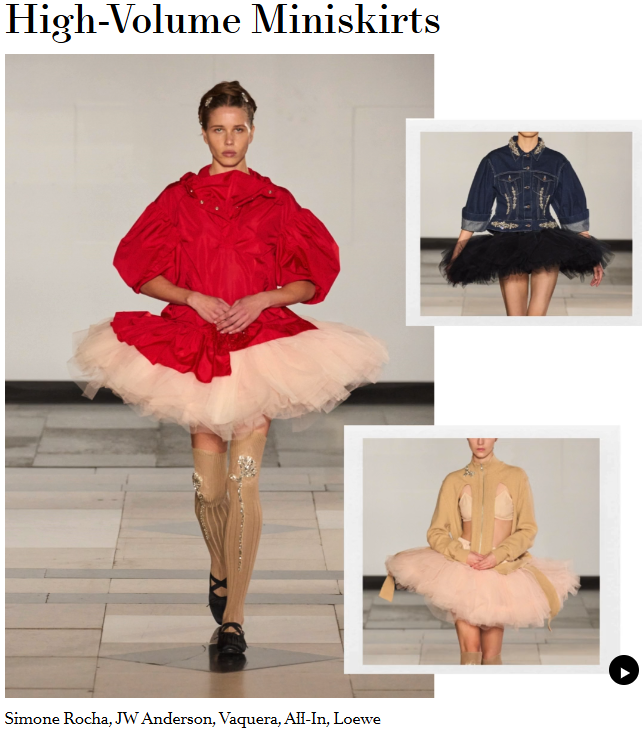
3) Hemline Index
It’s empowering to see women wearing short skirts, not just for feminism but also because it could mean that the economy is doing well.
The length of women’s skirts is correlated with rises or declines in stock prices. Skirts got shorter in boom times such as the 1920s and 1960s and longer during the 1929 crash.
If this lagging indicator is right, it might be time to pack it up and sell it all, as it is only a matter of time before it all blows up.
That’s because long skirts are in this season, according to Vogue’s Spring/Summer 2025 collection. In fact, even more worrisome is that “bubble” skirts—described as an ‘80s relic and much-slandered, socialite-favorite silhouette of the early aughts—are fashionable. A silver lining is that at least those bubble skirts are short.
Also, skorts are in. We have no idea what that means for the economy, but a helpful fashion tip nonetheless.
4) Men’s Underwear Index
It’s only right to discuss this if we mentioned the hemline index.
This is a favorite of American economist Alan Greenspan, who served as the Fed chair from 1987 to 2006. He believed that the men’s underwear sales could help predict consumer confidence and overall economic health. That’s because underwear is arguably the least prioritized purchase. The rationale goes something like this: Even if one’s boxers or briefs have holes all over them, who cares? It’s not like they will be seeing the light of the day at any point anyway (one hopes).

The same principle could extend to the sales of women’s underwear, too, and bras and socks.
Hanesbrands, a market leader in basic innerwear, reported fourth-quarter sales growth rates of 3% and 2% in its US and international segments, respectively. Morningstar analysts estimate flat sales growth and $0.55 in adjusted EPS for 2025, implying a price-to-earnings ratio of about 30 times.
Its shares have slid 26% this year. Meanwhile, shares of PVH Corp., which owns Calvin Klein and Tommy Hilfiger, are down nearly 40% and Ralph Lauren Corp. has declined 3%.
There is some research that backs up that this indicator held up during the financial crisis and Covid-19 pandemic, but it also might just mean shorting the market when your friends are buying underwear. Unfortunate!
5) Doctor Copper
Copper prices have hit fresh all-time highs, jumping to $5.11 a pound this week. The metal is used in everything from construction to electronics to utensils and is thus considered to be a gauge of global economic health. Some also argue that it represents demand out of China, the world’s second largest economy.
In normal market conditions, it could be argued that higher copper prices right now bode well for the economy, but the trade war started by Trump seems to have clouded that take.
Copper’s rise is being driven “solely by supply concerns surrounding the potential for universal tariffs to be placed on all imports of copper into the U.S.,” said a MarketWatch article citing Natalie Scott-Gray, a senior metals demand analyst at StoneX. The U.S. is “heavily reliant on foreign copper, with imports accounting for [around] 45% of demand.”
Regarding this indicator’s validity, declines in copper have preceded recessions in 1980 and 1989, but at other times, the metal has fallen during expansions or climbed before recessions.
In the long run, though, copper can still be a reliable indicator of global economic health, even on the back of Trump’s tariff policies and trade war, Scott-Gray said. LME copper prices reflect the health of the global industrial outlook, with its demand “rooted universally,” Scott-Gray said.
6) Cardboard Box Index
We all love our packages.
It is estimated that about 80% of all non-durable goods are shipped in corrugated cardboard boxes, so greater demand for boxes could signal greater demand for goods, and thus, an expanding economy. Some believe that it may reflect aggregate business estimates of future consumer goods sales. That’s why it is considered to be a leading indicator of the manufacturing economy.
Fed data suggests that the packaging economy has been stuck in a rut since 2022.
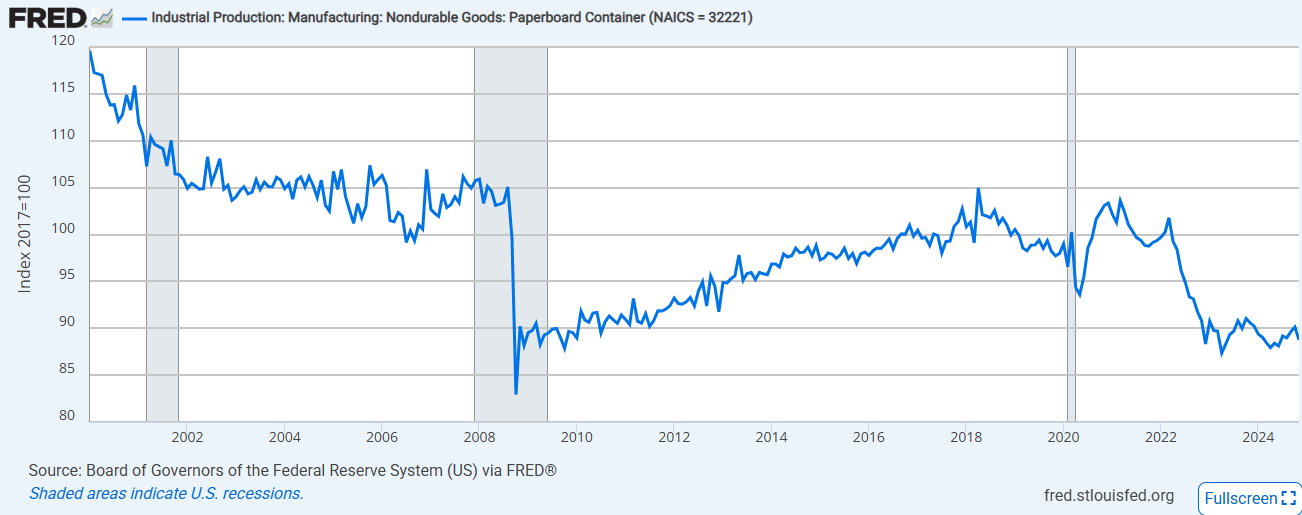
The impact is obvious on parcel delivery companies. FedEx this week lowered its full-year profit and revenue outlook. “Our revised earnings outlook reflects continued weakness and uncertainty in the U.S. industrial economy, which is constraining demand for our business-to-business services,” Chief Financial Officer John Dietrich said in a statement.
FedEx shares fell 6.45% Friday, a day after earnings. Its stock is down almost 20% this year.
Conclusion
No one has a crystal ball that can predict where the economy is headed, and no single indicator is sufficient to map out the economy’s progress and accordingly your investment strategy. A combination of traditional economic indicators, unconventional ones, and Fundstrat research, however, could help fill in some of the gaps.
As a reminder, Signal From Noise should be used as a source of ideas for further research rather than as a source of investment recommendations. We encourage you to explore our full Signal From Noise library, which includes deep dives on artificial intelligence and healthcare, rising wealth of women, investments related to natural disasters, and an update to our overview of the semiconductor industry. You’ll also find discussions about the TikTok demographic, artificial intelligence, and weight loss-related investments.


