


- Volatility is a crucial tool we use in our evidence-based research. We walk you through how we used volatility in our analysis to infer 2021 would be a good year for equities and also in selecting which sectors, like Energy, we thought would do best in the past year.
- The rapid proliferation of derivatives and financial instruments taking advantage of volatility empowers investors more than ever to define and prepare for risk. We discuss implications.
- We address the post-pandemic volatility and discuss how our team makes inferences from analyzing volatility.
- We introduce VIX term structure as a crucial indicator to pay attention to during heightened periods of volatility. We show that the VIX has been a highly useful indicator for our team.
“Sometimes the early bird gets the worm, but sometimes the early bird gets frozen to death.”-Myron Scholes
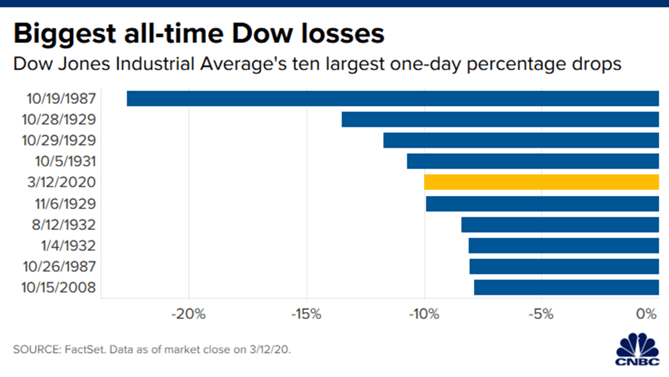
The word volatility probably has a lot of negative connotations for many investors. They associate it with red screens, losing money and gnashing of teeth. Memories of March 2020 and September 2008 come to mind. Recent volatility in large-cap technology names making up the Nasdaq, cryptocurrency and crypto equities may have frustrated you recently as well. However, what we want to convey to you is that while the initial impulse may be to become upset by volatility, there is also ample opportunity in it and ample tools to help you not only manage it but to also benefit from volatility.
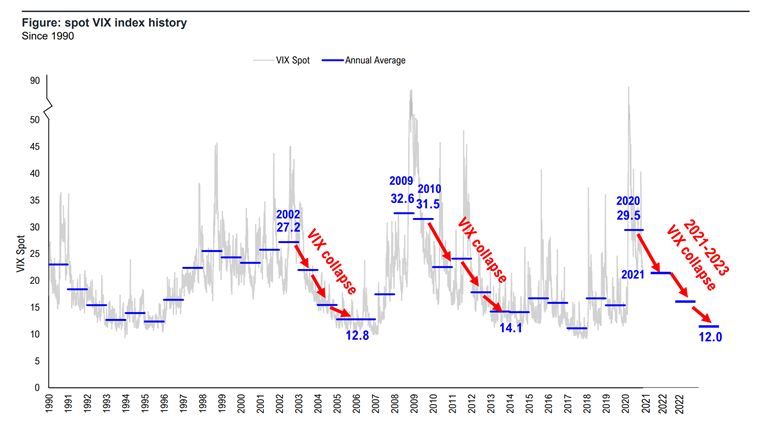
The COVID-19 Crisis caused a lot of uncertainty and volatility. 2020 was one of the most volatile years for markets in history. Many investors may remember only the speedy crash in March when they think of volatility, but when you look at the VIX term structure, the curve was actually in backwardation for the entire year. This is one of the insights we used to predict that 2021 would be a relatively low volatility year compared to 2020 and what types of stocks tended to lead after years of anomalously high volatility levels.
If one were to look back at the history of markets over the last half-century, it is impossible to gloss over one of the most significant innovations in the economic history of humanity; a better way to manage uncertainty. Whereas some innovations result in advanced technology and other amazing shiny things, the innovation unlocked by the efforts of Black, Scholes, Merton and others was done with simple algebra, but it created a risk-management revolution in the financial sector that overall made markets more accessible and efficient. It also empowered investors to define and control risk in ways never believed possible.
The overall effect on capital markets was highly accretive, though the potential pitfalls and dangers were highlighted in multiple events as well, like the fall of Long-Term Capital Management and the Global Financial Crisis. While the Black-Scholes Model has unlocked a risk revolution and helped millions of investors and virtually all institutional investors better manage and define risk the model has its limits and volatility has been by no means fully tamed. This latter fact is made starkly by the reminder that Myron Scholes and Robert Merton were on the board of Long-Term Capital Management when it dramatically failed.
Still, the model changed financial analysis forever. The implied volatility, a metric that came out of the model is the volatility implied by options contracts and oftentimes, particularly with regard to approaching events like earnings calls, this metric can prove more useful as an analytical tool than historic volatility. A few decades later, the Volatility Index became a fixture of markets and a key tool for investors.
The infamous fear index, or VIX, measures the implied volatility of the S&P 500. We will discuss how our team often uses this index to make inferences about where the market is going. A very simplified way to read the VIX is that the price is the implied volatility of the S&P 500 index over the next 30 days. If the VIX is at $20, then derivatives markets are suggesting it will move 20% in either direction over the next 30 days. This number may rarely be accurate, but what it says about the expectations of investors is just as important as the number itself. Also, the term structure of VIX futures provide illuminating insights, as we’ll discuss below.
A Smile Cracks A Model: How The 1987 Crash Changed “The Face” of Volatility
Any model always has flaws, and the Black-Scholes is certainly riddled with assumptions that have proven inaccurate in real life. The original insight has been updated and modified time and time again to better reflect real-world conditions and to meet the needs of traders. Fischer, Black and Merton were often involved in some of these efforts to modify assumptions.
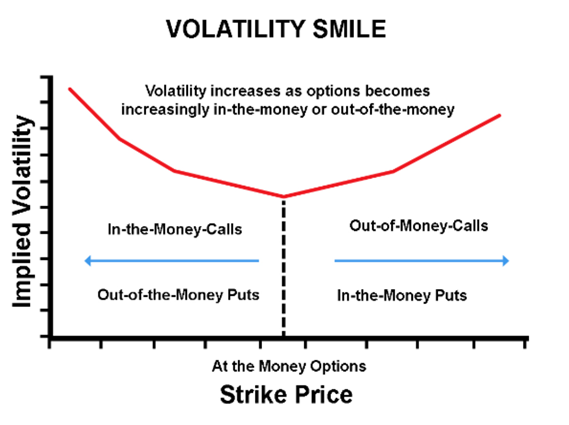
For example, the emergence of something called “the volatility smile,’ which violated a core assumption of the model, only first appeared after the 1987 crash. Ironically, this crash was considered ‘strictly financial’ and not to have really originated in the real economy, yet the appearance of the infamous volatility smile has been a permanent fixture ever since. The original formula was based on the assumption that day-to-day price moves were small, something that had to be adjusted for in later improvements.
The volatility smile refers to the upward slope when the implied volatility is graphed against the strike prices of an options chain with the same expiration date. The implied volatility rises the further you get away from the at-the-money contracts, in either direction. Many securities will not have symmetric smiles, but smirks. For instance, the VIX skews right and SPX futures skew left.
Obviously, modern options valuation methods have been updated to account for this reality which was considered impossible under original Black-Scholes assumptions. So, the model isn’t perfect, but the revolution ushered in by it has given you as an investor more tools than ever to manage and mitigate the impact of heightened volatility, and even the ability to profit from it. When volatility smiles at you, you can now smile back whereas before one proverbial storm could ruin the proverbial farm. The latter is particularly true if your cognitive bias plays off volatility in ways that augment its adverse effects.
How We Used Volatility To Gain Insights on Equity Performance and Sector Leadership in 2021
Folks have often commented that our Head of Research, Tom Lee, is one of the better market minds at maintaining his cool during periods of excessive fear and selling. We can assure you that Mr. Lee feels the burn just like anyone else, but as he advises our subscribers, he grounds himself in data-driven insights and evidence-based methods of research to orient himself during such times. This is part of how we have the confidence to buy-into periods of extreme selling, even when it feels like the sky is falling. Data speaks much louder than opinions during these periods of tumult.
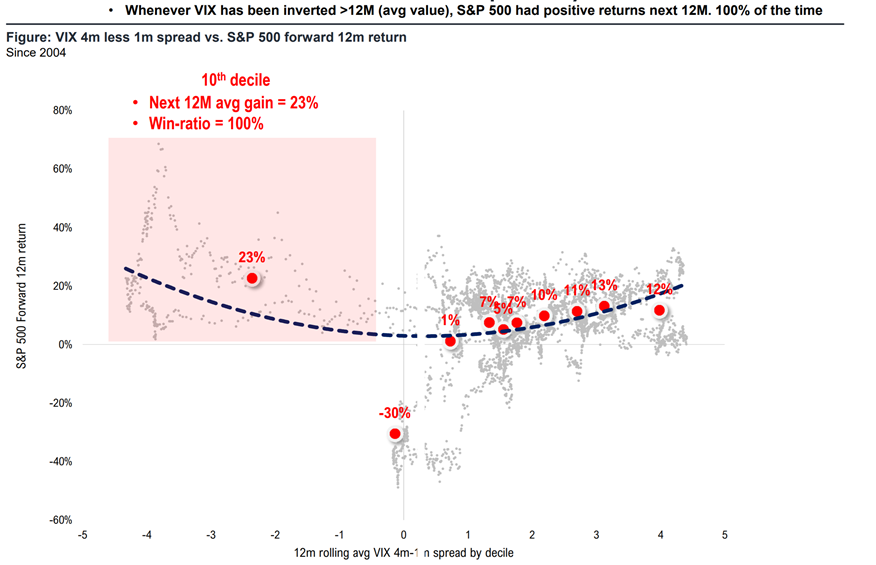
In early 2021, markets were rocked by a de-grossing caused by retail investors causing short squeezes in some popular meme stocks that caused a lot of losses for hedge funds. Folks were concerned wider market weakness might be caused by the events. We saw that the likelihood of great returns for 2021 was likely to be very high. Based on our analysis of historic data, when the VIX had been inverted for more than 12 months, the returns of the next 12 months were positive 100% of the time! We thought this coupled with unprecedented operating leverage converging with pent-up demand would be a nice mix for stocks. Of course, 2021 ended up being a stellar year for markets.
We commented that the skittishness and price activity was not indicative of negative fundamentals but instead distracted from positive ones. The S&P 500 Volatility Index normally has a healthy curve in ‘contango’ which expresses the typical and healthy relationship that time has with volatility: the more time, the more opportunity for volatility.
Thus, VIX futures ending in 6 months should have a higher spot price than VIX futures ending in a month. However, during times of anomalously high market stress the VIX goes into backwardation which means investors expect more volatility in a month than they do in six months. This obviously is not the typical order of things. When we did our historical analysis, we noticed that this tends to precede market bottoms before prices revert back to moving higher, thus turning volatility into opportunity.
We use the 4M VIX minus the 1M VIX as a proxy for the important bellwether’s backwardation. Usually, when the VIX flips from backwardation back to contango, it is a sign that market stress has subsided. When this number contracts it is a sign that volatility is on the verge of reverting to more normal levels. This indicator has been highly useful to us in navigating post-pandemic bouts of volatility. The trend has been markets getting more and more accustomed to things like COVID-19 cases. Volatility has, so far, not exceeded the extraordinary levels of March 2020.
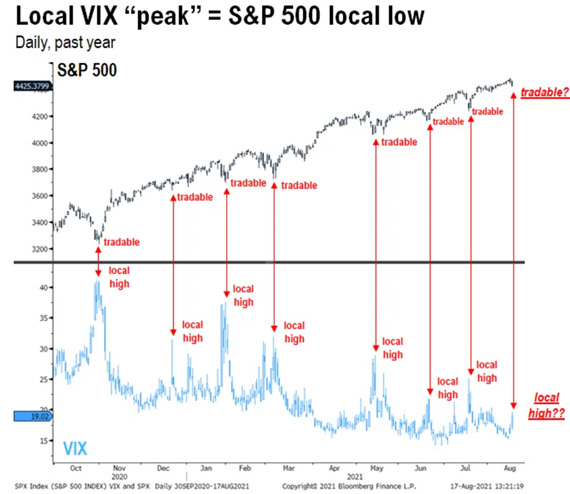
When volatility shook markets again, in August 2021 we saw the weakness in the VIX as a key sign that markets would power through the negative catalyst of the day. Volatility is also useful analytically in several other ways. We noticed that in years following anonymously high volatility that Value sectors tended to perform better. This helped give our Macro team confidence in its contrarian call on the Energy sector, which we listed as one of our favorite sectors for 2021. It ended up being the top-performing sector of the year.