


Just as soon as it appeared, the SaaS-Pocalyse started to show signs of abating by the end of the week.
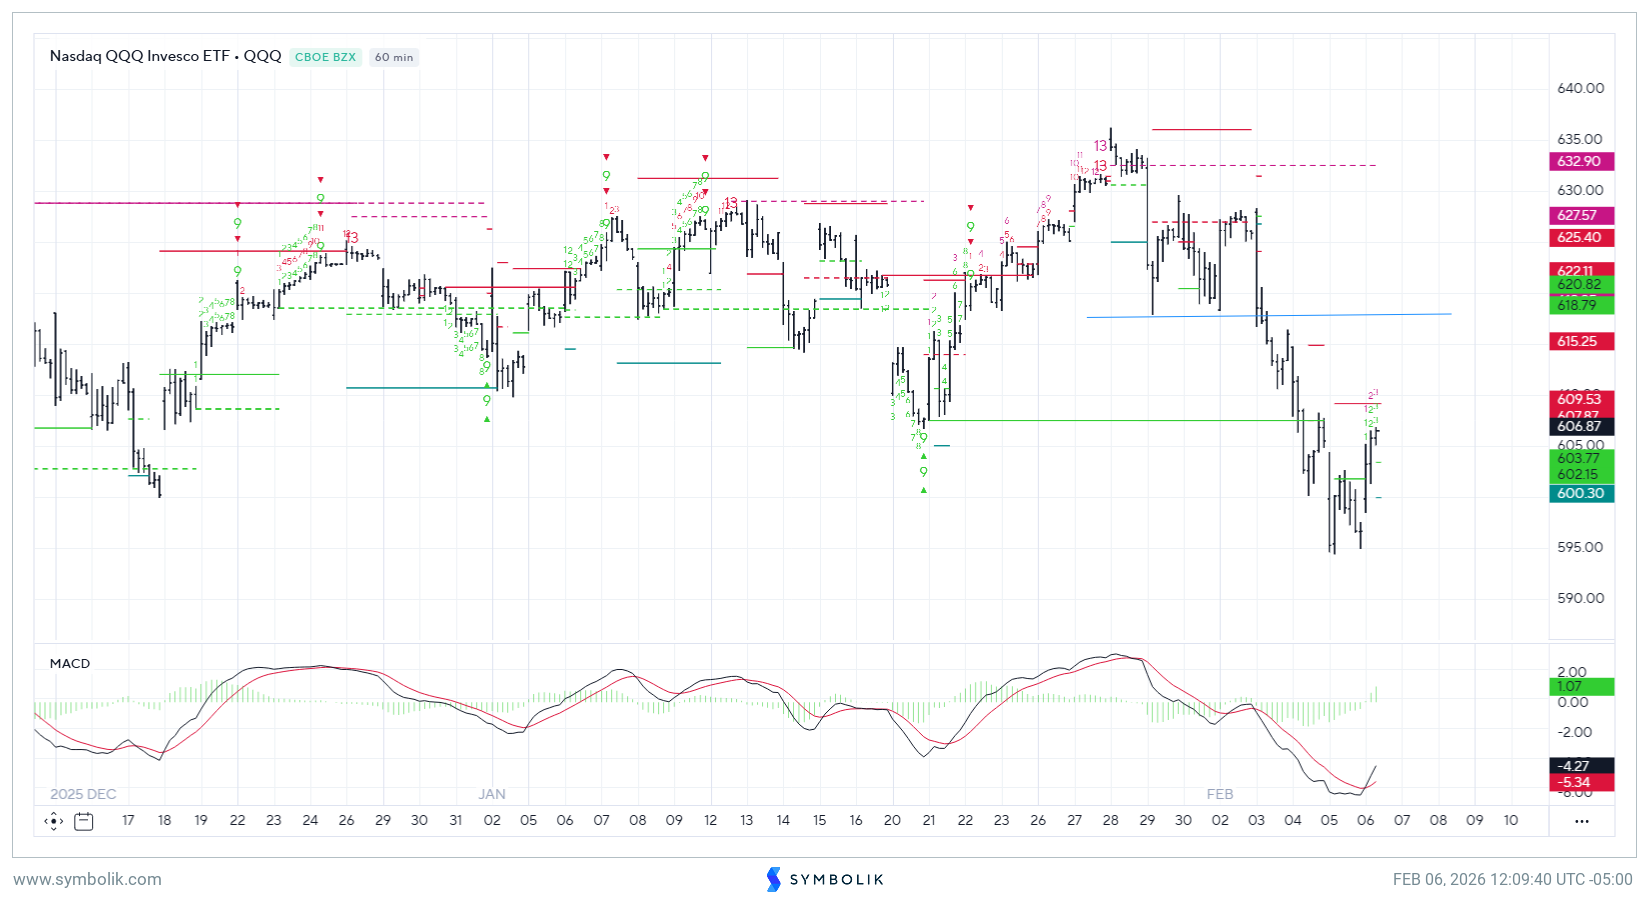
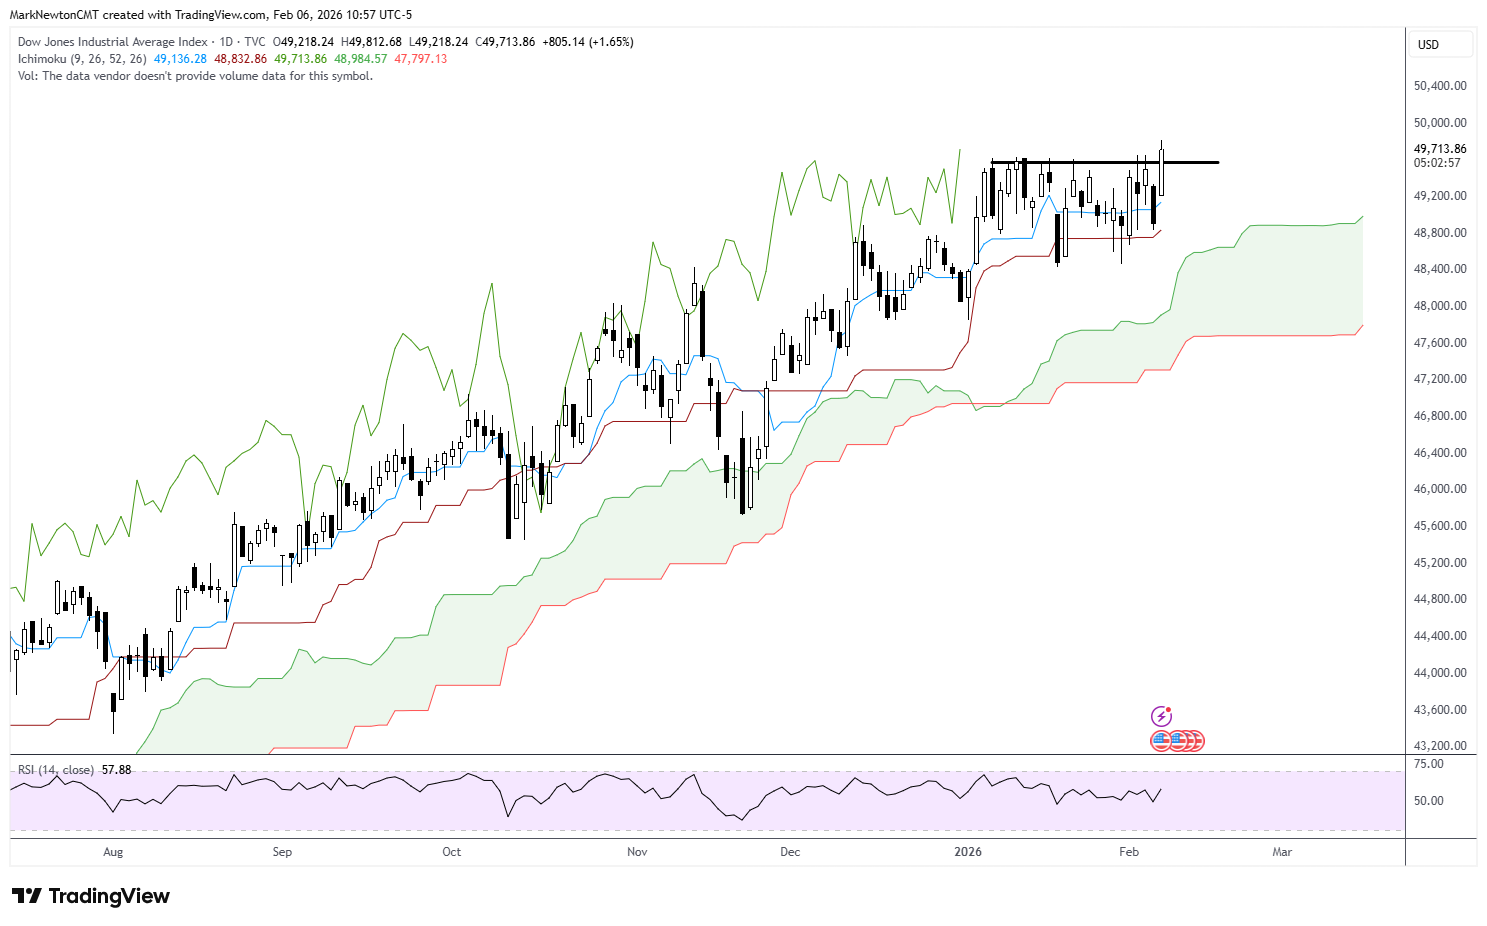
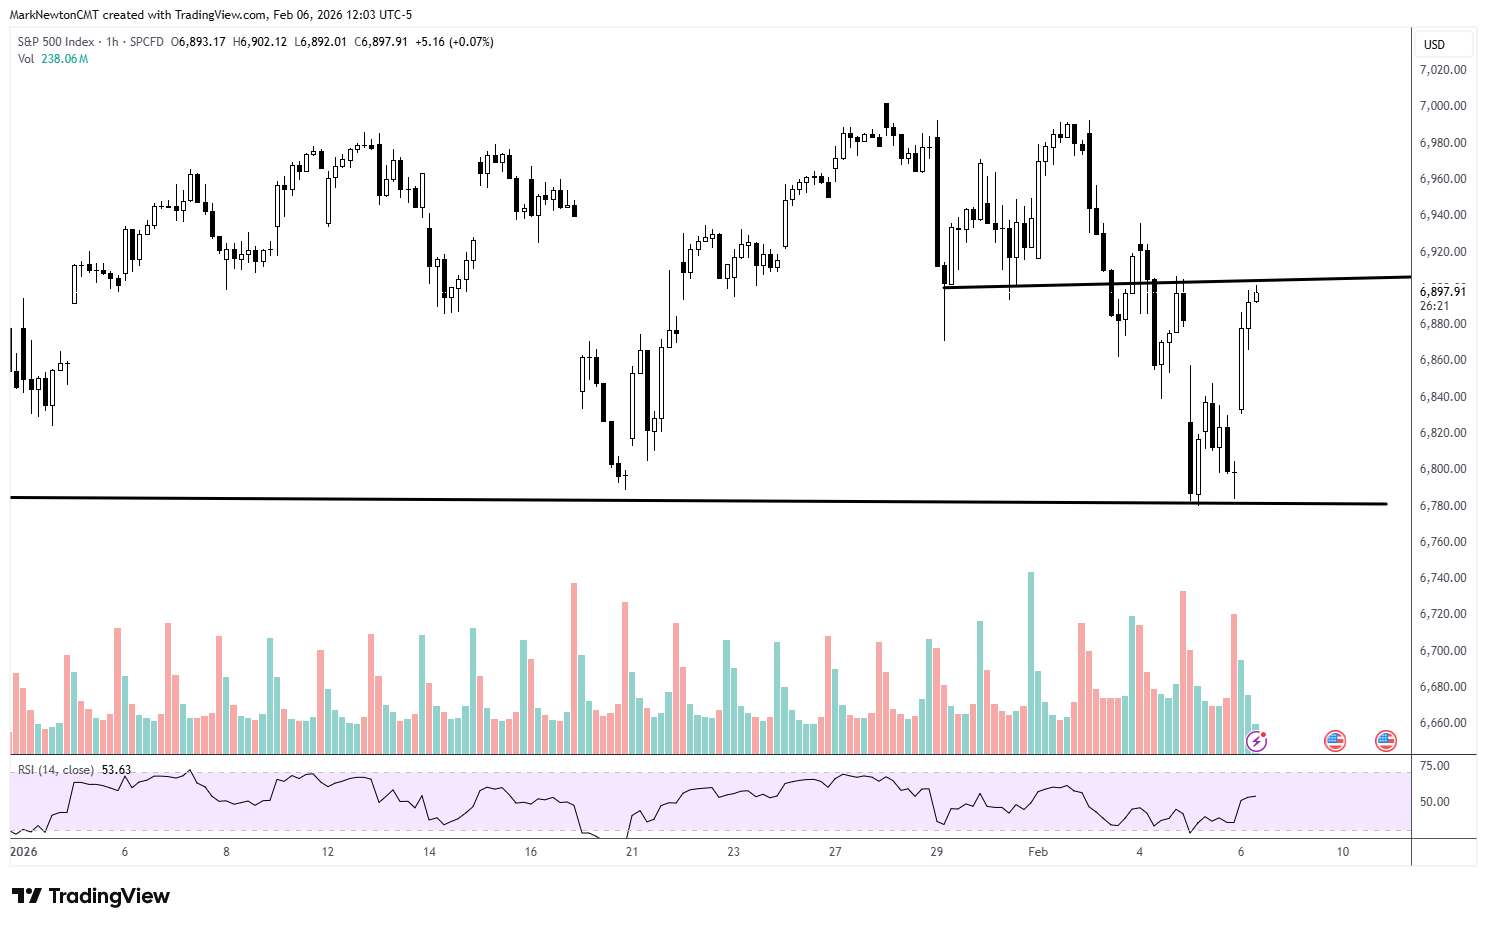
On Friday, the S&P 500 added nearly 2%, while the Dow Jones Industrial Average hurled past the 50,000 points milestone. The Nasdaq composite added 2.2%, thanks to the tech rebound. Still, that end-of-week rally wasn’t enough to stop the major indexes from posting losses for the week. The S&P 500 ticked down 0.1%, putting its annual gain at 1.3%. The Nasdaq composite slipped 1.8%, while the Dow added 2.5%.
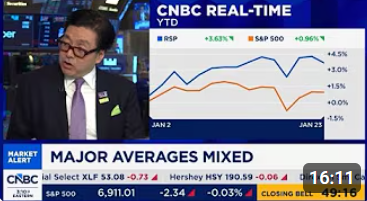
“As soon as we turned the clock to February — five days in — the market has really taken a different tone,” Fundstrat Head of Research Tom Lee said on Thursday during the Top Ideas webinar.
The magnitude of the declines mid-week surprised many investors. Few had expected that the recent release of Anthropic’s Claude Code would wreak such havoc on software stocks, which had become a fixture in the post-pandemic economy. Known for their multiyear subscription contracts and embedded nature, software stocks rose to prominence on the simple premise of “it’s too much work to switch.”
The increasing emergence of AI tools and vibe coding, however, is challenging that notion. Salesforce shares fell 9.8% this week, ServiceNow lost 14%, and Atlassian slipped 20%.
Lee said the decline in software stocks is a sign that “there is payoff from AI because it’s a lot cheaper to just use Claude than to buy software,” adding that it is a “distributional consequence.”
The carnage spread to non-software tech stocks, too, which roiled the broader stock market and left investors with few places to hide this week. Nvidia shares declined 3% this week, Meta decreased 7.7% and AMD fell 12%.
Poor earnings from Amazon, sending shares down 10% the next day, didn’t help either. The retail giant plans to increase its capex much more than last year and is still struggling to grow its cloud-computing unit.
Lee and Head of Technical Strategy Mark Newton both don’t believe that investors should sell tech just yet.
“I wouldn’t abandon tech here, but recognize that we’re getting meaningful deterioration out of software and you really have to be selective on what you own,” Newton said.
On buying the dip, he encouraged investors to exercise caution. “Many of you that love to buy the dips will say, ‘Wow it’s a bargain.’ Now, I just think you have to be really careful about jumping into software, given that it’s moved down so quickly,” he said.
Newton believes that tech will likely have one more push up. Tech against the S&P 500 has sort of broken the trend from April 2025. “Of course, we remain in a longer-term uptrend, but this does point to the fact that we could see more weakness in technology with regards to semiconductors,” he said.

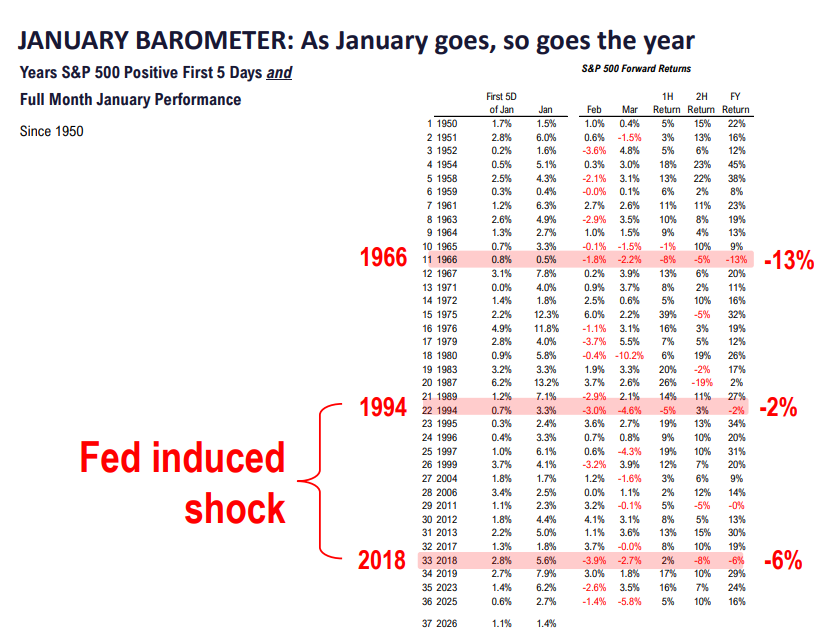
Chart of the Week

Fundstrat Head of Research Tom Lee pointed out that stocks were positive during both the first five days of the year and then during the month of January, which bodes well for stocks despite the recent SaaS-Pocalyse. Our Chart of the Week has more details on how stocks have performed historically when January has finished up.
Recent ⚡ FlashInsights

|
|
|
|
|
|
|
|
FS Insight Video: Weekly Highlight

Key incoming data
2/2 9:45 AM ET: Jan F S&P Global Manufacturing PMITame2/2 10:00 AM ET: Jan ISM Manufacturing PMITame2/4 9:45 AM ET: Jan F S&P Global Services PMITame2/4 10:00 AM ET: Jan ISM Services PMITame2/6 10:00 AM ET: Feb P U. Mich. 1yr Inf ExpTame- 2/9 11:00 AM ET: Jan NYFed 1yr Inf Exp
- 2/10 6:00 AM ET: Jan Small Business Optimism Survey
- 2/10 8:30 AM ET: Dec Retail Sales
- 2/10 8:30 AM ET: 4Q ECI QoQ
- 2/11 8:30 AM ET: Jan Core CPI MoM
- 2/12 10:00 AM ET: Jan Existing Home Sales

Stock List Performance
In the News
|
|

|

| More News Appearances |