The American Association of Individual Investors (AAII) survey showed sentiment flipping to net bullish this week – only mildly, but still putting an end to a seven-week streak of net-bearish sentiment. Coincidentally, this shift was accompanied by a slight decline in both the S&P 500 and the Nasdaq Composite.
Those two together are arguably a good thing, according to Head of Technical Strategy Mark Newton. Despite the slight AAII improvement, “overall levels of sentiment are still pretty skittish,” he told us at our weekly research huddle, “and that should support dip buying even further for a push up into probably mid to late October.”
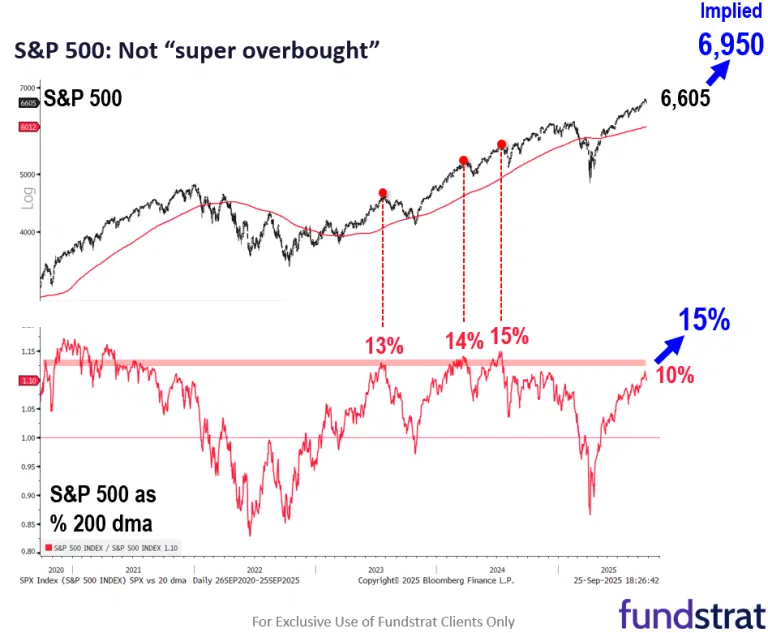
That’s a view largely shared by Fundstrat Head of Research Tom Lee, who views a “local top” as unlikely in the immediate term. Currently, the S&P 500 is 10.4% above its 200-day moving average. Yet, as Lee pointed out, since the Oct 2022 lows, we have only seen the S&P 500 make a “local top” when this figure is above 13%, for instance July 18, 2023; March 22, 2024; and July 16, 2024. (See the “Chart of the Week” below for more on this.)
Lee’s view contrasts with remarks made by Federal Reserve Chair Jerome Powell on Tuesday that put some of the week’s downward pressure on stocks. “I think if you look at some prices, then they’re elevated relative to historical levels,” Powell said during an event in Providence, R.I.
While expressing respect for Powell, Lee downplayed the significance of this view. “Please don’t see this as any ominous sign,” he recommended. After all, “when was the last time the Fed ever said stocks are ‘attractively priced’? (Hint: never).”
Chart of the Week
Assessing the likelihood of an imminent “local top,” Fundstrat’s Tom Lee observed that the S&P 500 was about 10% above its 200-day moving average as of Friday’s close. “At that level, the S&P 500 is just not that extended,” in his view. Since October 2022, local tops have occurred only when the S&P 500 is 13% or more above the 200 dma. For reference, 15% above the current 200 dma would imply a level around 6,950, consistent with Lee’s year-end target for the broad-based index.
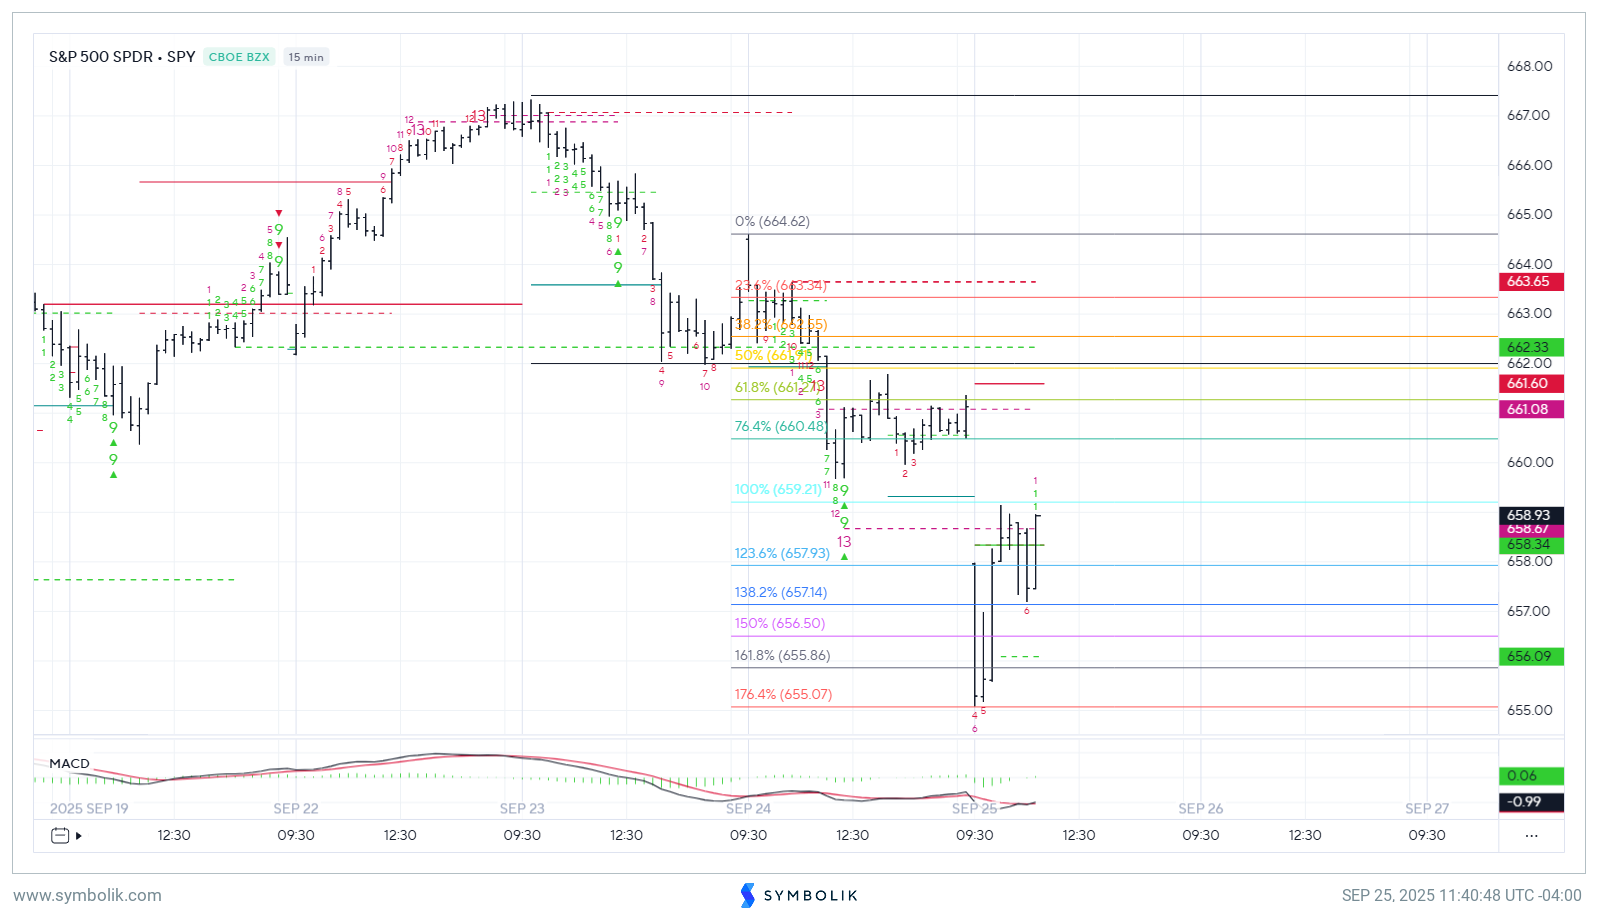
The early rebound for Equities off the lows was helpful and nearly reached 9/17 lows before turning back higher into Europe’s close. I am expecting that SPY should be bottoming technically either today or tomorrow and should begin to turn back higher to new highs into October. (Note, the ability to close well up off its lows today would add to the likelihood that today could have been the low following this three-day pullback. This intra-day SPY 0.61% chart shows that 660.49 is the key level to break this week’s minor downtrend, and recouping the area from the open gap would be quite helpful towards establishing a low today into tomorrow. I’ll monitor as the day progresses, but an early good sign for a sharp rebound off the lows after having reached nearly an exact 100% projection of the 9/22-9/23 initial drop from this week’s highs.
Chances of US government shutdown increased as President Trump cancels proposed Thursday meeting with Congressional Democratic leaders Schumer and Jeffries. Today no talks are scheduled.
Fed Chair Powell spoke at a conference today and this one comment unnerved some investors Powell: “I think if you look at some prices, then they’re elevated relative to historical levels … we’re not targeting any level of prices for particular financial assets. We don’t have a view that we know what the right price of any particular financial asset is. We do look at overall financial conditions. And we we ask ourselves whether our our policies are affecting financial conditions … for example, equity prices are fairly highly valued.” Our take: When was the last time the Fed ever said stocks are “attractively priced”? (Hint: never) Please don’t see this as any ominous sign
This research is for the clients of FS Insight only. FSI Subscription entitles the subscriber to 1 user, research cannot be shared or redistributed. For additional information, please contact your sales representative or FS Insight at fsinsight.com.
Conflicts of Interest
This research contains the views, opinions and recommendations of FS Insight. At the time of publication of this report, FS Insight does not know of, or have reason to know of any material conflicts of interest.
General Disclosures
FS Insight is an independent research company and is not a registered investment advisor and is not acting as a broker dealer under any federal or state securities laws.
FS Insight is a member of IRC Securities’ Research Prime Services Platform. IRC Securities is a FINRA registered broker-dealer that is focused on supporting the independent research industry. Certain personnel of FS Insight (i.e. Research Analysts) are registered representatives of IRC Securities, a FINRA member firm registered as a broker-dealer with the Securities and Exchange Commission and certain state securities regulators. As registered representatives and independent contractors of IRC Securities, such personnel may receive commissions paid to or shared with IRC Securities for transactions placed by FS Insight clients directly with IRC Securities or with securities firms that may share commissions with IRC Securities in accordance with applicable SEC and FINRA requirements. IRC Securities does not distribute the research of FS Insight, which is available to select institutional clients that have engaged FS Insight.
As registered representatives of IRC Securities our analysts must follow IRC Securities’ Written Supervisory Procedures. Notable compliance policies include (1) prohibition of insider trading or the facilitation thereof, (2) maintaining client confidentiality, (3) archival of electronic communications, and (4) appropriate use of electronic communications, amongst other compliance related policies.
FS Insight does not have the same conflicts that traditional sell-side research organizations have because FS Insight (1) does not conduct any investment banking activities, and (2) does not manage any investment funds.
This communication is issued by FS Insight and/or affiliates of FS Insight. This is not a personal recommendation, nor an offer to buy or sell nor a solicitation to buy or sell any securities, investment products or other financial instruments or services. This material is distributed for general informational and educational purposes only and is not intended to constitute legal, tax, accounting or investment advice.
The statements in this document shall not be considered as an objective or independent explanation of the matters. Please note that this document (a) has not been prepared in accordance with legal requirements designed to promote the independence of investment research, and (b) is not subject to any prohibition on dealing ahead of the dissemination or publication of investment research.
Intended for recipient only and not for further distribution without the consent of FS Insight.
This research is for the clients of FS Insight only. Additional information is available upon request. Information has been obtained from sources believed to be reliable, but FS Insight does not warrant its completeness or accuracy except with respect to any disclosures relative to FS Insight and the analyst’s involvement (if any) with any of the subject companies of the research. All pricing is as of the market close for the securities discussed, unless otherwise stated. Opinions and estimates constitute our judgment as of the date of this material and are subject to change without notice. Past performance is not indicative of future results. This material is not intended as an offer or solicitation for the purchase or sale of any financial instrument. The opinions and recommendations herein do not take into account individual client circumstances, risk tolerance, objectives, or needs and are not intended as recommendations of particular securities, financial instruments or strategies. The recipient of this report must make its own independent decision regarding any securities or financial instruments mentioned herein. Except in circumstances where FS Insight expressly agrees otherwise in writing, FS Insight is not acting as a municipal advisor and the opinions or views contained herein are not intended to be, and do not constitute, advice, including within the meaning of Section 15B of the Securities Exchange Act of 1934. All research reports are disseminated and available to all clients simultaneously through electronic publication to our internal client website, fsinsight.com. Not all research content is redistributed to our clients or made available to third-party aggregators or the media. Please contact your sales representative if you would like to receive any of our research publications.