Stocks are posting records after records in a defiance of the typically negative September seasonality.
The S&P 500 rose 1.6% to 6,584.29 points, putting it on course to gain 1.9% this month. If it holds onto that to finish the month, it’d be the second consecutive September it’s risen, which would mark the longest winning streak since the one ending in 2019 that logged gains for three straight Septembers.
A big reason for the increase? Labor market data came in soft, while inflation data wasn’t too hot, giving investors and likely the Federal Reserve, too, confidence that interest rates can be brought down as soon as next week.
Earlier in the week, an annual revision to the jobs number showed that the U.S. economy overstated jobs by 911,000 over the 12-month period ending in March. Then on Thursday, the initial jobless claims number rose to its highest level since October 2021.
While both of those reports signal that the job market is in a precarious position, it’s also overwhelmingly “dovish” for the Fed’s next move, according to Fundstrat Head of Research Tom Lee, which helps support his “nonconsensus view that September will be an up month.”
The headline and core number in the August wholesale inflation report on Wednesday both came in lower than expected. The monthly consumer-price index report the following day came in hotter-than expected for the headline number, rising 0.3% from a month ago compared to expectations of a 0.2% increase.
Lee added, “I actually don’t think this report is as bad as it looks on paper.” He doesn’t think that the CPI number numbers signal the start of “another wave of inflation.”
In corporate news, Oracle posted an eye-popping gain of 36% on Wednesday after reporting earnings that showed it expects to collect over $450 billion in revenue, mostly from OpenAI. The jump is a testament to how fast Oracle has caught up in the AI race.
“I just think that AI stocks are undervalued. How else do you explain Oracle rising as much as it did?” Lee said. He reaffirmed his view that stocks remain in a bull market.
Head of Technical Strategy Mark Newton said that “it’s a great market right now,” but added that “it’s largely tech,” which is a little worrying because it’s better for the longevity of the rally when stocks from different sectors participate.
“It’s tough to find too much fault just yet, but there has been a little bit of a breadth drop-off in recent weeks,” he said. “The key in my mind is, when does the weak data stop serving as a positive for equities?”
Chart of the Week
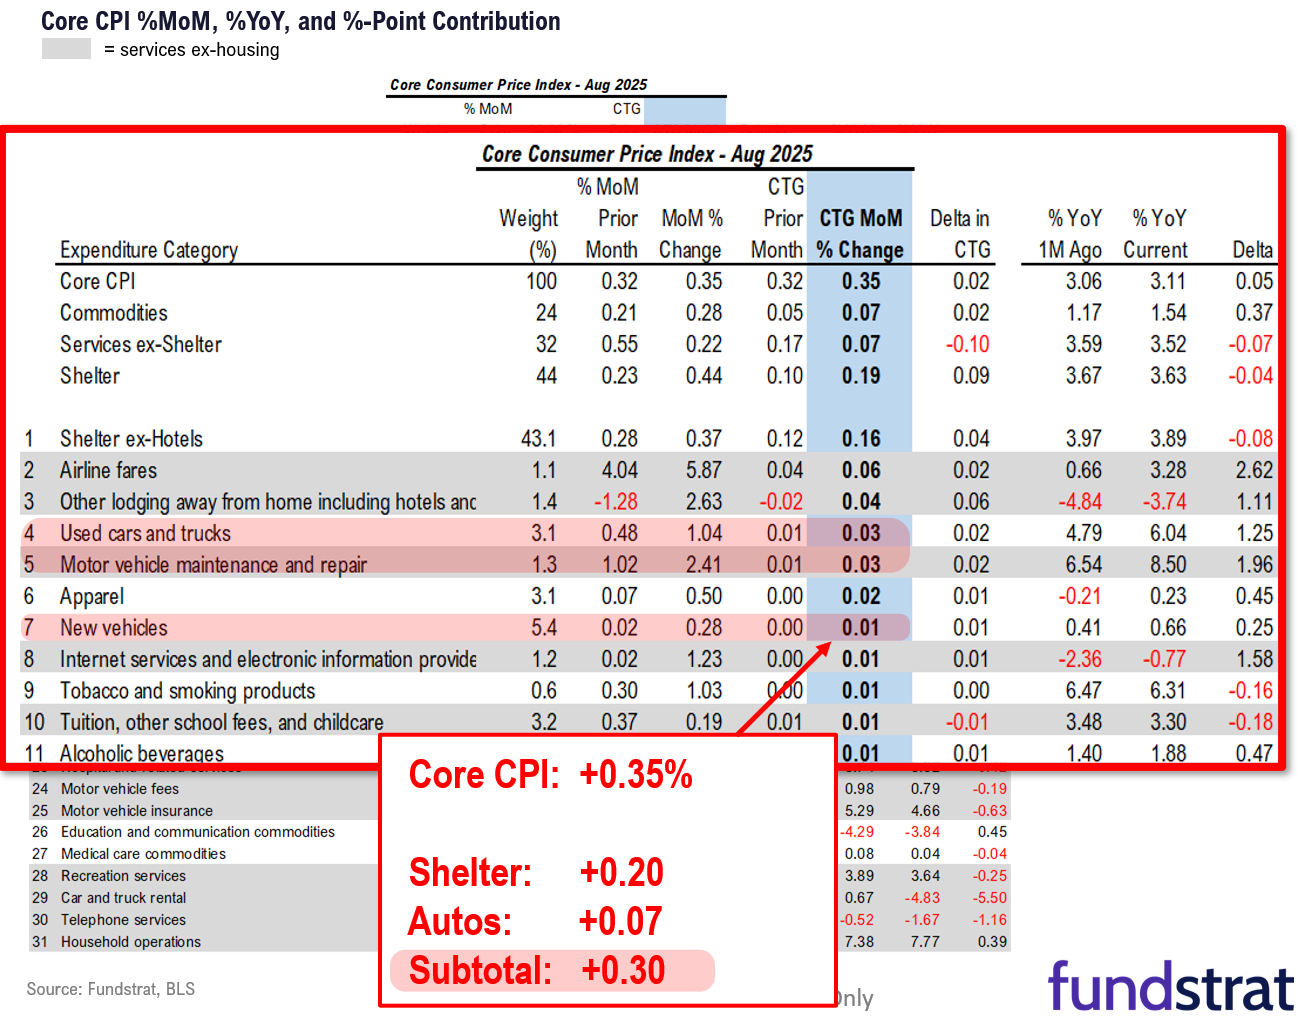
The reason why Lee thinks the inflation report doesn’t look too bad is because he focuses on core inflation—which excludes the volatile food and energy components. That number came in line with expectations of a 0.3% increase from a month ago and 3.1% from a year ago. Lee pointed out that shelter and autos were a big contributor to monthly increase in core CPI , as shown in the Chart of the Week. He recommended investors to “take a step back and think about how much of shelter and autos is tariffs-related?”
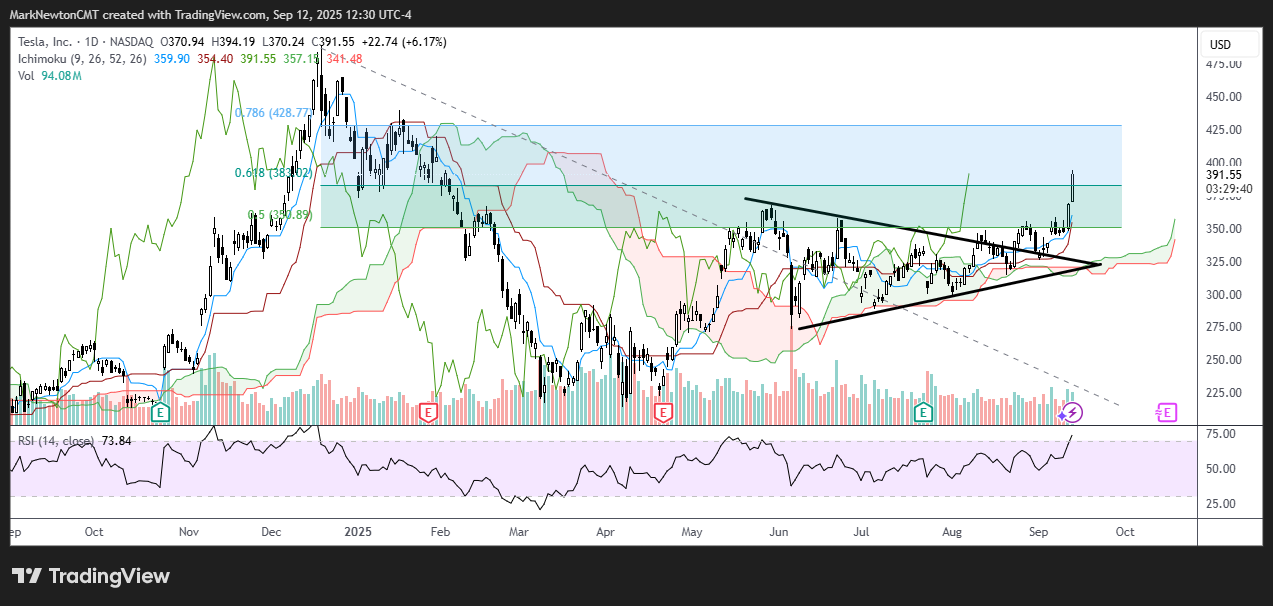
TSLA 7.35% breakout from Aug. 25th has now begun to accelerate higher over the last two days with two big low to high ranges on above-average volume. Near-term resistance looks likely in about 3-5 trading days at a level of either 407-8, or above near 420-5 before some consolidation to this large move. However, technical trends have been getting stronger in the last month, and it’s likely that following some backing and filling, TSLA can work its way higher in October given the bullish influence of cycles for this stock (shown a few weeks ago for 2H 2025) Overall, this week’s price action is very good news technically for TSLA and this remains a holding within UPTICKS Following some consolidation post FOMC, i expect TSLA should begin its move to testing all-time highs near $488
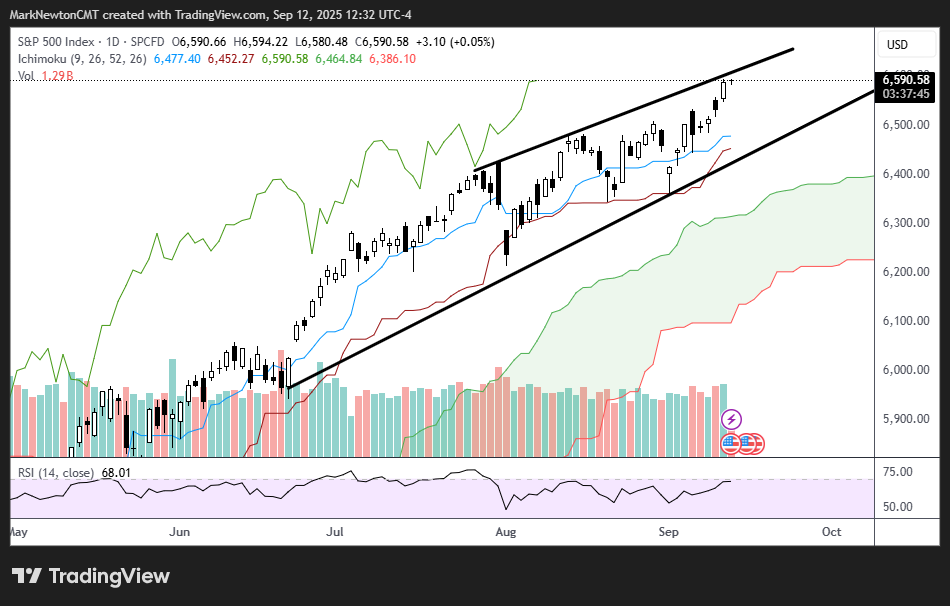
^SPX has the potential for five days higher this week, with three straight record closes. SPX’s fractional gains today make sense given that price has pushed up to highs of this recent trend channel ahead of next week’s FOMC meeting, and the combination of a large Options positioning for September (Based on data from SpotGamma) along with price up near 6600 near the channel resistance highs might make an immediate breakout above 6600 unlikely. However, some of the negatives from July into August with regards to lower market breadth and Technology weakness have improved in the last couple weeks, while negativity continues (AAII Sentiment from yesterday showed nearly 21 points of spread between Bears and Bulls while SpotGamma says that hedging demand is continuing with elevated Put skews and investors positioning into downside Spreads. I feel like a stalling out makes sense next week, but pullbacks would be unlikely to break this lower end of this trend channel before pushing up into October. Resistance lies at 6600 while support is found between 6450-6500
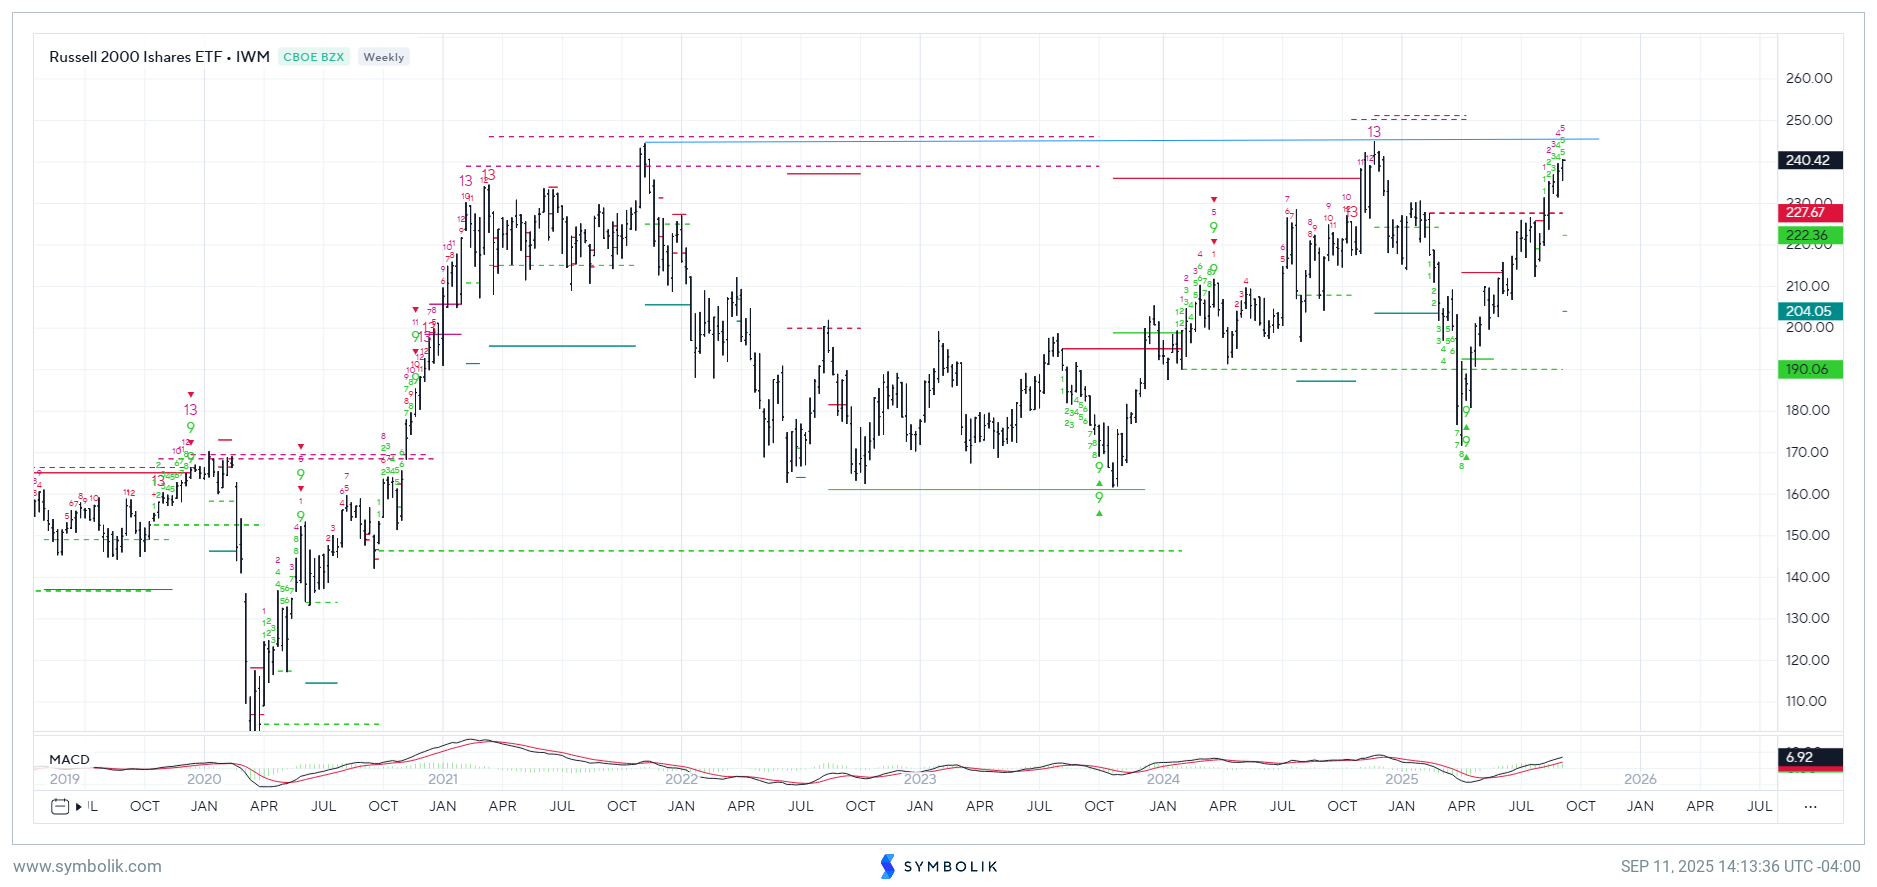
IWM -1.02% Small-cap ETF is up +1.7% today, surpassing SPX performance by nearly 90 basis points. Price is likely to push up to $245 without much trouble, but that area does look quite important into October given that it represented both 2024 and 2021 peaks. DeMark weekly indicators could be in position to show TD Sell Setups within 3-4 weeks, and i expect that October likely brings about a stalling out after this run-up. This week has brought about continued success in Small-cap outperformance, and this looks to continue in the months ahead, with December/January possibly resulting in a stall out
This research is for the clients of FS Insight only. FSI Subscription entitles the subscriber to 1 user, research cannot be shared or redistributed. For additional information, please contact your sales representative or FS Insight at fsinsight.com.
Conflicts of Interest
This research contains the views, opinions and recommendations of FS Insight. At the time of publication of this report, FS Insight does not know of, or have reason to know of any material conflicts of interest.
General Disclosures
FS Insight is an independent research company and is not a registered investment advisor and is not acting as a broker dealer under any federal or state securities laws.
FS Insight is a member of IRC Securities’ Research Prime Services Platform. IRC Securities is a FINRA registered broker-dealer that is focused on supporting the independent research industry. Certain personnel of FS Insight (i.e. Research Analysts) are registered representatives of IRC Securities, a FINRA member firm registered as a broker-dealer with the Securities and Exchange Commission and certain state securities regulators. As registered representatives and independent contractors of IRC Securities, such personnel may receive commissions paid to or shared with IRC Securities for transactions placed by FS Insight clients directly with IRC Securities or with securities firms that may share commissions with IRC Securities in accordance with applicable SEC and FINRA requirements. IRC Securities does not distribute the research of FS Insight, which is available to select institutional clients that have engaged FS Insight.
As registered representatives of IRC Securities our analysts must follow IRC Securities’ Written Supervisory Procedures. Notable compliance policies include (1) prohibition of insider trading or the facilitation thereof, (2) maintaining client confidentiality, (3) archival of electronic communications, and (4) appropriate use of electronic communications, amongst other compliance related policies.
FS Insight does not have the same conflicts that traditional sell-side research organizations have because FS Insight (1) does not conduct any investment banking activities, and (2) does not manage any investment funds.
This communication is issued by FS Insight and/or affiliates of FS Insight. This is not a personal recommendation, nor an offer to buy or sell nor a solicitation to buy or sell any securities, investment products or other financial instruments or services. This material is distributed for general informational and educational purposes only and is not intended to constitute legal, tax, accounting or investment advice.
The statements in this document shall not be considered as an objective or independent explanation of the matters. Please note that this document (a) has not been prepared in accordance with legal requirements designed to promote the independence of investment research, and (b) is not subject to any prohibition on dealing ahead of the dissemination or publication of investment research.
Intended for recipient only and not for further distribution without the consent of FS Insight.
This research is for the clients of FS Insight only. Additional information is available upon request. Information has been obtained from sources believed to be reliable, but FS Insight does not warrant its completeness or accuracy except with respect to any disclosures relative to FS Insight and the analyst’s involvement (if any) with any of the subject companies of the research. All pricing is as of the market close for the securities discussed, unless otherwise stated. Opinions and estimates constitute our judgment as of the date of this material and are subject to change without notice. Past performance is not indicative of future results. This material is not intended as an offer or solicitation for the purchase or sale of any financial instrument. The opinions and recommendations herein do not take into account individual client circumstances, risk tolerance, objectives, or needs and are not intended as recommendations of particular securities, financial instruments or strategies. The recipient of this report must make its own independent decision regarding any securities or financial instruments mentioned herein. Except in circumstances where FS Insight expressly agrees otherwise in writing, FS Insight is not acting as a municipal advisor and the opinions or views contained herein are not intended to be, and do not constitute, advice, including within the meaning of Section 15B of the Securities Exchange Act of 1934. All research reports are disseminated and available to all clients simultaneously through electronic publication to our internal client website, fsinsight.com. Not all research content is redistributed to our clients or made available to third-party aggregators or the media. Please contact your sales representative if you would like to receive any of our research publications.