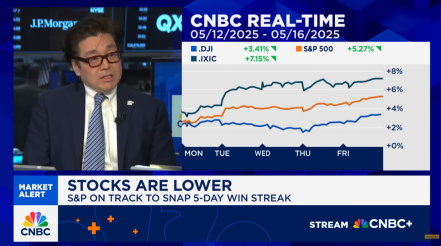
Stocks lost momentum after Middle East tensions flared up Friday, reversing gains from earlier in the week. The S&P 500 tumbled 0.4% this week, with seven of the 11 sectors declining. The slide was led by the financials and industrials sectors, down 2.6% and 1.6%, respectively.
The index’s loss would be bigger if not for the energy sector’s 5.7% gain this week, the largest outperformer. Oil prices were steadily jumping higher all week long due to worries about rising tensions in the Middle East. Those fears came true Thursday night when Israel launched a series of airstrikes against Iran, rattling global markets the next trading day. A prolonged conflict could disrupt key oil infrastructure in the region.
On Friday, investors retreated from risky assets. Haven asset gold rallied 3.2% while Bitcoin fell 0.7%. Wall Street’s fear gauge, VIX, spiked 4.4% to 18, signaling rising anxiety.
On the other hand, tech stocks, which have led the S&P 500’s recovery since the April 8 low, took a breather this week. The information technology sector—home to the likes of Apple and Nvidia—and communication-services sector—which includes Alphabet and Meta Platforms—fell less than 0.1% and 0.8%, respectively, this week.
Fundstrat Head of Technical Strategy Mark Newton said he doesn’t make too much of tech’s recent pause. “Tech is hitting a brick wall. They’re likely tired after this fast move up so they need to do some backing and filling, but there’s no new structural change,” he said. Given their outsized weight in the major indexes, tech stocks play a crucial role in driving the direction of the broader market.
Even with the latest worries, Head of Research Tom Lee believes that stocks continue to be “bid up every day.” He added that, “We have long written that war events have human consequences, and of course, dominate headlines. But they have a little impact on equity markets, medium and long term.” The S&P 500 remains 2.7% off from all-time highs.
“I still get questions from clients saying, ‘Tom, when are you going to turn bearish?’ It comes up on every Zoom [call],” said Lee in one of his Macro Minute videos. “But to me, that’s a contrarian bullish signal because when people think that they’re looking for top, that means they’re not positioned positively.”
CPI and PPI reports released during the week further solidified hopes that inflation is slowing down and moving down toward the Federal Reserve’s target of 2%. “Inflation is falling like a rock, and that’s the real signal. Tariffs are somewhat auxiliary to that,” Lee said.
Newton remains optimistic about this summer. He had initially thought that June would be the pivotal month where we see some big moves, but now it looks like that has been pushed out to July.
“The rally is still intact and ongoing,” he said.
Chart of the Week
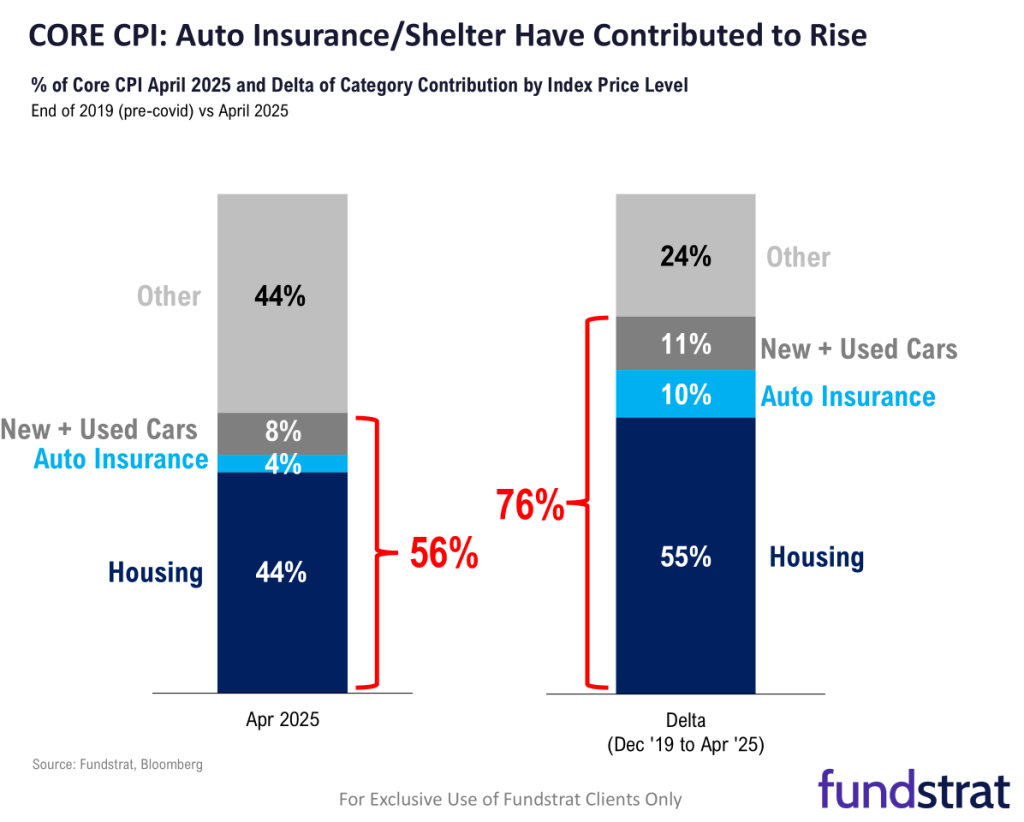
On Wednesday, the consumer-price index’s headline inflation for May edged 0.1% higher from a month ago and 2.4% from a year ago. Core CPI—which excludes the volatile food and energy components—rose 0.1% from a month ago and 2.8% from a year ago. The biggest decline was led by housing, without which there’d be negative inflation for the month, Fundstrat Head of Research Tom Lee said. In the index, housing contributes to 55% of inflation, while housing and auto-services together compose 76% of the index. “If shelter is cooling, the market is going to conclude that inflation is cooling,” Lee said.
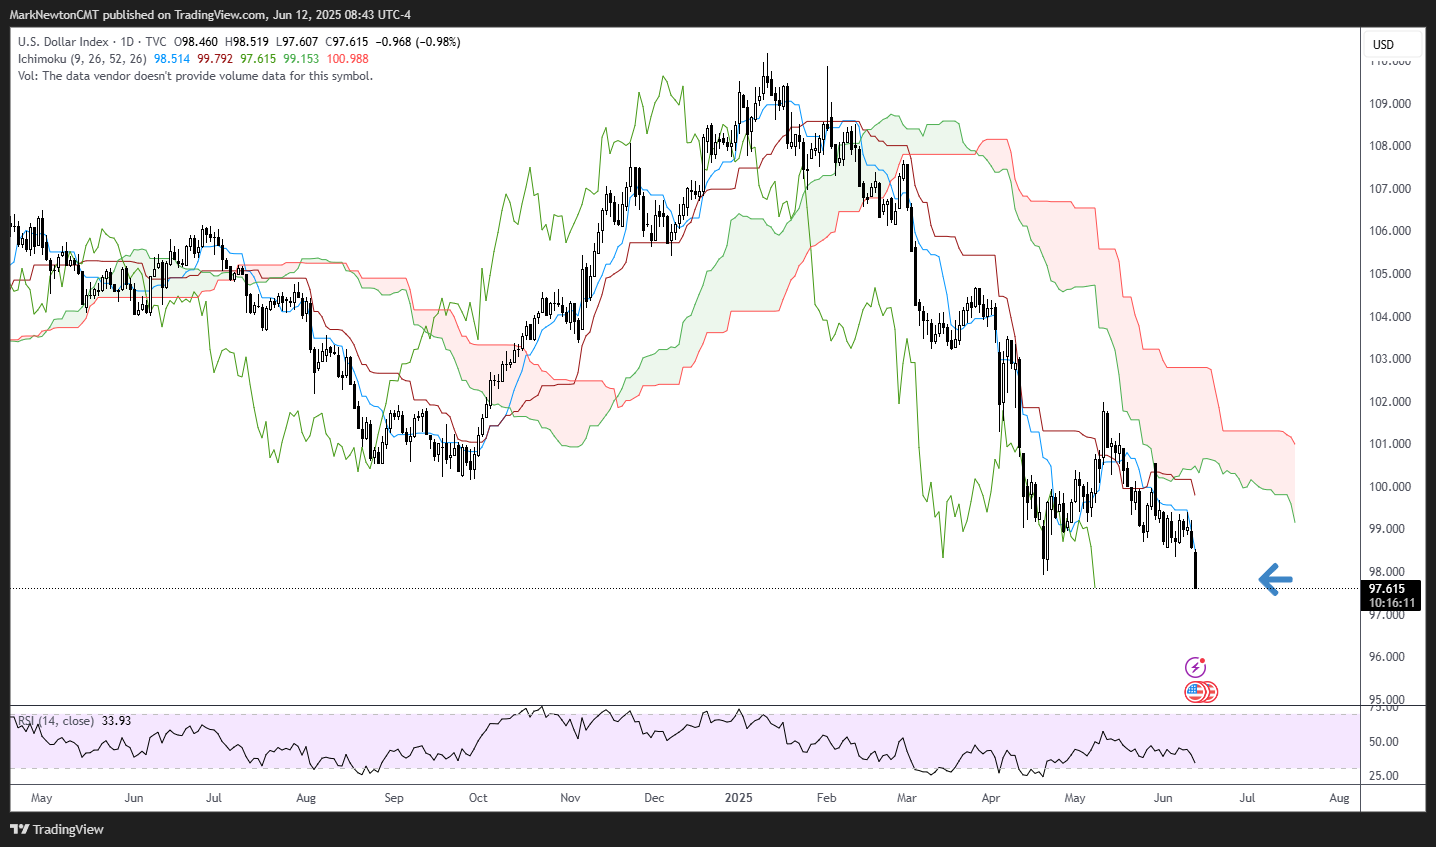
Biggest technical development this morning is the giant decline in DXY – the US Dollar index which is heavily weighted from Euro. DXY has declined more than 8% since the end of 2024, the worst start to a year since 2005. This has become largely a consensus trade, and sentiment is starting to get very negative on DXY. While this might lessen the extent that the US Dollar could fall, the risk is that this selling pressure could prove self-reinforcing if large investors continue to hedge more of their Dollar exposure. This move directly does play into the Administration’s playbook, as the cost of imports is raised and exports cheapened in a way that can help the Deficit
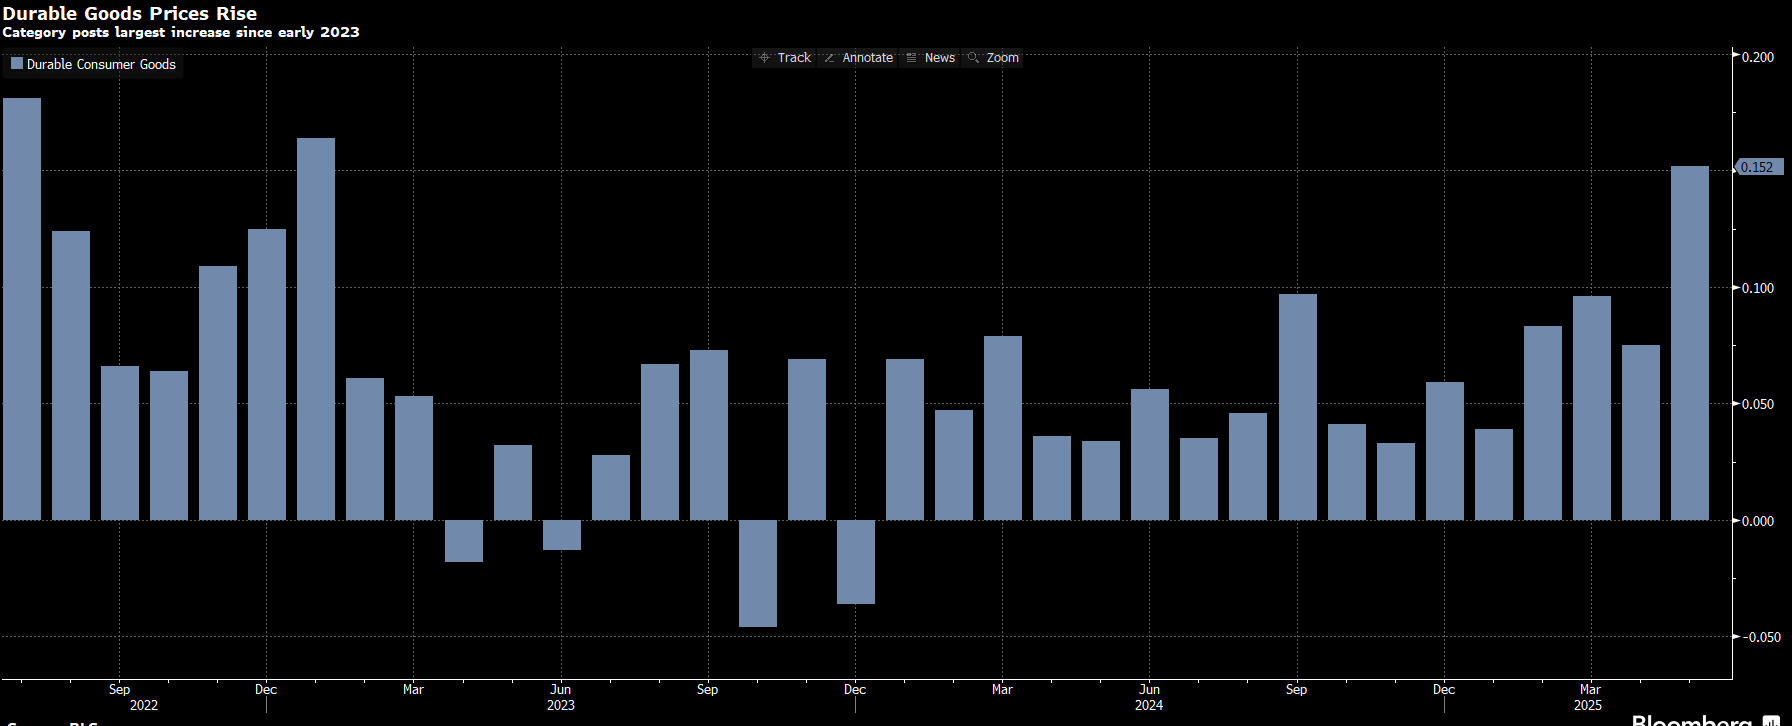
Today’s PPI came in 0.1% vs. 0.3% exptd (EX food and energy MoM) and pleasantly surprised similar to CPI yesterday. However, Core goods rose and were the main source of price pressures in May, suggesting that companies may be eating some of the added costs from Tariffs. Also the face that PPI still exceeds CPI could hint at pressures on corporate margins as Core goods are a source of disinflation in Consumer prices but a source of inflation in producer prices. Thus Equities have bounced ever so slightly from overnight losses, but the US dollar has dropped to 3 year lows via DXY and yields are also dropping sharply (which i assume might prove short-lived)
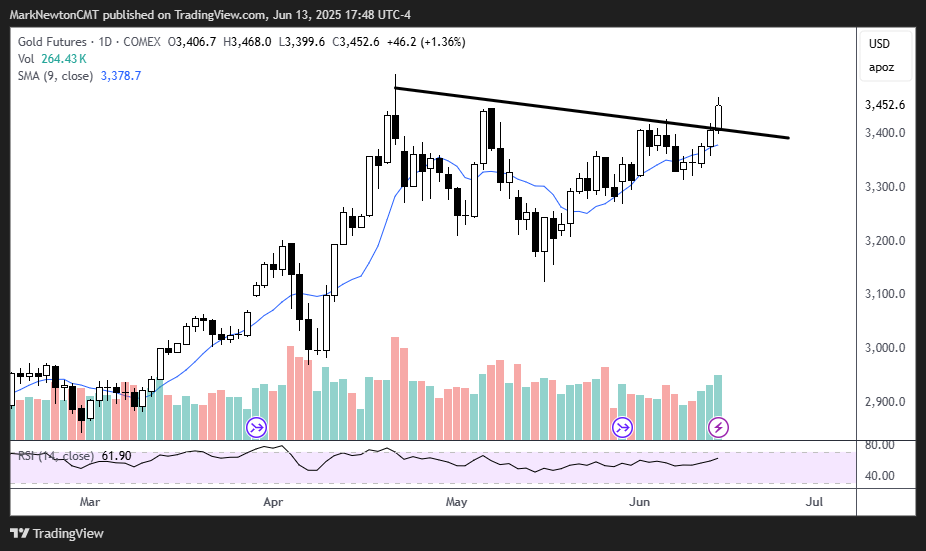
The most significant move for Friday’s trading, technically speaking, involved Gold’s breakout of the minor resistance connecting highs over the last couple months. This makes perfect sense given the dramatic uptick in geopolitical tension, along with the swaps market starting to price in more interest rate cuts (For now, the market is pricing in nearly 3 cuts by next March and is slightly ahead of the FOMC in this regard) Bottom line, Gold is bullish here, and should be starting its push up to 3800. While both G N/A% old and Silver look attractive, Gold has taken the lead this week in its most recent breakout, and i feel technically that both are appealing. GLD 1.31% , IAU 1.30% are ETF”s which track Gold’s price action, while GDX 1.92% and NUGT are ETF’s which are based on Gold Miners. Both Gold and the Gold Miners are technically attractive in the near-term and intermediate-term.
This research is for the clients of FS Insight only. FSI Subscription entitles the subscriber to 1 user, research cannot be shared or redistributed. For additional information, please contact your sales representative or FS Insight at fsinsight.com.
Conflicts of Interest
This research contains the views, opinions and recommendations of FS Insight. At the time of publication of this report, FS Insight does not know of, or have reason to know of any material conflicts of interest.
General Disclosures
FS Insight is an independent research company and is not a registered investment advisor and is not acting as a broker dealer under any federal or state securities laws.
FS Insight is a member of IRC Securities’ Research Prime Services Platform. IRC Securities is a FINRA registered broker-dealer that is focused on supporting the independent research industry. Certain personnel of FS Insight (i.e. Research Analysts) are registered representatives of IRC Securities, a FINRA member firm registered as a broker-dealer with the Securities and Exchange Commission and certain state securities regulators. As registered representatives and independent contractors of IRC Securities, such personnel may receive commissions paid to or shared with IRC Securities for transactions placed by FS Insight clients directly with IRC Securities or with securities firms that may share commissions with IRC Securities in accordance with applicable SEC and FINRA requirements. IRC Securities does not distribute the research of FS Insight, which is available to select institutional clients that have engaged FS Insight.
As registered representatives of IRC Securities our analysts must follow IRC Securities’ Written Supervisory Procedures. Notable compliance policies include (1) prohibition of insider trading or the facilitation thereof, (2) maintaining client confidentiality, (3) archival of electronic communications, and (4) appropriate use of electronic communications, amongst other compliance related policies.
FS Insight does not have the same conflicts that traditional sell-side research organizations have because FS Insight (1) does not conduct any investment banking activities, and (2) does not manage any investment funds.
This communication is issued by FS Insight and/or affiliates of FS Insight. This is not a personal recommendation, nor an offer to buy or sell nor a solicitation to buy or sell any securities, investment products or other financial instruments or services. This material is distributed for general informational and educational purposes only and is not intended to constitute legal, tax, accounting or investment advice.
The statements in this document shall not be considered as an objective or independent explanation of the matters. Please note that this document (a) has not been prepared in accordance with legal requirements designed to promote the independence of investment research, and (b) is not subject to any prohibition on dealing ahead of the dissemination or publication of investment research.
Intended for recipient only and not for further distribution without the consent of FS Insight.
This research is for the clients of FS Insight only. Additional information is available upon request. Information has been obtained from sources believed to be reliable, but FS Insight does not warrant its completeness or accuracy except with respect to any disclosures relative to FS Insight and the analyst’s involvement (if any) with any of the subject companies of the research. All pricing is as of the market close for the securities discussed, unless otherwise stated. Opinions and estimates constitute our judgment as of the date of this material and are subject to change without notice. Past performance is not indicative of future results. This material is not intended as an offer or solicitation for the purchase or sale of any financial instrument. The opinions and recommendations herein do not take into account individual client circumstances, risk tolerance, objectives, or needs and are not intended as recommendations of particular securities, financial instruments or strategies. The recipient of this report must make its own independent decision regarding any securities or financial instruments mentioned herein. Except in circumstances where FS Insight expressly agrees otherwise in writing, FS Insight is not acting as a municipal advisor and the opinions or views contained herein are not intended to be, and do not constitute, advice, including within the meaning of Section 15B of the Securities Exchange Act of 1934. All research reports are disseminated and available to all clients simultaneously through electronic publication to our internal client website, fsinsight.com. Not all research content is redistributed to our clients or made available to third-party aggregators or the media. Please contact your sales representative if you would like to receive any of our research publications.