Is the bottom in? Fundstrat Head of Research Tom Lee thinks so, putting the odds of that possibility at 90%. A confirmed bottom would certainly be a relief to most investors: Lee described the three weeks since April 2 (which President Trump had termed “Liberation Day”) as “the most difficult we have navigated in 30 years, more so than even Covid and the 2008 Global Financial Crisis.”
However, after peaking above 60 on April 8, the VIX has receded to around 25 (as of Friday close), and last Tuesday we saw another day in which over 90% of NYSE shares advanced. That followed a similar day of strong advances on April 9, when 94% of shares rose. This pattern is particularly noteworthy: Fundstrat’s Data Science team found just three historical precedents since 1979 in which NYSE percentage advances matched or exceeded the 90% mark twice within a nine-day period (March 10, 2009, Aug. 9, 2011, and April 6, 2020). In all three instances, S&P 500 forward returns were generally positive, with a 100% win ratio three, six, and 12 months later.
Much of last week’s gangbuster gains (the S&P 500 rose 4.59% while the Nasdaq surged 6.73%) were driven by what Lee calls “positive policy shock.” These include Trump walking back earlier comments that had suggested he might look for a way to fire Federal Reserve Chief Jerome Powell. Lee had previously described firing Powell as a move that “would deal a severe blow to investor confidence in the U.S. financial system.”
On the tariffs front, markets also appeared to view remarks by Trump and White House officials as de-escalatory. Trump told Time magazine that “we’re meeting with China” (though Chinese officials disputed this claim), while Treasury Secretary Scott Bessent described U.S.-China tensions as “an opportunity for a big deal” and eschewed the phrase “trade war” in favor of a gentler trade “rebalance.”
Yet both Lee and Head of Technical Strategy Mark Newton continue to urge caution. Although Newton sees the possibility that “we rally sharply for about a week,” he warned that “I do think that [choppiness] continues,” emphasizing that “I don’t think it’s going to be a straight shot higher.”
Chart of the Week
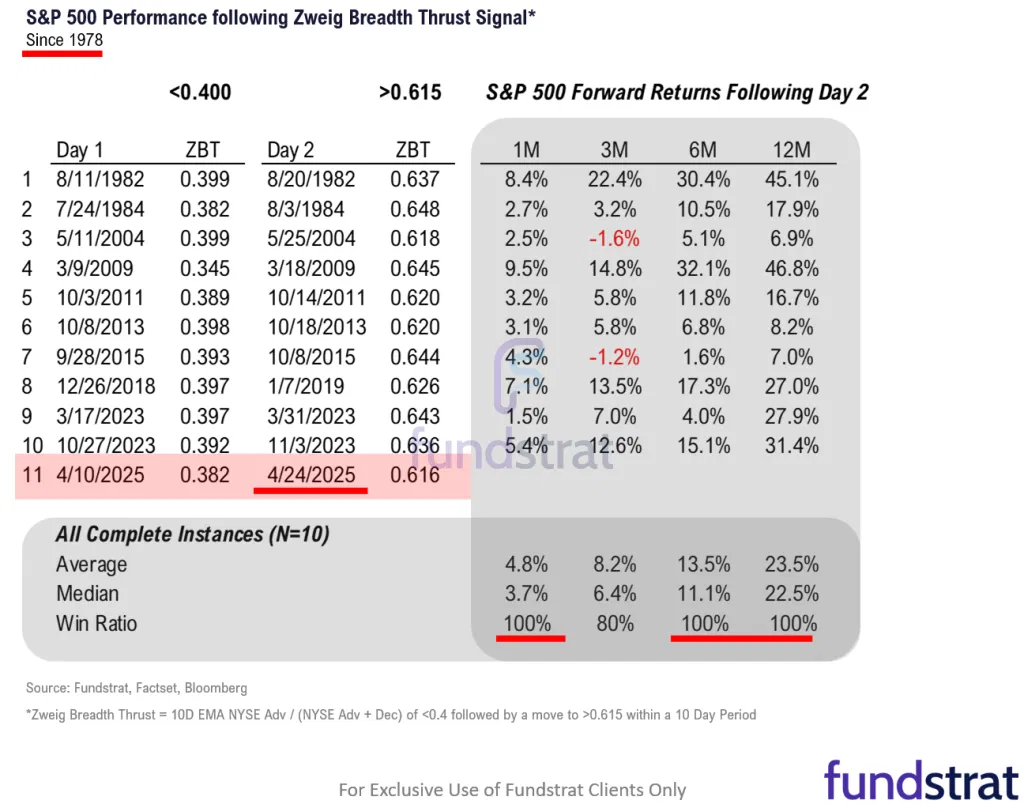
Both Head of Research Tom Lee and Head of Technical Strategy Mark Newton attached positive significance to the Zweig Breadth Thrust having been triggered on Thursday. Created by legendary investor Martin Zweig, this momentum indicator is triggered when a 10-day rolling average of advancing securities “thrusts” from below 40% (i.e., oversold) to above 61.5%. Our Chart of the Week illustrates Newton’s observation: “The median return going forward tends to be quite positive following a period of abnormally high market breadth happening from extremely low levels.”
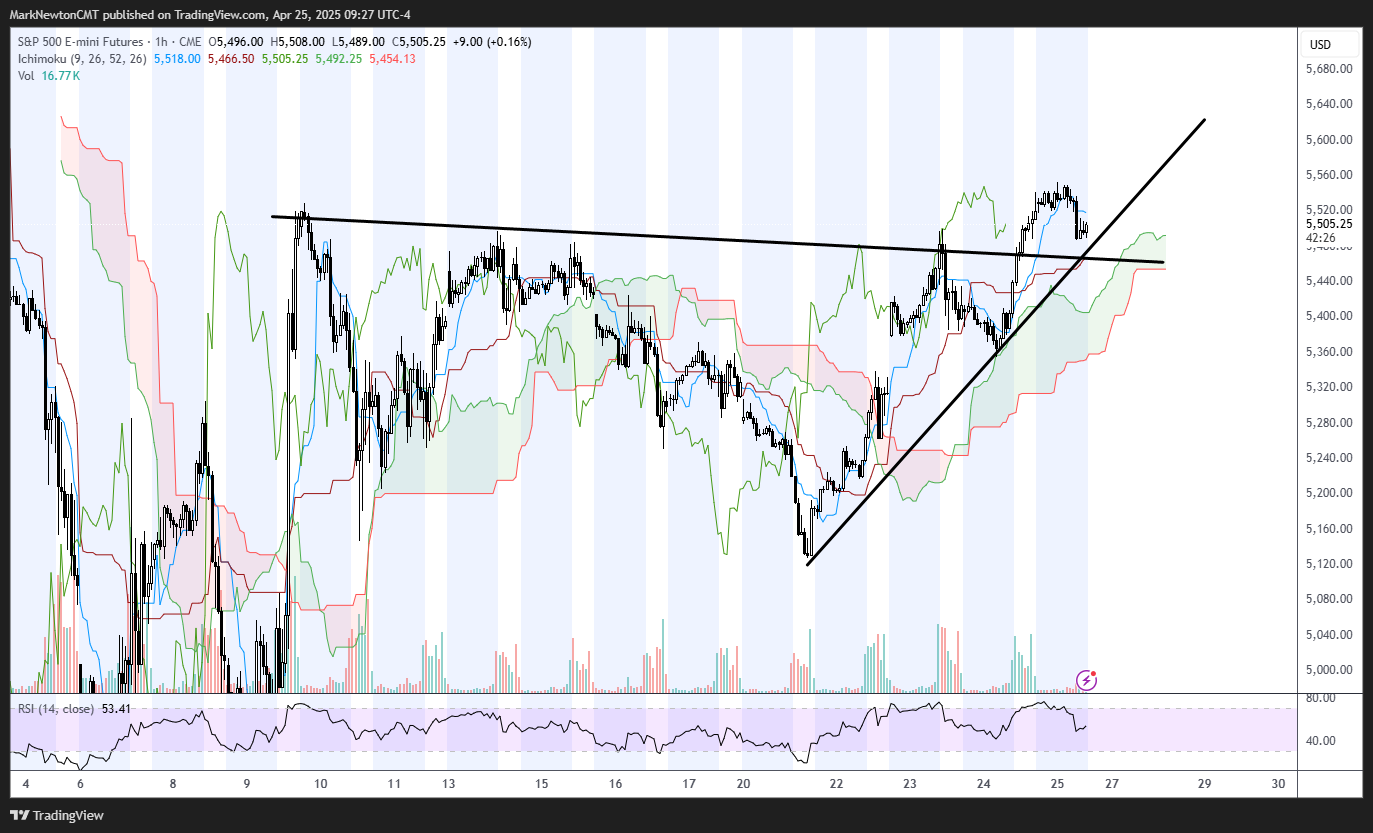
Happy Friday-Minor setback in US Equities at the open isn’t too meaningful, despite losses in INTC -6.84% , TMUS -11.36% , ODFL -7.65% , TER -0.23% , and GILD -2.47% today, all down more than 4%. For those focused on trade, it’s important to relay that Trump and his staff seem to be constantly telling the markets that trade deals are imminent. Note, this is 180* different than the constant tariff threats and Fed bashing rhetoric of the last few weeks. It seems like the POTUS Put is in effect and the Administration is desperate to do deals and to soothe the markets and business community. Key takeaway for markets for today, Yesterday’s breakout hasn’t reached completion, and this minor weakness should stabilize near current levels, and begin to turn higher up to near 5600 into next week possibly before some consolidation gets underway. My sources say that the month-end estimate for Pensions to buy is roughly $65 billion (between now and Month-end) which is the largest amount since COVID-19 era
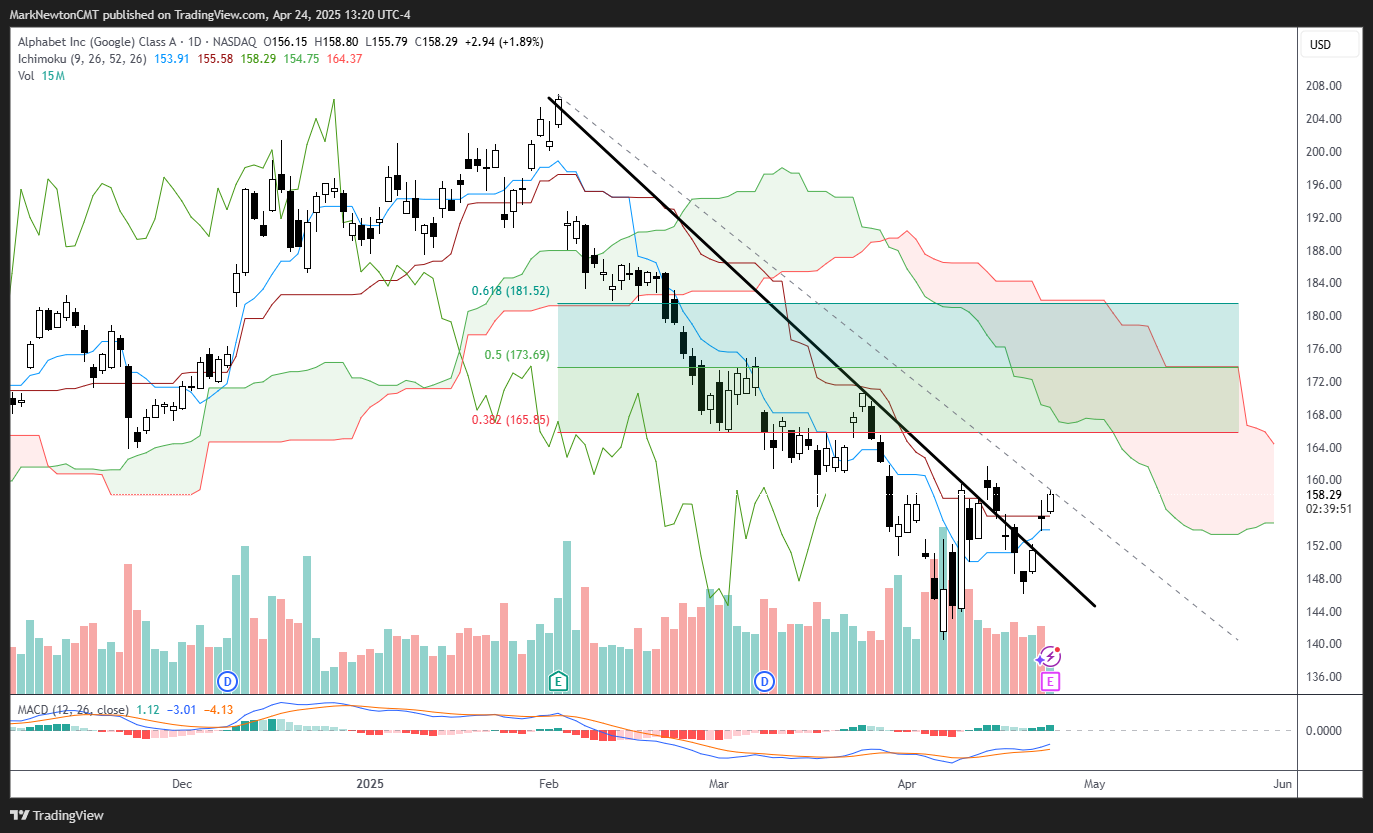
Ahead of this afternoon’s earnings report, GOOGL 1.52% likely can make progress between now and early next week, and has officially broken the downtrend from February peaks. GOOGL has beaten revenues for eight straight quarters, and ironic that Alphabet faces Antitrust issues at a time when its competition is likely greater than anytime in the last 15 years. Most of big-Cap Tech faces Antitrust concerns, but has managed to turn in a very good week thus far, leading all other sectors. GOOGL is expecting roughly a 10% rise in revenues and 7% rise in Earnings ($2.02 vs. $1.89) but has been showing signs of bottoming technically in the last couple weeks. I expect a move up to $166 which would be the first meaningful upside target for GOOGL and as daily charts show, also coincides with Ichimoku Cloud resistance. Today’s minor breakout in XLK and also on hourly charts of S&P should help Tech make further progress, and given GOOGL’s earnings tonight, its recent minor improvement coinciding with better momentum and technical structural improvement makes me positive that the stock can begin to push higher.
With President Trump talking up trade talks with China Commerce Ministry spokesperson He Yadong said Thursday that any “claims about the progress of China-U.S. trade negotiations are groundless as trying to catch the wind and have no factual basis.”
This research is for the clients of FS Insight only. FSI Subscription entitles the subscriber to 1 user, research cannot be shared or redistributed. For additional information, please contact your sales representative or FS Insight at fsinsight.com.
Conflicts of Interest
This research contains the views, opinions and recommendations of FS Insight. At the time of publication of this report, FS Insight does not know of, or have reason to know of any material conflicts of interest.
General Disclosures
FS Insight is an independent research company and is not a registered investment advisor and is not acting as a broker dealer under any federal or state securities laws.
FS Insight is a member of IRC Securities’ Research Prime Services Platform. IRC Securities is a FINRA registered broker-dealer that is focused on supporting the independent research industry. Certain personnel of FS Insight (i.e. Research Analysts) are registered representatives of IRC Securities, a FINRA member firm registered as a broker-dealer with the Securities and Exchange Commission and certain state securities regulators. As registered representatives and independent contractors of IRC Securities, such personnel may receive commissions paid to or shared with IRC Securities for transactions placed by FS Insight clients directly with IRC Securities or with securities firms that may share commissions with IRC Securities in accordance with applicable SEC and FINRA requirements. IRC Securities does not distribute the research of FS Insight, which is available to select institutional clients that have engaged FS Insight.
As registered representatives of IRC Securities our analysts must follow IRC Securities’ Written Supervisory Procedures. Notable compliance policies include (1) prohibition of insider trading or the facilitation thereof, (2) maintaining client confidentiality, (3) archival of electronic communications, and (4) appropriate use of electronic communications, amongst other compliance related policies.
FS Insight does not have the same conflicts that traditional sell-side research organizations have because FS Insight (1) does not conduct any investment banking activities, and (2) does not manage any investment funds.
This communication is issued by FS Insight and/or affiliates of FS Insight. This is not a personal recommendation, nor an offer to buy or sell nor a solicitation to buy or sell any securities, investment products or other financial instruments or services. This material is distributed for general informational and educational purposes only and is not intended to constitute legal, tax, accounting or investment advice.
The statements in this document shall not be considered as an objective or independent explanation of the matters. Please note that this document (a) has not been prepared in accordance with legal requirements designed to promote the independence of investment research, and (b) is not subject to any prohibition on dealing ahead of the dissemination or publication of investment research.
Intended for recipient only and not for further distribution without the consent of FS Insight.
This research is for the clients of FS Insight only. Additional information is available upon request. Information has been obtained from sources believed to be reliable, but FS Insight does not warrant its completeness or accuracy except with respect to any disclosures relative to FS Insight and the analyst’s involvement (if any) with any of the subject companies of the research. All pricing is as of the market close for the securities discussed, unless otherwise stated. Opinions and estimates constitute our judgment as of the date of this material and are subject to change without notice. Past performance is not indicative of future results. This material is not intended as an offer or solicitation for the purchase or sale of any financial instrument. The opinions and recommendations herein do not take into account individual client circumstances, risk tolerance, objectives, or needs and are not intended as recommendations of particular securities, financial instruments or strategies. The recipient of this report must make its own independent decision regarding any securities or financial instruments mentioned herein. Except in circumstances where FS Insight expressly agrees otherwise in writing, FS Insight is not acting as a municipal advisor and the opinions or views contained herein are not intended to be, and do not constitute, advice, including within the meaning of Section 15B of the Securities Exchange Act of 1934. All research reports are disseminated and available to all clients simultaneously through electronic publication to our internal client website, fsinsight.com. Not all research content is redistributed to our clients or made available to third-party aggregators or the media. Please contact your sales representative if you would like to receive any of our research publications.