Major stocks indexes pared back some of last week’s gains, hurt by the ever-changing tariffs policy and warning of a hit to a major chipmaker’s earnings.
The S&P 500 fell 1.5% this week, with the declines led by tech stocks. The consumer discretionary sector and information technology sector were the worst performers, down 3.2% and 3.6%, respectively. Meanwhile, the Nasdaq Composite fell 2.6%.
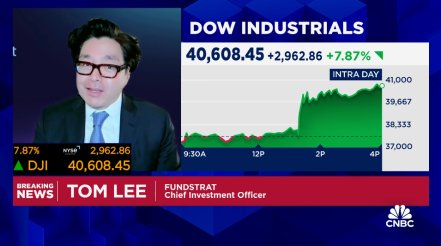
Despite being a holiday-shortened trading week, there was no shortage of market-moving events. On the tariffs-front, the percentage imposed by the U.S. on China became “further absurd,” rising to as much as 245%. Fundstrat Head of Research Tom Lee isn’t too worried about that number because he believes that this is not a normal market at this moment. “In this post-Liberation day environment, ‘headlines’ not fundamental developments drive market moves,” he said.
Another drag on markets came Wednesday morning when Nvidia said it would record a $5.5 billion charge on its quarterly earnings, after the U.S. asked it to require a license for exporting the company’s H20 processors to China and other countries. Head of Data Science “Tireless” Ken Xuan said during the weekly huddle that he likes that Nvidia Chief Executive Jensen Huang visited Beijing on Thursday to allegedly discuss new chip designs for Chinese customers.
The losses picked up steam later that afternoon when Federal Reserve Chair Jerome Powell warned that tariffs could make it harder for the central bank to address both of its dual mandates of stable prices and maximum employment.
The messaging was undoubtedly perceived hawkishly by investors and President Donald Trump, who said Thursday that the chair’s end of tenure “cannot come fast enough.”
But Xuan said that Powell wasn’t necessarily negative. “It has been the same message delivered by Powell, so nothing new. The Fed is basically in the wait-and-see game, which is fair because there are no clear signs” he said.
Sentiment and momentum, however, remain negative for now. Head of Technical Strategy Mark Newton said that, “it’s not unrealistic to think we’re still going to be choppy, but the bigger picture is that in the second half of the year, I expect it to be much better.”
Chart of the Week
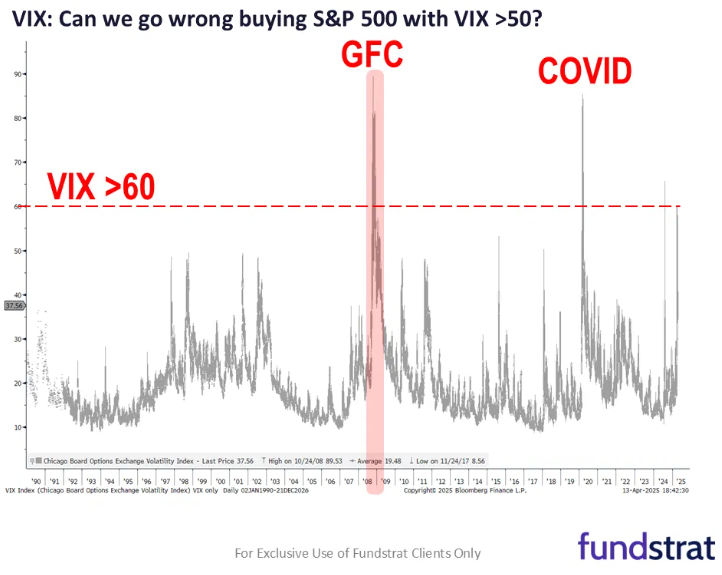
Fundstrat Head of Research Tom Lee likes that the VIX, considered to be Wall Street’s fear gauge, fell to about 30 after surging to 60. Historical data show that the VIX has surged above those levels only two other times. The first was during the financial crisis in 2008 and the second was during the onset of Covid-19 in 2020. Both of those instances were accompanied by stocks rallying furiously afterward. “The fact is—it is wise to buy stocks when the VIX is above 50, and especially when it makes a move back below 50,” Lee said.
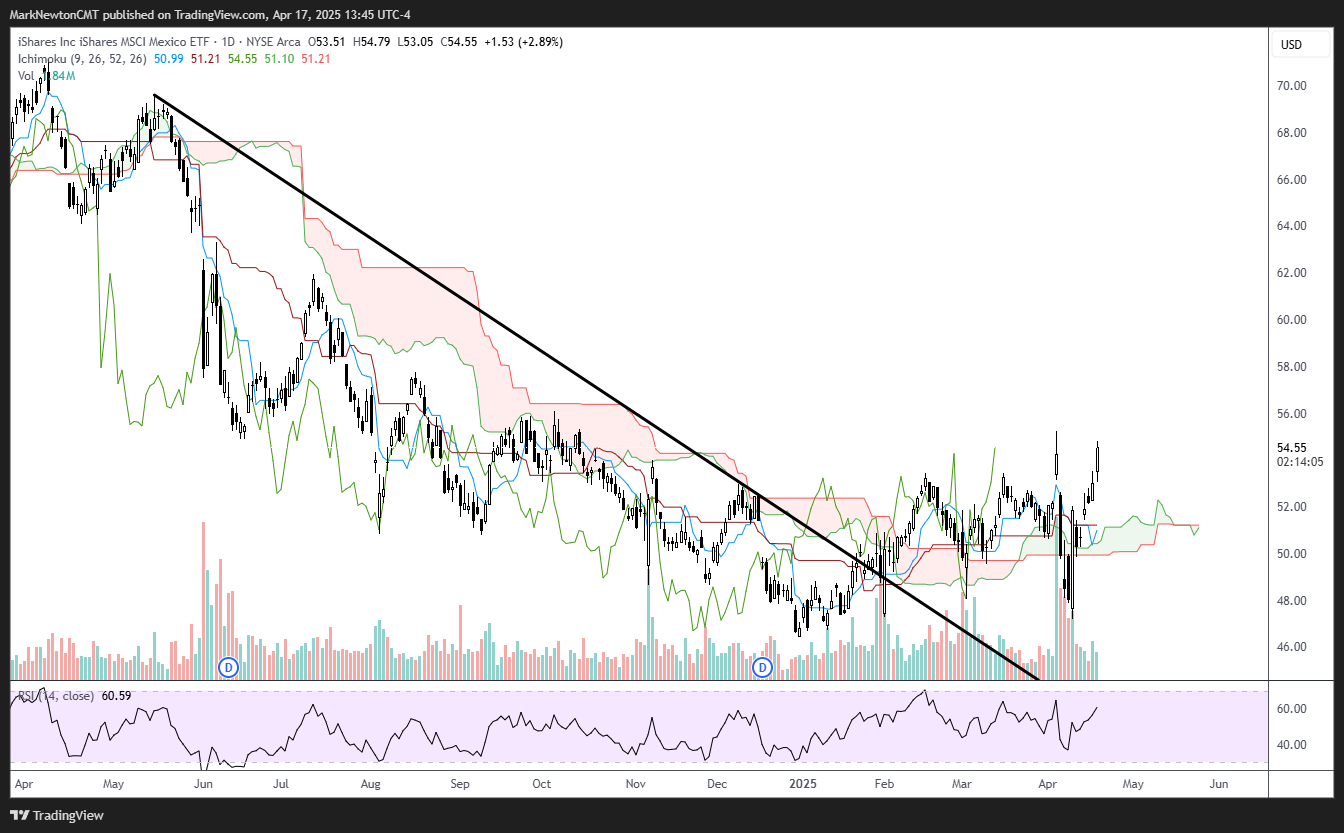
Mexico’s Equity ETF (EWW) has reached the highest levels since last October, after this week’s breakout. EWW along with INDA and the Ishares LatinAmerica 40 ETF (ILF) all look like attractive vehicles for those who are growing impatient with US technology
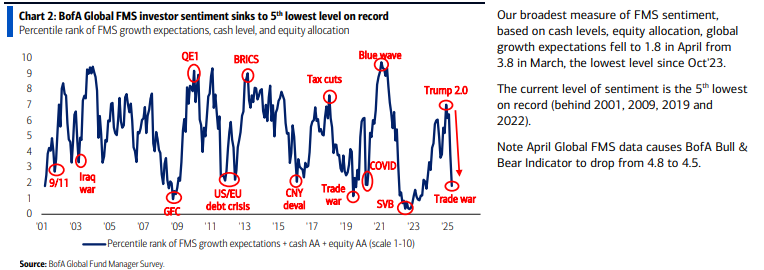
One more chart, courtesy of this month’s Bank of America Fund Manager Survey Investor sentiment. We see bellow that the current level of sentiment is the 5th lowest on record (behind 2001, 2009, 2019 and 2022) This gauge is based on cash levels (which rose to 4.8%, the largest 2 month increase since April 2020), along with Equity Allocation, and Fund Manager Survey Growth expectations.
This research is for the clients of FS Insight only. FSI Subscription entitles the subscriber to 1 user, research cannot be shared or redistributed. For additional information, please contact your sales representative or FS Insight at fsinsight.com.
Conflicts of Interest
This research contains the views, opinions and recommendations of FS Insight. At the time of publication of this report, FS Insight does not know of, or have reason to know of any material conflicts of interest.
General Disclosures
FS Insight is an independent research company and is not a registered investment advisor and is not acting as a broker dealer under any federal or state securities laws.
FS Insight is a member of IRC Securities’ Research Prime Services Platform. IRC Securities is a FINRA registered broker-dealer that is focused on supporting the independent research industry. Certain personnel of FS Insight (i.e. Research Analysts) are registered representatives of IRC Securities, a FINRA member firm registered as a broker-dealer with the Securities and Exchange Commission and certain state securities regulators. As registered representatives and independent contractors of IRC Securities, such personnel may receive commissions paid to or shared with IRC Securities for transactions placed by FS Insight clients directly with IRC Securities or with securities firms that may share commissions with IRC Securities in accordance with applicable SEC and FINRA requirements. IRC Securities does not distribute the research of FS Insight, which is available to select institutional clients that have engaged FS Insight.
As registered representatives of IRC Securities our analysts must follow IRC Securities’ Written Supervisory Procedures. Notable compliance policies include (1) prohibition of insider trading or the facilitation thereof, (2) maintaining client confidentiality, (3) archival of electronic communications, and (4) appropriate use of electronic communications, amongst other compliance related policies.
FS Insight does not have the same conflicts that traditional sell-side research organizations have because FS Insight (1) does not conduct any investment banking activities, and (2) does not manage any investment funds.
This communication is issued by FS Insight and/or affiliates of FS Insight. This is not a personal recommendation, nor an offer to buy or sell nor a solicitation to buy or sell any securities, investment products or other financial instruments or services. This material is distributed for general informational and educational purposes only and is not intended to constitute legal, tax, accounting or investment advice.
The statements in this document shall not be considered as an objective or independent explanation of the matters. Please note that this document (a) has not been prepared in accordance with legal requirements designed to promote the independence of investment research, and (b) is not subject to any prohibition on dealing ahead of the dissemination or publication of investment research.
Intended for recipient only and not for further distribution without the consent of FS Insight.
This research is for the clients of FS Insight only. Additional information is available upon request. Information has been obtained from sources believed to be reliable, but FS Insight does not warrant its completeness or accuracy except with respect to any disclosures relative to FS Insight and the analyst’s involvement (if any) with any of the subject companies of the research. All pricing is as of the market close for the securities discussed, unless otherwise stated. Opinions and estimates constitute our judgment as of the date of this material and are subject to change without notice. Past performance is not indicative of future results. This material is not intended as an offer or solicitation for the purchase or sale of any financial instrument. The opinions and recommendations herein do not take into account individual client circumstances, risk tolerance, objectives, or needs and are not intended as recommendations of particular securities, financial instruments or strategies. The recipient of this report must make its own independent decision regarding any securities or financial instruments mentioned herein. Except in circumstances where FS Insight expressly agrees otherwise in writing, FS Insight is not acting as a municipal advisor and the opinions or views contained herein are not intended to be, and do not constitute, advice, including within the meaning of Section 15B of the Securities Exchange Act of 1934. All research reports are disseminated and available to all clients simultaneously through electronic publication to our internal client website, fsinsight.com. Not all research content is redistributed to our clients or made available to third-party aggregators or the media. Please contact your sales representative if you would like to receive any of our research publications.