Stocks miraculously finished the week higher, reiterating the belief that the bull market isn’t going anywhere. The S&P 500 added 1.5% this week, despite a hotter-than-expected inflation report and worries about reciprocal tariffs. The broad-based index is up 4% this year.
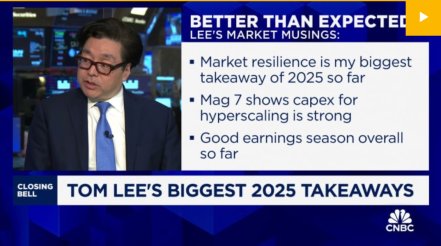
“The stock market has had many opportunities to sell-off, but it has been resilient,” Fundstrat Head of Research Tom Lee said.
On Wednesday, the Bureau of Labor Statistics reported that consumer prices rose 0.5% from a month ago on a seasonally adjusted basis. That marked the largest increase in the reading since August 2023. On an annual basis, headline CPI rose above 3% for the first time since June.
And just like that, investors were back to worrying about the progress on inflation stalling. The S&P 500 fell 0.3% on Wednesday. Bond yields jumped above 4.6%.
Lee, however, isn’t panicked by the jittery inflationary report, pointing out that Federal Reserve Chair Jerome Powell acknowledged the CPI print during his Congressional testimony, but did not suggest that the progress on inflation had stalled. “This implies the Fed still sees inflation cooling over time,” Lee added.
The market calmed down some Thursday after the producer-price index painted a better picture. That report could imply a softer personal-consumption expenditures report—the Fed’s preferred inflation gauge—as the components that feed into it from PPI were soft in January.
But for now, the market continues to be choppy.
“It’s a big chop-fest, where we haven’t seen a lot of satisfying movement,” Head of Technical Strategy Mark Newton said.
Chart of the Week
Core prices—which don’t include the volatile food and energy components—added 0.45% from December, the largest increase in nearly two years. Core inflation was up 3.3% from a year ago. However, it’s not nearly as bad upon a closer look. Head of Research Tom Lee said that’s because core CPI’s top five contributors—used cards and trucks, leased cars and trucks, auto insurance, shelter and motor vehicle fees—make up 0.37% of the 0.45% increase. In his view, inflation in those categories is not accelerating, nor is their rise in January sustainable.
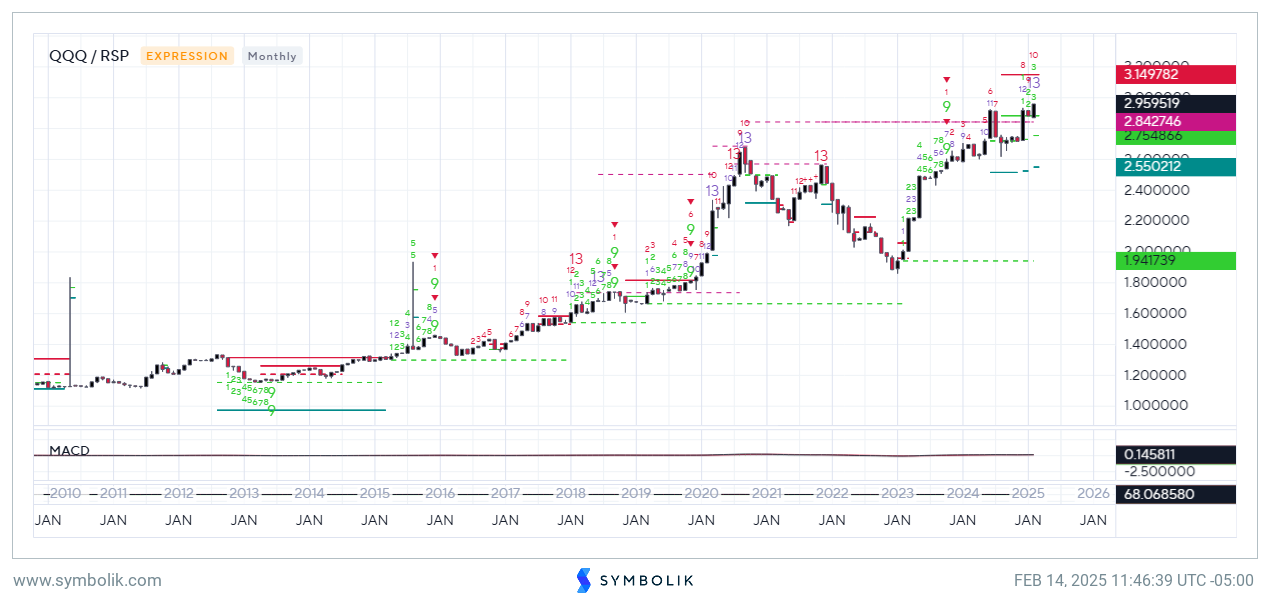
My technical thoughts are that this breakout should be led by Big-Cap Technology and QQQ 0.46% looks to the leader over SPY N/A% as well as RSP -0.10% . Furthermore, SPY N/A% looks to lead RSP -0.10% in relative strength until potentially mid-year, based on my interpretation of possible exhaustion counts setting up on these ratios. Thus, while many fret about valuation, or the degree of consecutive days of rally in stocks like META 1.25% , it should be right to favor the leaders, and expect that QQQ can continue to lead the US stock market, with Technology which powers QQQ showing better relative strength than many of the other sectors or indices
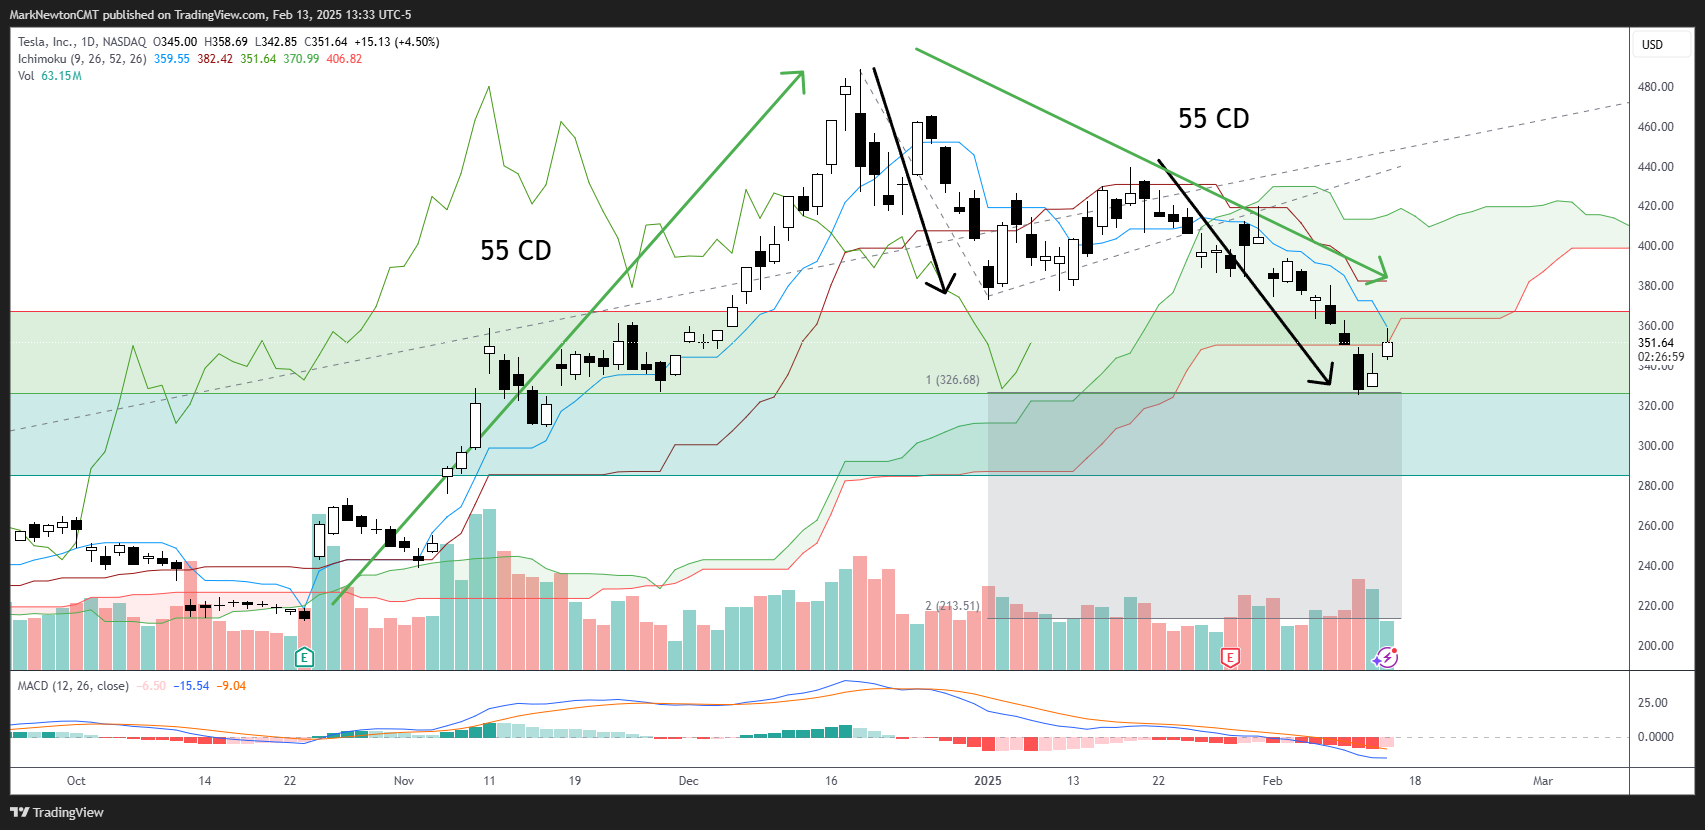
TSLA recovery wasn’t that unusual for those that study time and price, as the 55 Fibonacci-based calendar day advance from 10/23/24 to 12/17/24 was exactly mirrored by a pullback of that same duration of 55 days into 2/11/25, this past Tuesday, before this bottomed. Thus, the time on the advance was exactly equal to the decline which normally can cause a reaction. Moreover, TSLA had retraced nearly an exact 61.8% Fibonacci-based retracement of this prior 10/23-12/17 advance as well as 38.2% of the larger advance from early January 2023 before bottoming this week. While many argue that 61.8% wasn’t an exact hit, and they’re right, the decline from 12/18 into 1/2/25 was exactly the same distance as the subsequent decline from 1/17 into this past Tuesday, bottoming just above $325. While there are questions as to whether this was just “A low” vs. “The Low”, this won’t be known until TSLA gets back over prior lows which were breached in January which lie near $373. However, my cycle composite does show a bottom around 2/20-2/25 in TSLA before this rallies into April. For now, momentum remains quite negatively sloped and the most recent decline from 1/17 would benefit from a “final” decline down to $314, or the actual 50% retracement of the rally from last April 2024 low. I’ll be discussing TSLA in detail with Herbert Ong again live on 2/24 on his YouTube channel “Brighter with Herbert”
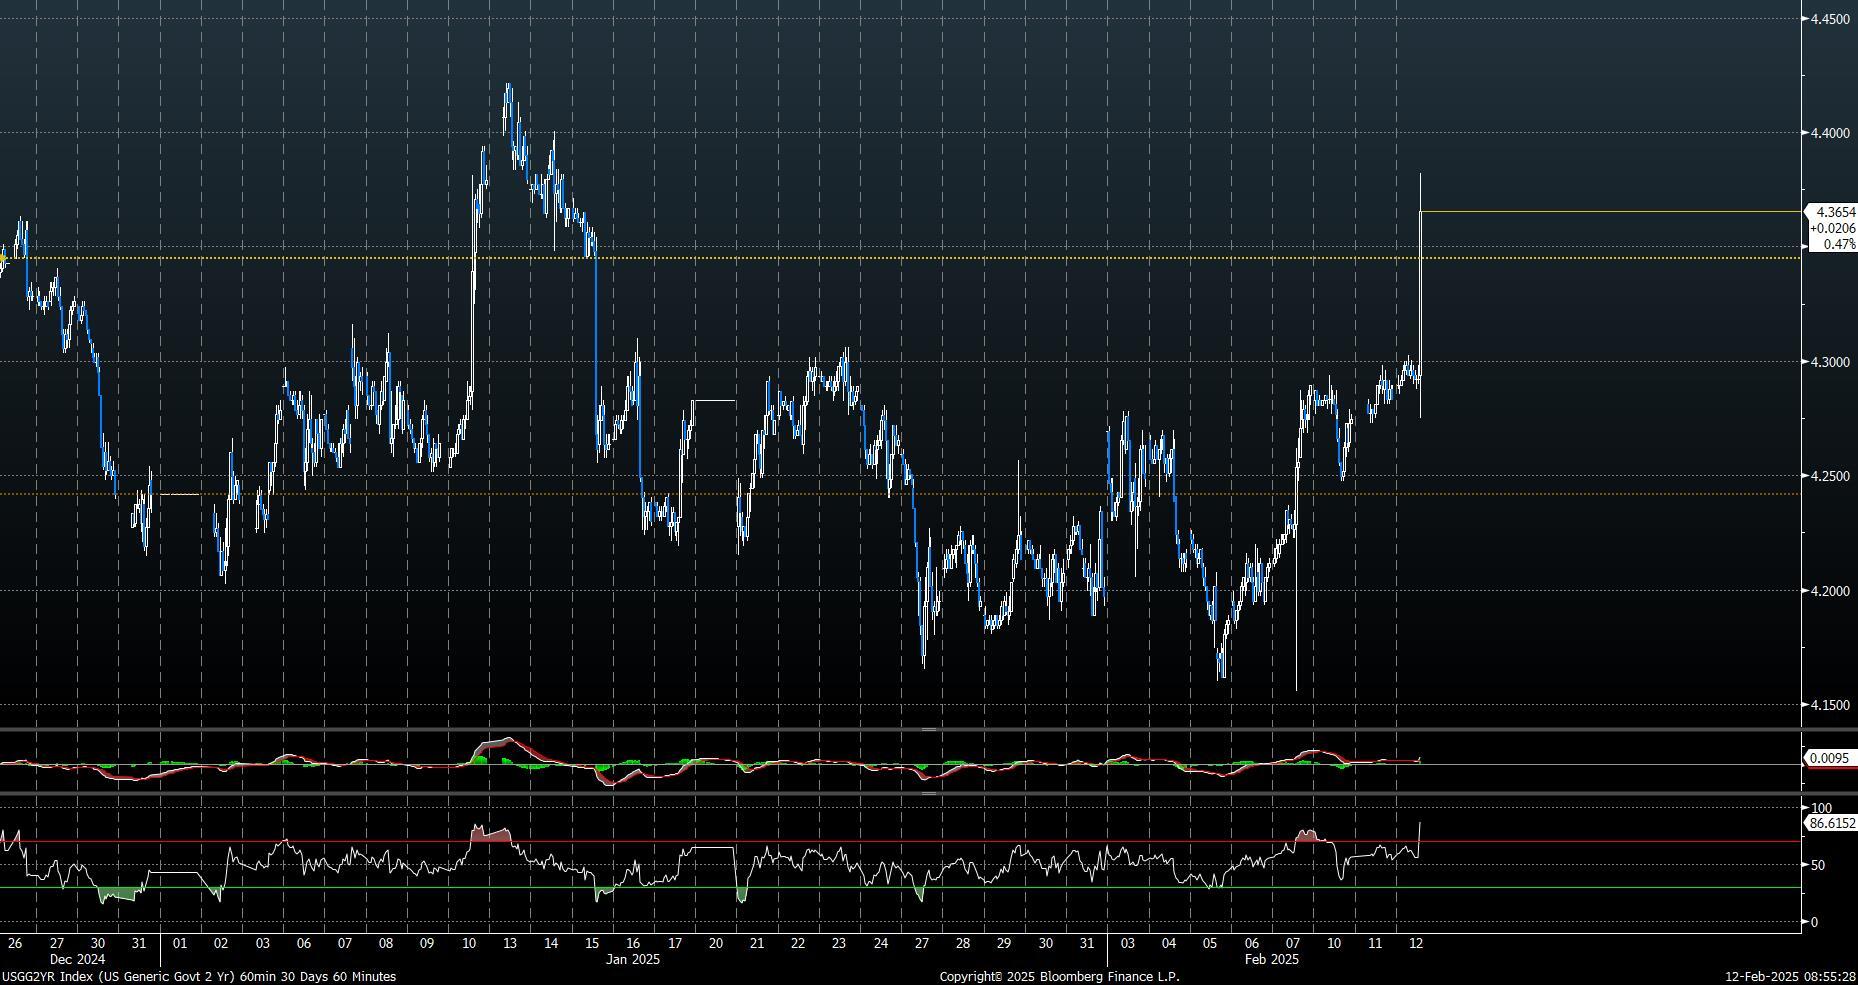
Early Market fireworks given much hotter than expected CPI of +0.4% vs. +0.3% Ex Food/Energy and +0.5% MoM vs. +0.3% – S&P and NASDAQ futures lower by more than 1%, while Bond yields and US Dollar spiking. This has taken S&P to levels near where they opened on Sunday evening in the overnight session. Powell set to speak in round 2 this morning in about an hour. Bottom line, this early weakness is not expected to lead to a break of February lows, but should prove short-lived as part of the final stretch of an ABC pattern that will likely reverse and allow for a move back to new highs. Overall, no technical damage to index futures, and 2-Year has made a brief spike up to just below mid-January peaks. I anticipate that any retest of 6000 for S&P would make this very attractive and do not expect a break of S&P Fut-5935 or SPX-5920
This research is for the clients of FS Insight only. FSI Subscription entitles the subscriber to 1 user, research cannot be shared or redistributed. For additional information, please contact your sales representative or FS Insight at fsinsight.com.
Conflicts of Interest
This research contains the views, opinions and recommendations of FS Insight. At the time of publication of this report, FS Insight does not know of, or have reason to know of any material conflicts of interest.
General Disclosures
FS Insight is an independent research company and is not a registered investment advisor and is not acting as a broker dealer under any federal or state securities laws.
FS Insight is a member of IRC Securities’ Research Prime Services Platform. IRC Securities is a FINRA registered broker-dealer that is focused on supporting the independent research industry. Certain personnel of FS Insight (i.e. Research Analysts) are registered representatives of IRC Securities, a FINRA member firm registered as a broker-dealer with the Securities and Exchange Commission and certain state securities regulators. As registered representatives and independent contractors of IRC Securities, such personnel may receive commissions paid to or shared with IRC Securities for transactions placed by FS Insight clients directly with IRC Securities or with securities firms that may share commissions with IRC Securities in accordance with applicable SEC and FINRA requirements. IRC Securities does not distribute the research of FS Insight, which is available to select institutional clients that have engaged FS Insight.
As registered representatives of IRC Securities our analysts must follow IRC Securities’ Written Supervisory Procedures. Notable compliance policies include (1) prohibition of insider trading or the facilitation thereof, (2) maintaining client confidentiality, (3) archival of electronic communications, and (4) appropriate use of electronic communications, amongst other compliance related policies.
FS Insight does not have the same conflicts that traditional sell-side research organizations have because FS Insight (1) does not conduct any investment banking activities, and (2) does not manage any investment funds.
This communication is issued by FS Insight and/or affiliates of FS Insight. This is not a personal recommendation, nor an offer to buy or sell nor a solicitation to buy or sell any securities, investment products or other financial instruments or services. This material is distributed for general informational and educational purposes only and is not intended to constitute legal, tax, accounting or investment advice.
The statements in this document shall not be considered as an objective or independent explanation of the matters. Please note that this document (a) has not been prepared in accordance with legal requirements designed to promote the independence of investment research, and (b) is not subject to any prohibition on dealing ahead of the dissemination or publication of investment research.
Intended for recipient only and not for further distribution without the consent of FS Insight.
This research is for the clients of FS Insight only. Additional information is available upon request. Information has been obtained from sources believed to be reliable, but FS Insight does not warrant its completeness or accuracy except with respect to any disclosures relative to FS Insight and the analyst’s involvement (if any) with any of the subject companies of the research. All pricing is as of the market close for the securities discussed, unless otherwise stated. Opinions and estimates constitute our judgment as of the date of this material and are subject to change without notice. Past performance is not indicative of future results. This material is not intended as an offer or solicitation for the purchase or sale of any financial instrument. The opinions and recommendations herein do not take into account individual client circumstances, risk tolerance, objectives, or needs and are not intended as recommendations of particular securities, financial instruments or strategies. The recipient of this report must make its own independent decision regarding any securities or financial instruments mentioned herein. Except in circumstances where FS Insight expressly agrees otherwise in writing, FS Insight is not acting as a municipal advisor and the opinions or views contained herein are not intended to be, and do not constitute, advice, including within the meaning of Section 15B of the Securities Exchange Act of 1934. All research reports are disseminated and available to all clients simultaneously through electronic publication to our internal client website, fsinsight.com. Not all research content is redistributed to our clients or made available to third-party aggregators or the media. Please contact your sales representative if you would like to receive any of our research publications.